Triple bottom candlestick pattern:
-
Atiya1918Member

- Sep 2023
- 76
- 1
-
<a href="https://www.instaforex.org/ru/?x=ruforum">InstaForex</a> -
Atiya1918Member
- Sep 2023
- 76
- 1
WHAT IS THE TRIPLE BOTTOM CANDLESTICK PATTERN? Triple Bottom candlestick pattern forex trading ma ak reversal pattern ha jo am tor par ak downtrend ka ant ma hota ha. Is pattern ma, price chart par lagbhAssistant: Jisme teen marmik bottoms ya low points ha, jinka lagbhag same price level par hone chahiye. Ye ak bullish pattern ha, kyunke ye downtrend ke reversal or future ma possible uptrend ke darsha karta ha. Triple bottom pattern ma pehla bottom banta ha, uska baad temporary bounce hote ha, phir dusra bottom banta ha, uska baad bounce hote ha, or ant ma teesra bottom banta ha. Ye teen bottoms price ma saman hone chahiye ya lagbhag ak dusre ka pass hone chahiye. IDENTIFYING THE TRIPLE BOTTOM CANDLESTICK PATTERN: Triple bottom candlestick pattern ko pehchanne ka liye, traders ko price chart ko dhyan se samajhna hoga. Wo teen bottoms ke series ko dhundhna hoga, jo lagbhag same price level par bante ha. Har bottom ka baad price ka minor bounce hota ha, phir price niche jati ha or agli bottom banati ha. Ye teen bottoms ke price saman ya kareeb saman honi chahiye. Traders technical indicators jaise ke moving averages, support or resistance levels, or volume analysis ka istemal kar sakte ha, take triple bottom pattern ke validity ko confirm keya ja saka. CONFIRMATION OF THE TRIPLE BOTTOM CANDLESTICK PATTERN: Triple bottom candlestick pattern ko confirm karna traders ka liye bahut zaroori ha, pehle bullish position ma enter hone se pehle. Traders ko second or third bottoms ka beech banne wale resistance level ka upar breakout ka wait karna chahiye. Breakout ko high trading volume ka saath hona chahiye, kyunke ye strong buying pressure ko indicate karta ha or pattern ke validity ko confirm karta ha. Additionally, traders kesi or technical indicator jaise ke Relative Strength Index (RSI) ya Stochastic Oscillator ka istemal kar sakte ha, overbought conditions ko identify karne ka liye, jo pattern ke confirmation ko or bhi strong karta ha. TRADING THE TRIPLE BOTTOM CANDLESTICK PATTERN: Jab triple bottom candlestick pattern confirm ho jata ha, tab traders entry or exit points dhundh sakte ha, taake potential uptrend ko capitalize keya ja saka. Entry point typically second or third bottoms ka beech banne wale resistance level ka upar hota ha. Traders lowest point of the pattern se thoda niche stop-loss order set kar sakte ha, take agar pattern fail hota ha toh potential losses limit keye ja saka. Profit target tops of the pattern ka distance ko measure karka breakout point se upar project karka set keya ja sakta ha. Additionally, traders trailing stop-loss orders ka istemal kar sakte ha, take trending markat ma profits maximize keye ja saka. LIMITATIONS OF THE TRIPLE BOTTOM CANDLESTICK PATTERN: Triple bottom candlestick pattern ak reliable reversal pattern ho sakta ha, laken ye bilkul foolproof nahi ha or kuch limitations ka saath aata ha. False breakouts ho sakte ha, jiske wajah se traders losses face kar sakte ha agar wo positions pehle hi enter kar le. Traders ko hamesha dusre technical factors ko bhi consider karna chahiye or risk management strategies ka istemal karka potential risks ko minimize karna chahiye. Additionally, ye pattern hamesha strong or sustained uptrend ka result nahi deta. Isliye trading decisions sirf triple bottom candlestick pattern par adharit karne se pehle overall markat conditions or dusre markat participants ka sentiments ko bhi dhyan ma rakhna zaroori ha. -
SkydiversSenior Member
- Mar 2023
- 1444
- 239
- 368
- 579 USD
InstaSpot: کسی بھی EPS اور بینک سے منافع واپس لیں، اور EPS اور cryptocurrencies کے تبادلے پر 7% تک کمائیں۔
Triple bottom candlestick pattern ko samajhne se pehle, hume pehle candlesticks ka concept samajhna zaroori hai. Candlestick patterns ek prakar ka technical analysis hai jisme traders candlestick charts ka istemal karte hain taake market ki movements aur price trends ko samajh sakein. Har candlestick chart ek specific time period ki price action ko darust darust dikhata hai, jisme har ek candlestick ek time period ko represent karta hai, jaise ke ek din, ek ghanta ya ek minute. Candlestick patterns ko samajh kar traders market trends aur future price movements ka anuman laga sakte hain.
Formation of the Triple Bottom Pattern
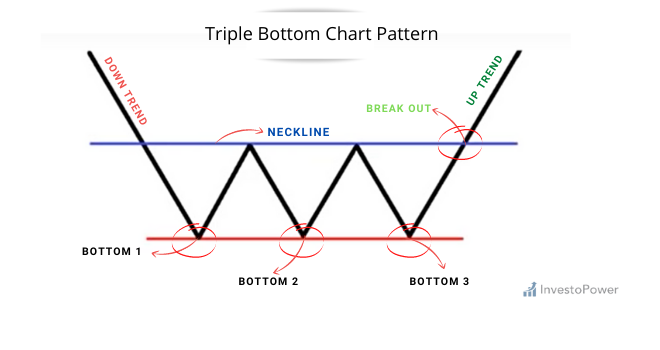
Triple bottom candlestick pattern ek bullish reversal pattern hai jo market ke neeche ki taraf ka trend ko ant karta hai aur upar ki taraf ka movement shuru karta hai. Is pattern mein teen lows hote hain jo ek saath bante hain aur ek specific shape ko banate hain jo traders ko ek possible trend reversal ka indication deta hai.
Interpreting the Triple Bottom Pattern
Triple bottom candlestick pattern mein teen bottoms ya lows hoti hain. Ye teen lows ek saath hote hain aur ek horizontal line ke qareeb hote hain. Jab ye teen bottoms ek horizontal line ke qareeb ya ek dosre ke qareeb hote hain, to ye ek potential triple bottom pattern ki nishani hai.
Price Movements
Triple bottom pattern mein, jab market ek bottom par aata hai, to price neeche jaata hai aur phir se upar aata hai, lekin pehle wale bottom se zyada neeche nahi jaata. Phir dobara price neeche jaata hai lekin pehle wale bottom se neeche nahi jaata. Jab teesri dafa price neeche jaata hai aur phir se upar aata hai, to ye ek bullish signal hai aur traders ko ye indicate karta hai ke trend ka reversal hone wala hai.
Volume
Triple bottom pattern ko samajhne ke liye volume bhi ek important factor hai. Agar teesri bottom par price upar ja rahi hai aur us waqt volume bhi badh raha hai, to ye ek aur confirmation hai ke trend ka reversal hone wala hai. Volume ke saath price movement ka sambandh hota hai aur agar volume ke saath price upar ja rahi hai to ye ek strong bullish signal hai.
Confirmation
Triple bottom pattern ko confirm karne ke liye, traders ko price ke upar break hone ka wait karna hota hai. Jab price teesri bottom ke upar break karti hai aur ek specific level ko cross karti hai, to ye ek confirmation hai ke trend reversal hone wala hai. Traders ko is level ko ek stop loss level ke roop mein bhi istemal kar sakte hain.
Trading Strategy
Triple bottom pattern ki trading strategy mein, traders ko teesri bottom ke upar buy karne ka wait karna hota hai jab price ek specific level ko cross karta hai. Stop loss ko pehli bottom ke neeche rakha ja sakta hai aur target ko upar ki taraf set kiya ja sakta hai, jisme traders ko ek potential profit mil sakta hai.
Real-life Example
Ek real-life example ke roop mein, ek stock ka price ek saal tak continuously neeche ja raha hai aur teen baar ek specific level ke qareeb aa kar upar ja raha hai, lekin wo level cross nahi kar pa raha hai. Jab teesri baar price us level ke upar break karta hai aur volume bhi badh raha hai, to ye ek indication hai ke trend ka reversal hone wala hai aur traders ko buy karne ka mouka mil sakta hai.
Risk Management
Har trading strategy mein risk management ka hona bahut zaroori hai. Triple bottom pattern ki trading mein bhi stop loss ka istemal zaroori hai taake agar trade galat ho gaya to nuksan kam ho sake. Stop loss ko pehli bottom ke neeche set kiya ja sakta hai aur position size ko bhi control mein rakha ja sakta hai taake zyada nuksan hone se bacha ja sake.
Limitations
Triple bottom pattern ki bhi kuch limitations hain. Kabhi kabhi price ek specific level ke upar break nahi kar paata hai aur ye pattern fail ho jata hai. Isliye, ek hi pattern par poora bharosa na rakhein aur always ek aur confirmatory signal ka wait karein.
Triple bottom candlestick pattern ek powerful technical analysis tool hai jo traders ko market trends aur price movements ko samajhne mein madad karta hai. Is pattern ki samajh aur istemal se traders ko potential profitable trading opportunities mil sakti hain. Lekin, is pattern ko samajhne ke liye practice aur experience zaroori hai aur hamesha risk management ka dhyan rakha jana chahiye. Triple bottom pattern ke saath sahi risk management aur confirmatory signals ka istemal karke traders apne trading performance ko improve kar sakte hain.
Believe in yourself and your abilities. When you fight for your dreams, you can achieve anything.
-
Saim70Banned
- Oct 2021
- 708
- 375
- 806
- 319 USD
Triple Bottom Candlestick Pattern:
Triple Bottom Candlestick Pattern ek mashhoor mum pattern hai jo "Triple Bottom" ke naam se jaana jaata hai. Yeh ek bullis pattern hai jo aam tor par bemariyon ke baad ek bade bull market ke baad nazar aata hai.
Is pattern ko tashkhees dene ke liye teen shamaon ki zaroorat hoti hai. Pehli shama, jo ek lambi giraawat wali shama hoti hai, ek maujooda bull market mein dikhayi deti hai. Dusri shama ek chhoti bull shama hoti hai jo pehli shama ki jism ke andar ki taraf girti hai. Teesri shama, jo ek bull shama hoti hai, pehli shama ki bulandi tak pohanchti hai aur ek bade bull market ka aghaaz ka nishan hoti hai.
Triple Bottom Pattern ki quwwat us ki moassar tasdeeq mein hai. Jab yeh pattern ek bade miyaar ke baad nazar aata hai, to ek moassar bull ki harkat ki tasdeeq hoti hai aur investors ko afzal moqa faraham kiya jaata hai. Is pattern ko madad se investors mukhtalif market ki suratahalon ko samajh sakte hain aur unke investment ke faislon ko behtar bana sakte hain.
Tawajjuh: Yahan tajruba kar aur financial expert ki rahnumai ke baghair invest karne se pehle apne muaarri tijarati protocols ka itlaaq karein.
-
KhanisbackSenior Member
- May 2023
- 163
- 2
- 88
- 84 USD
Triple bottom candlestick pattern
Triple bottom candlestick pattern ek bullish reversal pattern hai jo chart analysis mein istemal hota hai. Ye pattern typically bearish trend ke baad develop hota hai aur bullish trend ki shuruaat ke indication ke roop mein dekha jaata hai.

Yahan triple bottom candlestick pattern ki kuch key characteristics hain:- Formation: Triple bottom pattern teen lows se banta hai jo approximately ek hi level par hote hain. Ye lows ek bearish trend ke doran form hote hain jab price ek support level par dobara se rebound karta hai. Har bottom ek support level ko indicate karta hai jahan se price ko reject kiya gaya hai aur buyers ne price ko upar le jane ki koshish ki hai.
- Volume: Pattern ke formation ke dauran volume ka bhi analysis kiya jata hai. Agar pattern ke lows ke saath increasing volume ho, to ye pattern ka strength aur validity ko indicate karta hai.
- Confirmation: Triple bottom pattern ko confirm karne ke liye, traders typically doosre technical indicators ya price action signals ka istemal karte hain. Ek bullish reversal candlestick pattern ya doosra bullish momentum indicator jaise ki RSI ki bullish divergence, ye pattern ko confirm kar sakte hain.
- Breakout: Triple bottom pattern ko validate karne ke liye, traders ek breakout ki wait karte hain. Breakout tab hota hai jab price resistance level ko break karke upar move karta hai aur bullish trend shuru hota hai.
- Price Target: Pattern ke breakout ke baad, traders price target ka estimation karte hain. Ek common approach hai ki traders price ka distance measure karte hain between pattern ke lowest low se resistance level tak, aur usse breakout point se upar project karte hain. Ye price target bullish move ka estimation provide karta hai.
Conclusion
Triple bottom pattern bullish reversal ke liye strong indication hai, lekin traders ko confirmatory signals aur proper risk management ke saath sahi trading decisions lena chahiye. As with any technical pattern, false signals ki possibility hoti hai, isliye caution aur confirmation ke sath trade karna zaroori hai.
-
Jugnoo923Senior Member
- Jan 2024
- 1728
- 1212
- 435
- 700 USD
InstaSpot: کسی بھی EPS اور بینک سے منافع واپس لیں، اور EPS اور cryptocurrencies کے تبادلے پر 7% تک کمائیں۔
Triple bottom candlestick pattern ko samajhna trading mein bohot ahem hai. Ye ek technical analysis tool hai jo traders ko market trends ko samajhne mein madad karta hai. Triple bottom pattern ek bullish reversal pattern hota hai jo indicate karta hai ke market downtrend se uptrend mein ja sakta hai.اصل پيغام ارسال کردہ از: Atiya1918 پيغام ديکھيے
Triple bottom pattern tab ban sakta hai jab market ek downtrend ke baad neeche gir ke ruk jata hai aur phir teen baar ek level par bottom banata hai. Har bottom ko normally ek U-shaped structure mein represent kiya jata hai. Ye teen bottoms ek saath aate hain aur ek particular support level ke aas paas hote hain. Jab market teesri baar se wahi level touch karta hai aur phir se upar jaane lagta hai, to ye ek strong indication hoti hai ke market ka trend change hone wala hai.
Triple bottom pattern ka ek key element hota hai volume. Normally, jab teesri bottom form hoti hai, volume significant taur par increase hota hai. Ye increase in volume indicate karta hai ke traders mein interest badh gaya hai aur bullish momentum shuru hone wala hai.
Ek baar triple bottom pattern complete ho jata hai, traders normally ek entry point dhundte hain. Entry point usually wahi hota hai jab market teesri bottom ke upar se break karta hai aur ek uptrend shuru karta hai. Traders apne stop loss levels aur target prices ko bhi set karte hain taki unka risk manage ho sake.
Triple bottom pattern ko confirm karne ke liye, traders aur analysts dusri technical indicators aur tools ka bhi istemal karte hain jaise ki moving averages, RSI (Relative Strength Index), aur MACD (Moving Average Convergence Divergence). In sabhi tools ki madad se confirm kiya ja sakta hai ke pattern sahi hai ya nahi.
Is pattern ka istemal karne se pehle, traders ko dhyan mein rakhna chahiye ke koi bhi single indicator ya pattern 100% accurate nahi hota hai. Market mein hamesha uncertainty hoti hai aur kisi bhi waqt kuch bhi ho sakta hai. Isliye, risk management ka dhyan rakhna zaroori hai.
Triple bottom pattern ke opposite, triple top pattern bhi hota hai jo bearish reversal ko indicate karta hai. Ismein bhi same concept hota hai, lekin yahan par market pehle se upar gaya hua hota hai aur phir teen baar ek level par top banata hai.
In conclusion, triple bottom candlestick pattern ek powerful tool hai jo traders ko market trends samajhne mein madad karta hai. Ye pattern downtrend ke baad uptrend ka indication deta hai aur traders ko entry points provide karta hai. Lekin, is pattern ka istemal karne se pehle proper analysis aur risk management ki zaroorat hoti hai
-
Shahzad87Senior Member
- Nov 2023
- 449
- 10
- 31
- 234 USD
Triple Bottom Pattern ek technical analysis concept hai jo stocks ya anya financial instruments ke chart par dekha jata hai. Ye pattern market mein trend reversal ko darust karta hai,
1. Importance of Triple Bottom Pattern:
Triple Bottom Pattern ka asal maqsad hota hai ke stock ka price teen mukhtalif dafa ek specific level tak gir kar phir se wahan se uthna,
2. Triple Bottom Pattern ki pehchan:
Is Pattern ko pehchanne ke liye traders ko chart par three mukhtalif bottoms ko observe karna hota hai jo ke ek dusre ke qareeb hote hain,
3. How Triple Bottom Pattern is formed:
Triple Bottom Pattern ki tashkeel mein pehle price ka girna hota hai phir teen mukhtalif dafa wohi level touch hota hai jahan se price pehle gir chuki thi,
4. Volume ki Ahmiyat:
Is Pattern ke tashkeel mein volume ki ahmiyat hoti hai. Agar volume bhi sath mein increase ho raha hai to ye pattern mazboot hota hai,
5. Triple Bottom Pattern ka Confirmation:
Triple Bottom Pattern ko tasdeeq karne ke liye traders ko price movement aur volumes ko closely monitor karna chahiye,
6. Risks and Considerations:
Har technical pattern ki tarah, Triple Bottom Pattern mein bhi risk aur considerations hote hain jo traders ko samajhna zaroori hai,
7. Trading Strategies:
Triple Bottom Pattern ke observation par traders apni trading strategies banate hain jin me pattern ke mutabiq entry aur exit points shamil hote hain,
8. Time Frame Analysis:
Triple Bottom Pattern ko dekhne mein time frame ka analysis bhi zaroori hai. Chhote aur lambe time frames par pattern ki dekhai jane wali impact mein farq hota hai,
Triple Bottom Pattern ek ahem technical indicator hai jo traders ko market ke trend reversal ke bare mein agah karta hai. Iski samajh aur sahi tajziya karne se traders apni trading strategies ko mazeed behtar bana sakte hain -
Asim14Senior Member
- Sep 2023
- 794
- 25
- 185
- 326 USD
Triple bottom candlestick pattern:
Triple Bottom Candlestick Pattern ek technical analysis ka tareeqa hai jo financial markets, jaise ke stocks, currencies, commodities, mein istemal hota hai. Yeh pattern traders aur investors ko market ke potential reversals ka pata lagane mein madad karta hai.
Triple Bottom Kya Hai?
Triple Bottom ek chart pattern hai jo market mein downtrend ke baad hone wale reversals ko darust karti hai. Is pattern mein price three baar ek aise level par gir kar stabilizes hoti hai aur har baar se wapas upar ki taraf move karti hai. Har bottom ko ek "trough" ke roop mein dekha jata hai, aur jab yeh teen bar ho jaate hain, to ise Triple Bottom kehte hain.
Kaise Pehchane:
Triple Bottom Candlestick Pattern ko pehchanna asaan hota hai. Jab market mein price three baar aik specific level par gir kar stabilize hoti hai aur uske baad upar ki taraf move karti hai, to yeh pattern form hota hai. Har bottom ke aas-pass candlestick patterns, jaise ke hammer ya doji, bhi dekhe ja sakte hain.
Trading Strategy:
Triple Bottom Pattern ka pehchanna trading strategy ko improve karne mein madad karta hai. Jab yeh pattern form hota hai, to traders ko yeh ishara milta hai ke market mein bearish trend weaken ho sakta hai aur bullish reversal hone ke chances hote hain. Is point par traders long positions lete hain, ya existing short positions ko close karte hain.
Risks and Considerations:
Har trading strategy ki tarah, Triple Bottom Pattern bhi 100% guarantee nahi deta. Market dynamics hamesha badalte rehte hain aur false signals bhi a sakte hain. Traders ko hamesha risk management ka dhyan rakhna chahiye aur doosre technical indicators aur analysis tools ke saath is pattern ko confirm karna chahiye.
Conclusion:
Triple Bottom Candlestick Pattern ek important tool hai jo market ke reversals ko samajhne mein madad karta hai. Traders ko chahiye ke is pattern ko samajhe aur apne trading decisions mein istemal kare, lekin hamesha dhyan rahe ke market mein kisi bhi waqt par kuch bhi ho sakta hai, isliye cautious rehna zaroori hai. -
PantsSenior Member
- Jun 2024
- 2463
- 5
- 28
- 560 USD
InstaSpot: کسی بھی EPS اور بینک سے منافع واپس لیں، اور EPS اور cryptocurrencies کے تبادلے پر 7% تک کمائیں۔
**Triple Bottom Candlestick Pattern: Ek Tajziya**
Forex trading aur technical analysis mein candlestick patterns market ke reversal signals ko identify karne mein madadgar hote hain. In patterns mein se ek prominent pattern hai "Triple Bottom Candlestick Pattern." Yeh pattern market ke reversal aur potential trend change ko denote karta hai. Is post mein, hum Triple Bottom pattern ki definition, characteristics, aur trading strategies ko detail mein samjhenge.
**Triple Bottom Pattern Ki Definition**
Triple Bottom Pattern ek bullish reversal pattern hai jo downtrend ke baad develop hota hai aur price ke upward movement ka signal deta hai. Yeh pattern teen distinct troughs (lows) se mil kar banta hai jo ek horizontal support level par bante hain. In troughs ke beech price temporary rally karti hai, lekin phir se support level par wapas aati hai. Jab pattern complete hota hai, to yeh potential trend reversal ko indicate karta hai.
**Characteristics of Triple Bottom Pattern**
1. **Three Troughs**: Triple Bottom Pattern mein teen alag troughs ya lows hoti hain jo horizontal support level par bante hain. Yeh troughs market ke repeated attempts ko denote karti hain jo support level ko break karne ki koshish karte hain, lekin fail ho jati hain.
2. **Horizontal Support Level**: Teen troughs ek horizontal support level ke around bante hain. Yeh support level ek important technical level hota hai jo market ke downward pressure ko absorb karta hai aur price ko wapas upar ki taraf push karta hai.
3. **Volume**: Volume pattern ke formation ke dauran bhi important role play karta hai. Pehle trough ke dauran volume generally high hota hai, jabki second aur third troughs ke dauran volume gradually decrease hota hai. Pattern ke complete hone par, volume ka increase bullish confirmation ko denote karta hai.
4. **Confirmation**: Pattern ki complete hone ke baad, bullish confirmation ki zaroorat hoti hai. Yeh confirmation generally ek breakout candle ke form mein hoti hai jo support level ko upar ki taraf break karti hai.
**Trading Strategies Aur Risk Management**
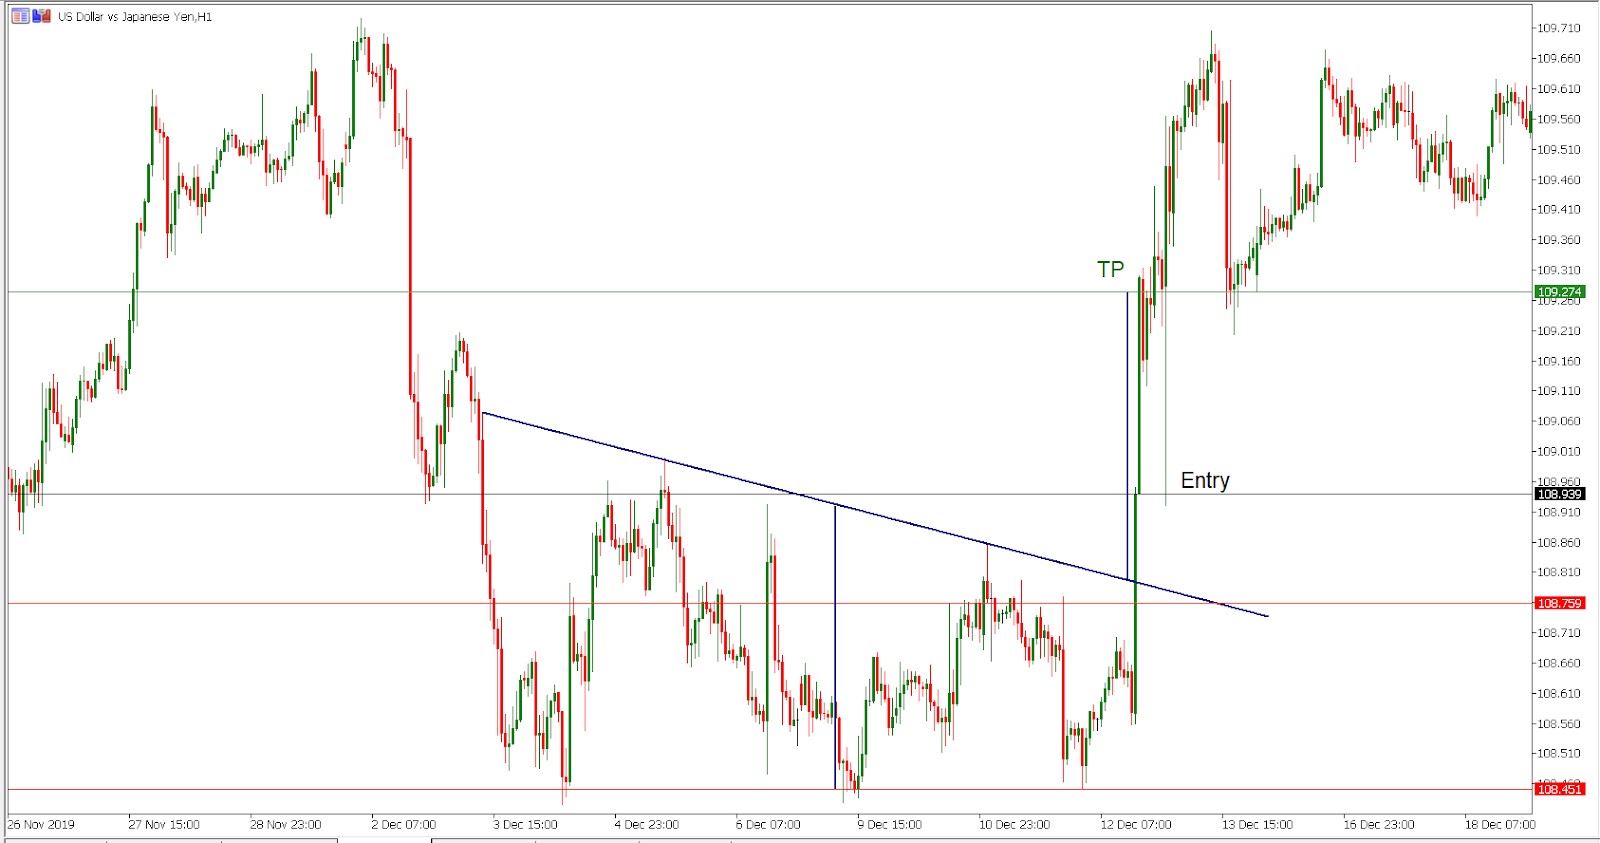
1. **Entry Points**: Triple Bottom Pattern ke breakout ke baad trading entry points identify kiye jaate hain. Traders typically pattern ke completion aur confirmation ke baad buy positions open karte hain. Entry point breakout candle ke above set kiya jata hai.
2. **Stop-Loss Aur Take-Profit**: Risk management ke liye, stop-loss orders ko pattern ke lowest trough ke neeche set kiya jata hai, taake unexpected market fluctuations se protection mil sake. Take-profit levels ko potential price targets ke hisaab se set kiya jata hai, jo pattern ki overall height ke based hote hain.
3. **Pattern Confirmation**: Triple Bottom Pattern ke signals ko additional technical indicators ke sath confirm kiya jata hai. Indicators jaise Moving Averages, RSI (Relative Strength Index), aur MACD (Moving Average Convergence Divergence) pattern ke accuracy ko enhance karte hain aur false signals se bachne mein madad karte hain.
**Market Sentiment Aur Trends**
1. **Trend Analysis**: Triple Bottom Pattern ko downtrend ke baad identify kiya jata hai aur yeh bullish reversal ka signal hota hai. Market ke overall trend aur sentiment ko analyze karna zaroori hota hai, taake pattern ki effectiveness aur trading decisions ko improve kiya ja sake.
2. **News Impact**: Economic news aur market events bhi Triple Bottom Pattern ko influence kar sakte hain. Traders ko relevant news aur events ko monitor karna chahiye jo price movements aur pattern ke formation ko impact kar sakte hain.
**Conclusion**
Triple Bottom Candlestick Pattern forex trading mein ek important bullish reversal pattern hai jo downtrend ke baad price ke upward movement ka signal deta hai. Pattern ke components, jaise three troughs aur horizontal support level, market ke potential trend reversal ko visually represent karte hain. Effective trading strategies aur proper risk management ke sath, Triple Bottom Pattern traders ko market ke trend ko accurately identify karne aur profitable trades execute karne mein madad karta hai.
-
shannySenior Member
- Jul 2024
- 2275
- 14
- 51
- 350 USD
### Triple Bottom Candlestick Pattern
Triple Bottom Candlestick Pattern aik bullish reversal pattern hai jo ke market ki downtrend ke baad hota hai. Yeh pattern tab develop hota hai jab price teen martaba ek hi level par support leti hai aur phir upward trend start hota hai. Yeh pattern investers aur traders ke liye ek ahem signal hai jo market me bullish trend ka indication deta hai.
Is pattern ki pehchan teen consecutive lows se hoti hai jo ke ek hi level par hoti hain. Yeh lows ek horizontal line banate hain, jo ke support level ko indicate karti hai. Har low ke beech me ek recovery hoti hai jo ke market ke downward pressure ko temporarily kam karti hai. Har recovery ke baad price phir se neeche aati hai aur teesra low banati hai.
Triple Bottom Pattern ki confirmation ke liye, fourth bar ka hona zaroori hai jo ke high banata hai aur jo ke pattern ke baad upward trend ko confirm karta hai. Jab price is level ko break karti hai, tab yeh bullish signal hota hai aur yeh market ke reversal ko confirm karta hai. Traders is pattern ko bullish signals ke liye use karte hain aur yeh long positions enter karne ka acha waqt hota hai.
Triple Bottom Pattern ko trade karne ke liye, traders ko yeh dekhna chahiye ke pattern ke baad volume increase ho raha hai ya nahi. Agar volume barh raha hai, toh yeh pattern ka signal zyada strong hota hai. Is pattern ke saath stop loss bhi set karna zaroori hai taake kisi bhi unexpected market move se bacha ja sake.
Yeh pattern long-term trading aur investment ke liye bhi acha hota hai kyunki is pattern ke signal ko confirm karna relatively easy hota hai aur yeh long-term trends ko identify karne me madad karta hai. Lekin, traders ko chahiye ke woh is pattern ko dusre technical indicators ke saath combine karein taake trade ki accuracy badh sake.
In summary, Triple Bottom Candlestick Pattern ek strong bullish reversal signal hai jo ke market ke downtrend ke baad hota hai. Is pattern ko identify karke aur confirm karke traders market me entry point identify kar sakte hain aur potential profit kama sakte hain.
-
Amir07Senior Member
- Aug 2024
- 1361
- 160
- 66
- 230 USD
Triple bottom candlestick pattern ek technical analysis ka tool hai jo trading aur investing mein bohot madadgar hota hai. Ye pattern typically bullish reversal signal deta hai aur market ke trend change hone ki nishani hota hai.
Is pattern ki pehchaan karna kaafi aasan hai. Jab ek asset, jaise ke stock ya commodity, ek downtrend ke baad do baar low levels par rehta hai aur phir teesri baar bhi same low level par aa jata hai, to ye triple bottom pattern banta hai. Is pattern ko samajhne ke liye humein tin distinct lows ko dekhna hota hai jo ek horizontal line ke saath align karte hain.
Pehli bottom ek significant low hoti hai, jahan se price temporarily bounce karti hai. Doosri bottom bhi isi level ke aspaas hoti hai aur market is point par dobara girti hai, lekin zyada decline nahi hota. Teesri bottom bhi pehli do bottoms ke level ke aas paas hoti hai, aur agar is level se price phir se upar ki taraf move karti hai, to ye pattern confirm hota hai.
Triple bottom pattern ka analysis karte waqt, traders is baat ko bhi dekhte hain ke volume kaise change hota hai. Jab price teen baar ek hi level par rehti hai, to volume mein bhi kuch significant changes aate hain jo pattern ke confirmation ko support karte hain. Volume ke increase hone ka matlab hota hai ke buying interest barh raha hai aur isse market mein bullish trend develop hota hai.
Is pattern ka use karte waqt, ek important point ye hai ke traders ko confirmation signals bhi dekhne chahiye. Jab price finally triple bottom ke pattern ko break karti hai aur higher levels par chalti hai, to yeh ek strong buy signal hota hai. Is waqt trading volumes bhi badhte hain jo market ke bullish nature ko confirm karte hain.
Triple bottom pattern ko use karne se pehle, traders ko market ki overall condition aur economic indicators bhi consider karne chahiye. Ye pattern zyada effective tab hota hai jab overall market sentiment bhi bullish ho. Is pattern ka potential tabhi utilize kiya ja sakta hai jab market ke trends aur signals ko sahi tareeke se analyze kiya jaye.
Is pattern ki limitations bhi hain. Har triple bottom pattern successful nahi hota aur false signals bhi mil sakte hain. Isliye, traders ko chahiye ke is pattern ko dusre technical tools aur indicators ke saath combine karein taake ek comprehensive trading strategy develop ho sake.
In summary, triple bottom candlestick pattern ek effective tool hai jo market me bullish reversals ko identify karne mein madad karta hai. Ye pattern ek downtrend ke baad market ke trend reversal ko signal karta hai aur sahi signals aur confirmation ke saath, traders ko profitable trading opportunities provide kar sakta hai.
-
Zeshan420Senior Member
- Mar 2024
- 1412
- 2
- 32
- 225 USD
InstaSpot: کسی بھی EPS اور بینک سے منافع واپس لیں، اور EPS اور cryptocurrencies کے تبادلے پر 7% تک کمائیں۔
**Bollinger Bands Kya Hai?**
Bollinger Bands ek widely used technical analysis tool hai jo market ki volatility aur price levels ko measure karne ke liye design kiya gaya hai. Yeh indicator traders ko market conditions ko analyze karne aur trading decisions ko improve karne mein madad karta hai. Yahan Bollinger Bands ke key aspects ko Roman Urdu mein explain kiya gaya hai:
### 1. **Bollinger Bands Ka Basic Concept:**
- **Definition:** Bollinger Bands ek technical indicator hain jo price volatility aur trend analysis ko measure karta hai. Yeh indicator teen components par based hota hai: ek middle band (SMA), aur do outer bands (upper aur lower).
- **Formation:** Bollinger Bands typically 20-period simple moving average (SMA) ke around calculate kiye jate hain. Upper aur lower bands standard deviations ke basis par set kiye jate hain, jo volatility ko reflect karte hain.
### 2. **Components of Bollinger Bands:**
- **Middle Band:** Yeh middle band 20-period simple moving average (SMA) hota hai. Yeh price ka average level dikhata hai aur market ka central tendency represent karta hai.
- **Upper Band:** Upper band middle band se upar ek fixed number of standard deviations (generally 2) ke distance par hota hai. Yeh band price ke upper limit ko dikhata hai.
- **Lower Band:** Lower band middle band se neeche ek fixed number of standard deviations (generally 2) ke distance par hota hai. Yeh band price ke lower limit ko dikhata hai.
### 3. **Bollinger Bands Ki Importance:**
- **Volatility Measurement:** Bollinger Bands market ki volatility ko measure karte hain. Jab bands widen hoti hain, to market mein volatility high hoti hai. Jab bands narrow hoti hain, to volatility low hoti hai.
- **Trend Analysis:** Bollinger Bands trend analysis ke liye useful hain. Price ke upper aur lower bands ko touch karne se market ke trend aur potential reversal points ka indication milta hai.
- **Overbought/Oversold Conditions:** Price ke upper band ko touch karne se overbought conditions aur lower band ko touch karne se oversold conditions ka signal milta hai, jo trading signals generate karta hai.
### 4. **Trading Strategies Using Bollinger Bands:**
- **Band Squeeze:** Jab Bollinger Bands narrow hoti hain, to yeh low volatility aur potential breakout ka signal hota hai. Traders is signal ke basis par breakout trades setup karte hain.
- **Band Breakout:** Jab price upper ya lower band ko break karti hai, to yeh strong trend continuation ya reversal signal ho sakta hai. Upper band breakout ko bullish signal aur lower band breakout ko bearish signal ke taur par dekha jata hai.
- **Band Bounce:** Jab price upper ya lower band se bounce karti hai, to yeh support aur resistance levels ko indicate karta hai. Upper band se bounce ko selling signal aur lower band se bounce ko buying signal ke taur par consider kiya jata hai.
### 5. **Confirmation Signals:**
- **Volume Analysis:** Bollinger Bands ke sath trading volume ko analyze karna zaroori hai. High volume ke sath price band breakouts ki reliability aur strength increase hoti hai.
- **Additional Indicators:** Bollinger Bands ko RSI, MACD, ya Moving Averages jese indicators ke sath combine karke trading signals ki accuracy ko confirm kiya jata hai. Yeh additional confirmation aur analysis provide karta hai.
### 6. **Limitations:**
- **False Signals:** Kabhi-kabhi Bollinger Bands false signals bhi generate kar sakte hain, especially during high market volatility. False signals ko minimize karne ke liye additional confirmation signals aur technical analysis zaroori hai.
- **Lagging Indicator:** Bollinger Bands ek lagging indicator hain jo past price data ke basis par calculate kiye jate hain. Yeh signals market movements ko thoda late reflect karte hain.
### 7. **Best Practices:**
- **Combine with Other Tools:** Bollinger Bands ko other technical tools aur indicators ke sath combine karke trading decisions ko enhance karna chahiye. Yeh comprehensive analysis provide karta hai aur accuracy improve karta hai.
- **Practice and Experience:** Bollinger Bands ke accurate interpretation aur effective use ke liye practice aur experience zaroori hai. Market trends aur price action ko closely monitor karna chahiye.
### Conclusion:
Bollinger Bands Forex trading mein ek essential technical indicator hain jo market ki volatility aur price levels ko measure karte hain. Accurate interpretation aur additional confirmation signals ke sath, is indicator ko effective trading strategies mein integrate kiya ja sakta hai aur market movements se fayda uthaya ja sakta hai.
-
<a href="https://www.instaforex.org/ru/?x=ruforum">InstaForex</a> -
Sadd5Senior Member
- Feb 2024
- 713
- 1
- 17
- 159 USD
Triple bottom candlestick pattern
Triple Bottom candlestick pattern ek technical analysis pattern hai jo aksar stock market, Forex, ya kisi aur financial market mein dekha jata hai. Yeh pattern market ke trend mein reversal ko indicate karta hai, yani yeh batata hai ke market jo neeche ja raha tha, ab wapas upar jaane wala hai.
**Triple Bottom Pattern ke Khas Points:**
1. **Formation:** Triple Bottom pattern tab banta hai jab price chart par teen baar neeche jaakar ek specific level se wapas upar aaye. Yeh level support level kehlata hai. Is pattern mein, price teen dafa neeche jati hai, lekin har dafa usi level se bounce back karti hai, jo yeh signal deta hai ke market mein downside momentum khatam ho raha hai.
2. **Candlestick Structure:** Is pattern mein har bottom ek candlestick ke through dikhaya jata hai. Pehli bottom ke baad price thoda upar jati hai lekin phir wapas neeche aa kar doosri bottom banati hai. Yeh cycle teesri dafa bhi repeat hoti hai, lekin teesri bottom ke baad price ka trend upar ki taraf shift ho jata hai.
3. **Volume Analysis:** Volume ka bhi Triple Bottom pattern mein bohot ahmiyat hoti hai. Jab price teesri bottom banati hai aur phir upar jati hai, toh volume mein izafa hota hai, jo is baat ka indication hota hai ke buying pressure badh raha hai aur market mein trend reversal ka strong chance hai.
4. **Confirmation:** Triple Bottom pattern tab confirm hota hai jab price teesri bottom ke baad previous resistance level ko break kar ke upar close hoti hai. Is point par, yeh samjha jata hai ke market ab bullish ho gaya hai aur upar jaane ke chances zyada hain.
5. **Trading Strategy:** Triple Bottom pattern ke baad traders aksar buy positions open karte hain, kyun ke yeh pattern strong bullish reversal ka signal hota hai. Traders is pattern ke break out point par entry karte hain aur stop-loss order us support level ke neeche place karte hain jo is pattern ke doran bana tha.
6. **Time Frame:** Yeh pattern kisi bhi time frame mein ban sakta hai, lekin iski significance time frame par depend karti hai. Longer time frames par banne wala Triple Bottom pattern zyada reliable aur strong reversal signal provide karta hai.
**Ahmiyat:**
Triple Bottom pattern trading aur investment decisions ke liye ek powerful tool hai, lekin iska analysis hamesha doosre indicators aur market conditions ke sath karna chahiye. Yeh pattern market mein trend reversal ka strong signal hota hai, isliye agar yeh pattern form hota hai, toh traders isko dekh kar apni strategies ko accordingly adjust karte hain.
Is pattern ka correct interpretation aur timing traders ke liye bohot faidemand ho sakti hai, lekin market ke unpredictable nature ko dekhte hue, risk management strategies hamesha dhyan mein rakhni chahiye.
اب آن لائن
Working...
تبصرہ
Расширенный режим Обычный режим