Breakout Types in Forex Trading.
-
SnoSenior Member

- Sep 2020
- 1861
- 16
- 265
- 538 USD
-
<a href="https://www.instaforex.org/ru/?x=ruforum">InstaForex</a> -
Realome98Senior Member
- May 2024
- 355
- 1
- 7
- 45 USD
Assalamu Alaikum Dosto!
Breakout
Trading mein aksar ek breakout tab hota hai, jab kisi peechle level ya zone of resistance ko uboor (cross) karte hue ooncha chala jata hai ya kisi peechle level ya zone of support ko uboor (cross) karte hue niche ja raha hota hai. Aik breakout aam tor par ek tradable instrument ke liye supply aur demand mein kisi naye tabdeeli ko darust karta hai aur yeh bhi keh sakta hai ke kisi naye trend ka shuru ho raha hai. Ye wohi cheez hai jo traders ke liye breakouts ko intehai ahem signals banati hai.
"Peechle trend ki taraf ek breakout woh confirm karta hai ke yeh trend ab bhi qaim hai, jabke peechle trend ki taraf ek breakout yeh darust karta hai ke yeh trend mukhtalif ho raha hai aur ek trader ko apni position band karna chahiye (aur shayad usko ulta karna chahiye).
Aam tor par kisi action ki tezi aur yakeen ke darmiyan aik trade-off hona chahiye. Action ki tezi ahem hai jab market price kisi khaas level ko (support ya resistance) paar karta hai, jabke yakeen ki zaroorat hoti hai taake yeh yaqeeni ho ke breakout haqeeqi hai, kyun ke jhootay breakouts aam tor par dekhe jate hain.
Breakout Confirmation
Breakout ke liye pehli sorat ek peechle trend line ya support (resistance) zone ke paar ka hai, jabke doosri sorat yeh hai ke yeh paar karna asal breakout hai aur yeh koi fakeout nahi hai.
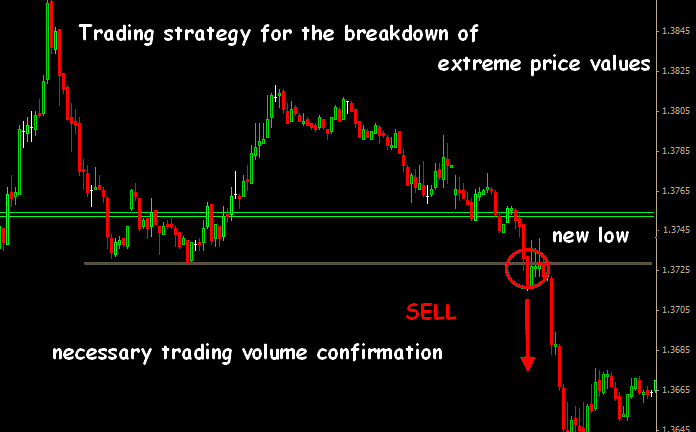
Jab humare paas aik support ya resistance zone hoti hai, toh saaf breakout level ka taayun mushkil hota hai. Is maamlay mein, mukhtalif zone ka intehai level aam tor par breakout level ke tor par shamil hota hai. Ye aksar dekha jata hai jab prices range mein trade karte hain (sideways trend), jahan support zone (peechle support levels ko dikhane wali horizontal lines ki ek series) wide hoti hai. Ek trading range mein lowest support line aam tor par breakout level ke tor par liya jata hai. Prices aksar momentum kho deti hain, jab woh support zone mein enter karte hain, aur puri tarah se isse paar nahi karte. Lekin phir bhi, lowest support level ka break yeh darust karta hai ke pura support zone compromised ho chuka hai. Ye neeche di gayi graph par dekha ja sakta hai.
Aik trend line zyada specific breakout level ke tor par kaam karta hai, kyun ke yeh bas ek line hai. Lekin breakout level ya trend line ka penetration confirm kiya jana zaroori hai.
Kuch traders candle ka close ka intezaar karenge jahan breakout hua hai, jabke doosre ek se zyada candles ka intezaar karenge (resistance ya support level ke upar ya neeche).
Teesre qism ke traders ek mukhtalif number of pips ka intezaar karenge jahan breakout hota hai, Average True Range (ATR), ek indicator, jo hum baad mein discuss karenge, ka istemal karke.
Ek aur confirmatory method yeh hai ke breakout level ke ek mukhtalif percentage ka ek breakout zone banaya jaye. Agar price breakout level aur uske beyond establish zone ko penetrate karti hai, toh penetration haqeeqatan real hogi. Koi bhi percent signal ke taur par istemal kiya ja sakta hai, lekin sab se aam taur par istemal hone wala hai woh so called 3% rule, aik level jo 3% breakout point se khara hota hai (jo ke stock market practice se mutaliq hai).
Volume ke tor Par Confirmatory
Volume bhi istemal kiya ja sakta hai taake yeh confirm kiya jaye ke breakout haqeeqi hai ya nahi. Barhtee hui trading volume aksar ek breakout ke saath ho sakti hai. Zyada volume yeh darust karta hai ke traders naye trend ki taraf amal kar rahe hain aur penetration ke peechay power hai. Yeh isliye hota hai kyun ke barhtee hue prices aur barhtee hue volume ek sehatmand uptrend ke achhe signals hote hain, jabke girti hui prices aur barhtee hue volume ek sehatmand downtrend ke achhe signals hote hain.
In tamam methods, jo humne upar zikar kiye hain, mein aik ahem nuqsan hai - unhone price volatility ka hisaab nahi liya hai. Teen zyadatar istemal hone wale maadah hain, jin se volatility ka andaza lagaya jata hai - beta, aik price ka standard deviation aur Average True Range.
Beta ek market benchmark, aam tor par S&P 500 index, ke muqablay mein aik price ka standard deviation ka hisaab hota hai. Betas ka istemal saaloon ke doran kam hota gaya hai, kyun ke is assumption ko ke is a valid measure of risk, sawal kiya gaya hai. Lekin iska kuch faida bhi hai, kyun ke yeh volatility ka hisaab karte waqt market trend ko khatam kar deta hai.
Price ka standard deviation ek peechle waqt ke kuch time period ke doran aik series of prices ko shamil karta hai. Is ki evaluation mein waqt ke sath yeh bhi kam asar aata gaya hai, kyun ke yeh apni tawil evaluation mein market trend ko shamil karta hai.
Average True Range (ATR) Average Range se mutaliq hai, jo aik maqbul period ke doran har bar ke high aur low ke darmiyan farq ka average darust karta hai. ATR ek True Range bars ke close ka average hai. True Range mein se zyada hai:
- Musalsal bar ka high aur low ke darmiyan farq
- Musalsal bar ka close aur peechle bar ka high ke darmiyan farq ka absolute value
- Musalsal bar ka close aur peechle bar ka low ke darmiyan farq ka absolute value
ATR kuch waqt ke doran True Range ka average hai. Aik breakout ko confirm karne ke liye ek multiple of ATR ka istemal karte hue, breakout level volatility ke mutabiq adjust kiya jata hai. ATR filter waqt ke sath expand aur contract ho sakta hai, keemat ke volatility ke tabdeeli ke mutabiq. Agar prices ka volatility barh jata hai, toh daily True Ranges expand hote hain aur ATR zyada hota hai. Iska matlab hai ke increased price volatility ki wajah se fakeout hone ki kam chance hoti hai.
Aksar ek trader volume ko aik nishaan samajh sakta hai ke ek breakout hone wala hai, kyun ke volume khud trend ke saath tightly related hota hai. Agar trading volume ek trend ke saath barh rahi hai, toh yeh trend ko support karne wale nazar aata hai. Jab prices resistance zone ke neeche fluctuate kar rahe hote hain, for instance, aur trading volume har chhoti up leg par barhta hai aur har chhoti down leg par girta hai, toh yeh koi chance hai ke price resistance zone ke through break kar sakta hai.
Prices apni aglay directional move ko bhi zahir kar sakti hain. Jab humare paas aik trading range hoti hai, toh prices agar neeche ki taraf palatne lagte hain aur trading range ke lower boundary se thodi upar aur phir resistance zone ke zone mein neeche palatne lagte hain, toh yeh darust kar sakta hai ke long position holders har chhoti correction ke saath thoda zyada aggressive ho rahe hain. Agar thodi si barhne wali lows ke tendency barhti hai aur har rally par volume barhta hai, toh resistance zone ke breakout ke chances bhad jaate hain.
Breakout Types
Breakout types ka mukhtalif asbaab hain aur har aik asbaab ke saath alag tarah ke breakouts hotay hain. Breakout types ko samajhna traders ke liye zaroori hai taake woh market movement ko behtar taur par samajh sake aur trading decisions sahi tareeqay se le sakein.- Continuation Breakout: Continuation breakout hota hai jab ek trend ke direction mein ek breakout hota hai, jo ke us trend ko jari rakhta hai. Masalan, agar ek uptrend mein price ek resistance level ko paar karta hai aur upar jaata hai, toh yeh ek continuation breakout ho sakta hai. Is mein yeh samjha jata hai ke uptrend ab bhi qaim hai aur price ko mazeed upar jaane ka moka mil sakta hai. Traders aksar is tarah ke breakouts ka istemal karke existing trend mein trading karte hain.
- Reversal Breakout: Reversal breakout ek trend ko ulta karne wala breakout hota hai. Jab price ek support level ko neeche paar karta hai aur nichay jaata hai ya ek resistance level ko upar paar karta hai aur upar jaata hai, toh yeh ek reversal breakout kehlayega. Yeh ishara deta hai ke trend badal gaya hai aur naya trend shuru ho sakta hai. Traders is tarah ke breakouts ka istemal karke trend ki mukhtalif phases mein trading karte hain.
- Range Breakout: Range breakout hota hai jab price ek trading range se bahar jaata hai. Trading range ek area hoti hai jahan price ek muddat ke liye consolidate hoti hai. Jab price is range ke bahar jaata hai, toh yeh ek range breakout hota hai. Is mein yeh samjha jata hai ke market mein ek naye trend ka aghaz ho sakta hai ya phir existing trend mein tezi aayegi. Traders is tarah ke breakouts ko dekhte hain taake unhein trend ki direction ka pata chal sake.
- False Breakout: False breakout hota hai jab price ek support ya resistance level ko paar karta hai, lekin phir wapas us level ke andar aa jata hai. Yeh darust breakout nahi hota hai, balkay sirf temporary movement hota hai jo ke traders ko confuse kar deta hai. False breakouts ko identify karna zaroori hai taake traders ghalat signals par trade na karein.
- Volatility Breakout: Volatility breakout hota hai jab price ek sudden aur tezi se move karta hai. Yeh breakout aksar market mein tezi ya ghareebi ke waqt hota hai aur aam tor par kisi important news ya event ke baad dekha jata hai. Volatility breakout ke doran, price mein tezi se movement hoti hai aur traders ko mazeed potential trading opportunities mil sakti hain.
- Candlestick Pattern Breakout: Candlestick pattern breakout hota hai jab price ek specific candlestick pattern ke sath ek support ya resistance level ko paar karta hai. Masalan, ek bullish engulfing candlestick pattern ke baad agar price ek resistance level ko paar karta hai, toh yeh ek bullish breakout kehlayega. Candlestick patterns ko samajhna traders ke liye zaroori hai taake woh market ke potential movements ko samajh sakein.
In mukhtalif types ke breakouts ko samajhna traders ke liye zaroori hai taake woh market ke movements ko sahi tareeqay se analyze kar sakein aur trading strategies ko improve kar sakein. Har ek breakout type ke saath alag trading approach hoti hai, aur traders ko in sabhi factors ko madde nazar rakhte hue apne trading plans ko tayyar karna chahiye.
Breakout Trading Strategies
Breakout trading strategies ka istemal traders ke liye aik ahem tareeqa hai market movements ko samajhne aur trading decisions banane ke liye. Breakout trading strategies ka maqsad hota hai market ke important levels, jaise ke support aur resistance, ke paar hone par entry points dhoondhna aur un movements ka faida uthana jo ke ek naye trend ka aghaz kar sakte hain.- Basic Breakout Strategy:
Yeh ek simple strategy hai jisme traders ek specific level ke paar hone par trade karte hain. Masalan, agar price ek resistance level ko paar karke upar jaati hai, toh trader long position le sakta hai. Is tarah ke breakout strategy mein, stop loss aur profit target ko define karna zaroori hota hai taake trader apni positions ko manage kar sake. - Pullback Breakout Strategy:
Pullback breakout strategy mein, traders ek breakout ke baad price ka ek minor retracement ya pullback ka intezaar karte hain, phir woh retracement ke baad entry karte hain. Masalan, agar price ek resistance level ko paar karke upar jaati hai, toh traders ek chhote se retracement ka intezaar karte hain aur phir us retracement ke baad long position lete hain. - Reversal Breakout Strategy:
Reversal breakout strategy mein, traders ek trend ke ulte hone par entry karte hain. Masalan, agar price ek support level ko neeche paar karke nichay jaati hai aur phir wapas upar jaati hai, toh yeh ek reversal breakout ho sakta hai. Traders is tarah ke breakouts ko dekhte hain taake naye trends ko pehchaan sakein. - Volatility Breakout Strategy:
Volatility breakout strategy mein, traders ek sudden aur tezi se movement ke baad entry karte hain. Masalan, agar price ek range ke bahar tezi se move karta hai, toh traders is volatility breakout par trade karte hain. Is strategy mein, stop loss aur profit target ko define karna bhi zaroori hota hai taake trader apni positions ko manage kar sake. - Candlestick Pattern Breakout Strategy:
Candlestick pattern breakout strategy mein, traders ek specific candlestick pattern ke sath ek important level ke paar hone par entry karte hain. Masalan, agar ek bullish engulfing candlestick pattern ke baad price ek resistance level ko paar karta hai, toh yeh ek bullish breakout ho sakta hai aur traders is signal par trade karte hain.
Har ek breakout trading strategy apni khasiyat aur tareeqa-e-amal rakhti hai. Traders ko market ke conditions aur apne risk tolerance ke mutabiq sahi strategy ka intikhab karna chahiye. Iske ilawa, stop loss aur profit target ko define karna bhi zaroori hai taake trader apni positions ko manage kar sakein. Breakout trading strategies ke istemal se traders ko market ke movements ka behtar andaza hota hai aur unhein trading opportunities mil sakti hain. Lekin, jaise har trading strategy ki tarah, breakout trading strategies bhi apni limitations aur risks ke saath aati hain, isliye traders ko cautious rehna chahiye aur apni analysis ko mazbooti se karna chahiye.
-
AttachohanMember
- Sep 2023
- 79
- 1
- 16 USD
InstaSpot: کسی بھی EPS اور بینک سے منافع واپس لیں، اور EPS اور cryptocurrencies کے تبادلے پر 7% تک کمائیں۔
Forex Trading Mein Breakout[][][]
Forex trading mein, "breakout" ek aisa event hota hai jab price ek specific range, level, ya pattern ko cross kar jati hai jo traders ko signal deti hai ke market mein ek naya trend shuru hone wala hai. Breakouts ka istimaal aksar trading strategies mein hota hai kyun ke ye significant price movements ka indication deti hain.\\
Forex Trading Mein Breakout Ki Types[][][]
Yahan kuch common types of breakouts discuss kiye gaye hain:
1. Horizontal Breakouts:- Support Breakout: Jab price ek established support level ko neeche cross kar leti hai, toh ye support breakout kehlata hai. Iska matlab ye hota hai ke market mein bearish sentiment hai.
- Resistance Breakout: Jab price ek established resistance level ko upar cross kar leti hai, toh ye resistance breakout kehlata hai. Iska matlab ye hota hai ke market mein bullish sentiment hai.
- Uptrend Line Breakout: Jab price ek ascending trendline ko neeche cross kar leti hai, toh ye uptrend line breakout kehlata hai. Iska matlab ye hota hai ke uptrend khatam ho sakta hai aur market mein bearish trend shuru ho sakta hai.
- Downtrend Line Breakout: Jab price ek descending trendline ko upar cross kar leti hai, toh ye downtrend line breakout kehlata hai. Iska matlab ye hota hai ke downtrend khatam ho sakta hai aur market mein bullish trend shuru ho sakta hai.
- Triangles:
- Ascending Triangle Breakout: Is pattern mein, price ek horizontal resistance aur rising support line ke beech mein move karti hai. Jab price resistance line ko cross kar leti hai, toh ascending triangle breakout kehlata hai.
- Descending Triangle Breakout: Is pattern mein, price ek horizontal support aur falling resistance line ke beech mein move karti hai. Jab price support line ko cross kar leti hai, toh descending triangle breakout kehlata hai.
- Symmetrical Triangle Breakout: Is pattern mein, price ek narrowing range mein move karti hai. Jab price either upper ya lower trendline ko cross karti hai, toh symmetrical triangle breakout kehlata hai.
- Head and Shoulders:
- Head and Shoulders Top Breakout: Is pattern mein, price ek reversal pattern banati hai. Jab price neckline ko neeche cross kar leti hai, toh ye bearish breakout kehlata hai.
- Inverse Head and Shoulders Breakout: Is pattern mein, price ek reversal pattern banati hai. Jab price neckline ko upar cross kar leti hai, toh ye bullish breakout kehlata hai.
- Rectangles:
- Rectangle Top Breakout: Is pattern mein, price ek horizontal range mein move karti hai. Jab price upper resistance line ko cross kar leti hai, toh ye bullish breakout kehlata hai.
- Rectangle Bottom Breakout: Is pattern mein, price ek horizontal range mein move karti hai. Jab price lower support line ko cross kar leti hai, toh ye bearish breakout kehlata hai.
- Bollinger Bands Breakout: Bollinger Bands ek volatility indicator hain. Jab price upper band ko cross kar leti hai, toh bullish breakout signal hota hai. Aur jab price lower band ko cross kar leti hai, toh bearish breakout signal hota hai.
- Breakaway Gap: Ye gap tab hota hai jab price ek consolidation phase se breakout karti hai aur ek naya trend shuru hota hai.
- Runaway Gap: Ye gap existing trend ke continuation ko indicate karta hai aur beech mein aata hai trend ke continuation ke waqt.
- Exhaustion Gap: Ye gap trend ke end hone ka indication deta hai aur aksar price reversal ke qareeb hota hai.
-
Fiza12Senior Member
- Dec 2023
- 381
- 28
- 143 USD
**Support and Resistance Breakouts**Yeh breakout tab hota hai jab price ek specific support ya resistance level ko torh deti hai. Support level woh level hota hai jahan price neeche girne se rok jati hai, aur resistance level woh hota hai jahan price upar jane se rok jati hai. Jab price support ko torh kar neeche jati hai to yeh bearish breakout hota hai aur jab resistance ko torh kar upar jati hai to yeh bullish breakout hota hai.
2. **Trendline Breakouts**
Trendline breakouts tab hote hain jab price ek trendline ko cross karti hai. Trendline wo lines hoti hain jo price ki direction ko represent karti hain, chahay woh uptrend ho ya downtrend. Agar price ek uptrend line ko torh kar neeche jati hai to yeh bearish breakout hota hai, aur agar ek downtrend line ko torh kar upar jati hai to yeh bullish breakout hota hai.
3. **Chart Pattern Breakouts**
Chart patterns, jaise ke head and shoulders, triangles, aur flags, breakout opportunities provide karte hain. Jab price in patterns ko complete karne ke baad unse bahar nikalti hai, toh yeh ek breakout mana jata hai. Misal ke taur par, agar price ek triangle pattern ko torh kar bahar nikalti hai to yeh breakout ka sign hota hai.
4. **Volatility Breakouts**
Volatility breakouts tab hote hain jab price range se bahar nikalti hai jahan pehle woh confined thi. Yeh usually high-impact news ya economic events ke baad dekhe jaate hain. High volatility breakouts mein price sharp movements karti hai jo trading opportunities create karte hain.
5. **False Breakouts**
False breakouts wo hotay hain jab price temporarily support ya resistance level ko torh kar wapas range mein aa jati hai. Yeh traders ke liye misleading ho sakte hain aur usually stop losses ko hit karte hain. Isliye yeh zaroori hai ke proper confirmation ka intezar kiya jaye before taking a trade.
Breakout Trading Tips:
1. **Confirmation ka intezar karen:** Hamesha breakout ka confirmation ka intezar karen. Volume analysis aur candlestick patterns confirmation provide kar sakte hain.
2. **Stop Loss Lagayen:** Proper stop loss lagana zaroori hai taake false breakouts se bach sakain.
3. **Risk Management:** Apne risk ko manage karen aur hamesha apne capital ka chhota hissa risk mein dalen.
Forex trading mein breakouts ko samajhna aur inhe effectively trade karna aapki trading performance ko behtar bana sakta hai. Har type ka breakout different strategies aur confirmations demand karta hai, isliye inhe dhyan se study karna zaroori hai. -
SwordSenior Member
- Dec 2023
- 731
- 218
- 217
- 176 USD
Forex Main "Breakout Types in Forex Trading"
Forex trading main breakout ek important concept hai jo market ki volatility aur price movements ko samajhne main madad karta hai. Breakout tab hota hai jab price aik defined support ya resistance level ko cross karti hai. Yeh market main nayi trends aur significant price movements ko indicate karta hai.
Breakout Kya Hai?
Breakout se murad price movement hai jo ek specific level ko cross karti hai, jese support, resistance, trend line, ya chart pattern. Breakouts traders ke liye significant hote hain kyunki yeh nayi trends aur major price movements ko indicate karte hain. Breakouts ko samajhne aur unpe action lena trading strategies ka aik crucial part hai.
Types of Breakouts
Forex trading main breakouts ko kuch major categories main divide kiya ja sakta hai
Support and Resistance Breakouts
Trend Line Breakouts
Chart Pattern Breakouts
Volatility Breakouts
In categories ko detail main samajhte hain
Support and Resistance Breakouts
Support aur resistance levels wo points hote hain jahan price repeatedly reverse hoti hai. Jab price in levels ko cross karti hai to breakout hota hai.
Support Breakout
Support level wo level hota hai jahan price neeche jaane se pehle ruk jati hai aur rebound karti hai. Jab price support level ko break karti hai aur neeche close hoti hai, to yeh support breakout hota hai aur yeh bearish signal hota hai.
Resistance Breakout
Resistance level wo level hota hai jahan price upar jaane se pehle ruk jati hai aur reverse hoti hai. Jab price resistance level ko break karti hai aur upar close hoti hai, to yeh resistance breakout hota hai aur yeh bullish signal hota hai.
Trend Line Breakouts
Trend lines wo lines hain jo price ke highs ya lows ko connect karti hain aur trend direction ko indicate karti hain. Trend line breakout tab hota hai jab price trend line ko cross karti hai.
Uptrend Line Breakout
Uptrend line wo line hoti hai jo higher lows ko connect karti hai. Jab price is line ko neeche break karti hai, to yeh downtrend ka signal hota hai.
Downtrend Line Breakout
Downtrend line wo line hoti hai jo lower highs ko connect karti hai. Jab price is line ko upar break karti hai, to yeh uptrend ka signal hota hai.
Chart Pattern Breakouts
Chart patterns market behavior aur price movements ko visualize karte hain. In patterns se significant breakouts ho sakte hain jo new trends ko initiate karte hain.
Triangle Breakout
Triangle patterns ascending, descending, aur symmetrical ho sakte hain. Jab price in patterns ko break karti hai, to nayi trend ka signal hota hai.
Head and Shoulders Breakout
Head and Shoulders pattern trend reversal ka indication hota hai. Jab price neckline ko break karti hai, to significant trend change hota hai.
Double Top and Double Bottom Breakout
Double top bearish reversal aur double bottom bullish reversal ko indicate karta hai. Jab price in patterns ko break karti hai, to strong trend reversal hota hai.
Volatility Breakouts
Volatility breakout tab hota hai jab price range-bound condition se nikal kar significant movement show karti hai. Volatility breakout ko measure karne ke liye different indicators use kiye jate hain.
Bollinger Bands Breakout
Bollinger Bands price ki volatility ko measure karti hain. Jab price upper ya lower band ko break karti hai, to volatility breakout hota hai.
ATR (Average True Range) Breakout
ATR volatility ko measure karta hai. Jab ATR value increase hoti hai, to high volatility ko indicate karta hai aur price breakout expected hota hai.
Importance of Breakouts in Forex Trading
Breakouts forex trading main bohat significant hote hain kyunki
Trend Identification
Breakouts nayi trends ko initiate karte hain. Support aur resistance breakouts traders ko market direction ko identify karne main madad karte hain.
Entry and Exit Points
Breakouts effective entry aur exit points provide karte hain. Jab price breakout hoti hai, to traders ko buy ya sell signal milta hai jo unki trading decisions ko enhance karta hai.
Risk Management
Breakouts ko use karke traders apne risk ko manage kar sakte hain. Stop-loss aur take-profit levels ko breakouts ke sath align karke risk management improve hota hai.
Volatility Exploitation
Volatility breakouts traders ko significant price movements ko exploit karne ka mauka dete hain. High volatility periods main trading opportunities zyada hoti hain.
Practical Examples of Breakouts
Kuch practical examples dekhte hain taake breakouts ko better samajh sakein
Support Breakout
Agar EUR/USD pair 1.1000 support level pe trade kar rahi hai aur price is level ko break karke 1.0950 pe close hoti hai, to yeh support breakout hoga. Is point pe, traders short positions enter kar sakte hain kyunki downtrend expected hai.
Triangle Pattern Breakout
Agar GBP/USD pair ascending triangle pattern form kar rahi hai aur price upper trend line ko break karke upar move karti hai, to yeh bullish breakout hoga. Is situation main, traders buy positions enter kar sakte hain.
Combining Breakouts with Other Indicators
Breakouts ko doosre technical indicators ke sath combine karke use karna zyada effective hota hai
Moving Averages
Moving averages ke sath breakout signals ko confirm karna asaan hota hai. Agar breakout moving average crossover ke sath ho, to strong trend confirmation milta hai.
RSI (Relative Strength Index)
RSI ko use karke overbought aur oversold conditions ko check kar sakte hain aur breakout signals ko validate kar sakte hain.
MACD (Moving Average Convergence Divergence)
MACD ke sath breakout signals ko confirm karke trend strength aur momentum ko check kar sakte hain.
Note
Breakouts forex trading main ek crucial concept hain jo traders ko significant price movements aur nayi trends ko identify karne main madad karte hain. Breakouts ko samajhne aur effectively use karne se traders apni trading strategies ko enhance kar sakte hain aur better trading decisions le sakte hain. Hamesha yaad rakhen ke breakouts ko doosre technical indicators ke sath combine karke use karna zyada accurate aur reliable trading signals provide karta hai. -
DilawarbbasMember
- Apr 2024
- 50
- 2
- 11 USD
InstaSpot: کسی بھی EPS اور بینک سے منافع واپس لیں، اور EPS اور cryptocurrencies کے تبادلے پر 7% تک کمائیں۔
Breakout Types in Forex Trading
Forex trading mein breakout ek important concept hai jismein price ek specific level ya range ko cross karta hai, indicating a potential shift in market momentum aur trend continuation ya reversal. Yahan kuch key types of breakouts hain jo Forex trading mein dekhe jaate hain:
Support aur Resistance Breakouts
Support aur resistance levels market mein key areas hote hain jahan price ke movements slow down ya reverse ho sakte hain. Support level ek price point hota hai jahan se price ka downward movement rokta hai aur reverse ho sakta hai, jabke resistance level ek price point hota hai jahan se price ka upward movement rokta hai aur reverse ho sakta hai. Jab price support ya resistance level ko breakout karta hai, to yeh potential trend reversal ya trend continuation ko indicate karta hai.
Chart Pattern Breakouts
Chart patterns, jaise ki triangles, flags, aur head and shoulders patterns, breakout points provide karte hain jahan price ke movements pattern ke boundaries ko cross karta hai. Agar price pattern ke boundaries ko breakout karta hai, to yeh potential trend continuation ya reversal ko indicate karta hai, aur traders ko trading opportunities provide karta hai.
Volatility Breakouts
Volatility breakout strategy mein traders high volatility periods par focus karte hain jahan price sudden moves karta hai. Ismein traders breakout ke direction mein trades enter karte hain, expecting ki volatility ke spike se price ek strong trend direction mein move karega.
Range Breakouts
Range-bound markets mein price ek specific range ke andar consolidate hota hai. Range breakout traders unko target karte hain jab price range ke boundaries ko breakout karta hai. Jab price range ke boundaries ko breakout karta hai, to yeh potential trend ka start ho sakta hai aur traders ko trading opportunities provide karta hai.
News Breakouts
News events aur economic releases ke time par price sudden moves karta hai, creating breakout opportunities. Traders news breakout strategy mein specific news events ke release ke time par trading karte hain, expecting ki price ek specific direction mein breakout karega.
Har breakout type apne unique characteristics aur trading strategies ke saath aata hai. Traders ko breakout patterns ko identify karne aur unke implications ko samajhne ke liye thorough technical analysis aur market understanding ki zaroorat hoti hai. Iske alawa, proper risk management techniques ka istemal karke traders apne breakout trades ko manage karte hain.
-
Rizwan786@Senior Member
- Apr 2023
- 313
- 9
- 24
- 75 USD
Breakout Types Forex Trading information?
Introduction
Continuation Breakouts
Reversal Breakouts
False Breakouts
Trading Strategies
Risk Management
Dosto ab in points ki tafseelat mein baat karte hain
Introduction
Dosto breakout trading forex market mein ek popular strategy hai jisme price important support ya resistance level ko break karti hai Ye strategy market momentum ko capture karne ka ek effective tareeqa hai Breakouts ko samajhna aur inka sahi tarike se trade karna trading success ke liye bahut zaroori hai
Continuation Breakouts
Dosto continuation breakouts tab hote hain jab price ek consolidation phase ke baad trend continuation karti hai
Trendlines Aur Channel Patterns Trendlines aur channel patterns ke break hone par continuation breakouts form hote hain
Flag Aur Pennant Patterns Flag aur pennant patterns ke baad price trend continue karti hai
Volume Increase Continuation breakouts ke sath volume increase hoti hai jo trend continuation ko confirm karti hai
Reversal Breakouts
Dosto reversal breakouts tab hote hain jab price ek trend ko reverse karti hai aur opposite direction mein move karti hai
Head And Shoulders Pattern Head and shoulders pattern ek common reversal pattern hai jisme neckline break hone par trend reverse hota hai
Double Top Aur Double Bottom Patterns Double top aur double bottom patterns bhi reversal breakouts ko indicate karte hain jab price significant support ya resistance level ko break karti hai
Divergence Indicators Divergence indicators jaise ke MACD aur RSI reversal breakouts ko confirm karne mein madad karte hain
False Breakouts
Dosto false breakouts tab hote hain jab price temporarily support ya resistance level ko break karti hai lekin trend continue nahi hota
Traders Ke Liye Trap False breakouts traders ke liye traps create kar sakte hain jisme price wapas range mein move kar jati hai
Volume Confirmation False breakouts ke time volume usually low hota hai jo breakout ki validity ko question karta hai
Waiting For Confirmation False breakouts se bachne ke liye breakout ke baad price action aur volume ka confirmation zaroori hai
Trading Strategies
Dosto breakout trading ke liye kuch common strategies hain
Entry Points Breakout confirmation ke baad entry lena zaroori hai Jab price significant level ko break karne ke baad sustain karti hai tab entry karein
Stop Loss Breakout point ke thoda neeche ya upar stop loss place karein taki risk control mein rahe
Take Profit Predefined targets ya trailing stops ka use karein taki profits ko maximize kiya ja sake
Risk Management
Dosto trading mein risk management bahut zaroori hai Breakout trading mein bhi kuch cheezon ka dhyan rakhna chahiye
Position Sizing Har trade ke liye proper position sizing follow karni chahiye taki risk control mein rahe
Avoid Overleveraging Leverage ka sahi istemal karna chahiye taki unnecessary risks avoid ho sakein
Regular Monitoring Apni trades ko regularly monitor karein aur market conditions ke hisaab se adjustments karein agar zaroori ho
Ye the kuch main points aur unki explanation breakout types forex trading ke hawale se Agar aapka koi sawaal ho ya aur details chahiye ho to zaroor batayein -
Ikram5Senior Member
- Nov 2023
- 692
- 90
- 1101
- 368 USD
Breakout Types in Forex Trading.
Forex trading mein breakout ek ahem aur mashhoor strategy hai jo tajiron ko moqa deti hai ke wo price ke naye trends ko pehchane aur un se faida uthayein. Breakout trading se murad hai ke jab price aik muqarrar level ko tor k naya high ya low banata hai, to trader is ko ek signal ke tor par use karta hai taake naya trend join kar sake. Forex trading mein mukhtalif qisam ke breakouts hotay hain jo tajiron ke liye intehai mufeed ho saktay hain.
Types of Breakouts
1. Support and Resistance Breakouts
Support aur resistance levels woh levels hain jahan price bar bar aake rukti hai ya bounce karti hai. Support level woh level hota hai jahan price neechay ja kar rukti hai, jabke resistance woh level hota hai jahan price upar ja kar rukti hai. Jab price in levels ko tor kar nikalti hai, to ye breakout kehlata hai.- Support Breakout: Jab price support level ko tor kar neechay girti hai, to ye support breakout kehlata hai. Ye signal deta hai ke price ab neechey ki taraf zyada gir sakti hai.
- Resistance Breakout: Jab price resistance level ko tor kar upar jati hai, to ye resistance breakout kehlata hai. Ye signal deta hai ke price ab upar ki taraf zyada barh sakti hai.
Trendlines woh lines hoti hain jo price ke highs ya lows ko connect karti hain. Inko use karke traders current trend ka pata lagate hain. Jab price in trendlines ko tor kar nayi direction mein move karti hai, to ye trendline breakout kehlata hai.- Uptrend Line Breakout: Jab price uptrend line ko tor kar neechey ki taraf move karti hai, to ye signal hota hai ke shayad trend reverse hone wala hai.
- Downtrend Line Breakout: Jab price downtrend line ko tor kar upar ki taraf move karti hai, to ye signal hota hai ke shayad trend reverse hone wala hai.
Chart patterns woh graphical formations hoti hain jo price action se ban'ti hain. In patterns ko use karke traders future price movements ka andaza lagate hain. Kuch mashhoor chart patterns mein triangles, head and shoulders, aur flags shamil hain.- Triangle Breakout: Triangles ascending, descending, aur symmetrical hosaktay hain. Jab price triangle pattern ko tor kar nikalti hai, to ye breakout signal hota hai.
- Head and Shoulders Breakout: Ye pattern trend reversal ka signal deta hai. Jab price neckline ko tor kar nikalti hai, to ye breakout kehlata hai.
- Flag Breakout: Flag patterns continuation patterns hote hain. Jab price flag pattern ko tor kar nikalti hai, to ye signal hota hai ke trend jari rahega.
Volatility breakout woh hota hai jab price kisi narrow range mein move karne ke baad achanak ek taraf break karti hai. Ye breakouts usually high volatility ke waqt hote hain aur significant price movements ka signal dete hain.- Bollinger Bands Breakout: Bollinger Bands volatility indicators hain jo price ke upper aur lower bands ko denote karte hain. Jab price in bands ko tor kar nikalti hai, to ye breakout signal hota hai.
Forex market mein news events ka bohot barha asar hota hai. Jab koi significant news release hoti hai, to price rapidly move karti hai aur breakouts dekhne ko milte hain.- Economic Data Breakout: Jab koi important economic data release hota hai, to market mein achanak movement dekhne ko mil sakti hai, jo news breakout kehlata hai.
Breakout trading strategy use karne ke liye tajiron ko kuch ahem steps follow karne chahiye:- Identify Key Levels: Pehle support aur resistance levels identify karein. Trendlines aur chart patterns ko bhi note karein.
- Wait for Confirmation: Breakout hone ka wait karein aur confirmation ka intezar karein. Ye confirmation higher volume, price closing beyond key level, aur other technical indicators se mil sakti hai.
- Set Entry and Exit Points: Entry point us waqt set karein jab breakout confirm ho jaye. Stop loss aur take profit levels bhi define karein.
- Manage Risk: Risk management bohot zaroori hai. Apni position size ko aise manage karein ke agar market aapke khilaf jaye to aapka nuksaan limited ho.
Forex trading mein breakout strategy bohot effective ho sakti hai agar theek se implement ki jaye. Support aur resistance levels, trendlines, chart patterns, volatility indicators aur news events ko samajh kar aur analyze karke aap successful breakout trades execute kar sakte hain. Yad rahe ke risk management bohot zaroori hai, isliye hamesha apne trades ko manage karte waqt stop losses aur take profits ka zaroor istemal karein. Trading ek art hai aur isme skill aur patience dono chahiye. Happy trading!
-
NaveedeagleSenior Member
- Jul 2024
- 247
- 1
- 2
InstaSpot: کسی بھی EPS اور بینک سے منافع واپس لیں، اور EPS اور cryptocurrencies کے تبادلے پر 7% تک کمائیں۔
Introduction to Breakouts
Forex trading mein breakout ek aisa moment hota hai jab price apne existing range se bahar nikalta hai. Breakouts trading ka ek bohot important aspect hain kyunki ye aapko batate hain ke market ke trend mein significant changes aane wale hain. Aaj hum breakouts ke different types discuss kareinge.
Trendline Breakouts
Explanation
Trendline breakout tab hota hai jab price ek established trendline ko cross karta hai. Ye trendline ya toh ek upward trendline hoti hai jo support provide karti hai, ya ek downward trendline hoti hai jo resistance provide karti hai.
Example
Agar price consistently ek upward trendline ko follow kar rahi hai aur phir suddenly us trendline ke neeche gir jati hai, toh ye ek bearish trendline breakout hoga. Iska matlab hai ke buyers ab control mein nahi hain aur sellers ne market ko takeover kar liya hai.
Horizontal Level Breakouts
Explanation
Horizontal level breakouts tab hota hai jab price ek horizontal support ya resistance level ko break karti hai. Ye levels woh hote hain jahan pe price ne pehle resistance ya support face kiya ho.
Example
Agar price repeatedly $50 pe resist hoti hai aur phir suddenly $50 ko cross kar ke upar chali jati hai, toh ye ek bullish breakout hoga. Iska matlab hai ke market mein buyers zyada strong hain aur price ko upar push kar rahe hain.
Channel Breakouts
Explanation
Channel breakout tab hota hai jab price ek predefined channel ke boundary ko cross karta hai. Channels ek upper resistance line aur ek lower support line se bante hain aur price un dono ke beech move karti rehti hai.
Example
Agar price ek downward channel ko follow kar rahi hai aur phir suddenly upper resistance line ko break kar ke upar chali jati hai, toh ye ek bullish channel breakout hoga. Ye indicate karta hai ke market mein trend change ho raha hai aur upward movement expected hai.
Pattern Breakouts
Explanation
Pattern breakouts tab hotay hain jab price ek specific chart pattern ko break karti hai, jaise ke triangles, head and shoulders, ya double tops/bottoms. Ye patterns market mein potential trend reversals ya continuations ko indicate karte hain.
Example
Agar ek ascending triangle form ho raha hai aur price upper resistance line ko break karti hai, toh ye ek bullish pattern breakout hoga. Iska matlab hai ke market bullish trend mein continue karegi.
Fakeout (False Breakouts)
Explanation
Fakeouts wo breakouts hote hain jo initially lagte hain ke valid breakouts hain, magar price quickly apne original range mein wapas aa jati hai. Ye inexperienced traders ko confuse kar sakte hain aur unko losses face karne par majboor kar sakte hain.
Example
Agar price $100 pe horizontal resistance ko break karti hai, magar phir $100 ke neeche wapas aa jati hai, toh ye ek fakeout hoga. Ye indicate karta hai ke breakout sustainable nahi tha aur market abhi bhi us range mein trade kar rahi hai.
News Breakouts
Explanation
News breakouts tab hotay hain jab significant news events ya economic data releases price ko move karte hain. Ye breakouts bohot volatile hote hain aur quickly price movement cause karte hain.
Example
Agar ek major central bank interest rate ko unexpectedly change karta hai, toh ye forex market mein news breakout cause kar sakta hai. Iski wajah se price rapidly move karegi based on market participants' reactions.
Time Frame Considerations
Explanation
Breakouts ko identify karte waqt, time frame ko consider karna bohot zaroori hai. Different time frames par different types of breakouts observe ho sakte hain, aur short-term aur long-term trades ke liye different strategies apply hoti hain.
Example
Agar aap ek day trader hain, toh aapko short-term breakouts pe focus karna chahiye, jaise ke 15-minute ya 1-hour charts. Magar agar aap swing trader hain, toh aapko long-term breakouts pe focus karna chahiye, jaise ke daily ya weekly charts.
Volume and Breakouts
Explanation
Volume ek significant factor hai breakouts ko validate karne ke liye. High volume breakout zyada reliable hota hai compared to low volume breakout.
Example
Agar price ek resistance level ko high volume ke saath break karti hai, toh iska matlab hai ke breakout zyada strong aur sustainable hoga. Low volume breakout usually fakeout ho sakta hai.
Conclusion
Forex trading mein breakouts ko samajhna aur effectively trade karna bohot important hai. Different types of breakouts, jaise ke trendline, horizontal level, channel, pattern, fakeouts, aur news breakouts ko samajhne se aap better trading decisions le sakte hain. Volume aur time frame ko consider karna bhi equally important hai breakout trading ko effectively implement karne ke liye.
-
<a href="https://www.instaforex.org/ru/?x=ruforum">InstaForex</a> -
JawadbSenior Member
- Jan 2024
- 174
- 11
Breakout Types in Forex Trading
Breakout Kya Hai?
Forex trading mein breakout ek aisi situation hoti hai jab price ek specific level ko cross kar jati hai, jo pehle resistance ya support ke taur par kaam kar rahi thi. Breakout usually significant price movement ko indicate karta hai aur trading opportunities create karta hai.
Types of Breakouts- Bullish Breakout
- Bearish Breakout
- False Breakout
Bullish Breakout
Definition: Jab price resistance level ko break karte hue upar chali jati hai to ise bullish breakout kehte hain. Yeh usually strong uptrend ka signal hota hai.
Example: Agar EUR/USD ka resistance level 1.2000 hai aur price is level ko cross kar jati hai, to yeh bullish breakout kehlata hai.
Strategy:- Entry: Resistance break hone par buy position lein.
- Stop Loss: Previous resistance (ab support) level ke thoda neeche set karein.
- Target: Next resistance level ko target karein.
Bearish Breakout
Definition: Jab price support level ko break karte hue neeche chali jati hai to ise bearish breakout kehte hain. Yeh usually strong downtrend ka signal hota hai.
Example: Agar USD/JPY ka support level 110.00 hai aur price is level ko cross kar jati hai, to yeh bearish breakout kehlata hai.
Strategy:- Entry: Support break hone par sell position lein.
- Stop Loss: Previous support (ab resistance) level ke thoda upar set karein.
- Target: Next support level ko target karein.
False Breakout
Definition: Jab price temporarily support ya resistance level ko break karti hai magar wapas original range mein aa jati hai to ise false breakout kehte hain.
Example: Agar GBP/USD resistance level 1.3500 ko cross kare magar wapas 1.3480 par aa jaye, to yeh false breakout hai.
Strategy:- Entry: False breakout identify hone par opposite position lein (resistance break hone par sell aur support break hone par buy).
- Stop Loss: Small stop loss set karein taake risk control mein rahe.
- Target: Original range ke opposite boundary ko target karein.
Conclusion
Forex trading mein breakouts important opportunities create karte hain. Bullish aur bearish breakouts strong trends ka signal dete hain jabke false breakouts traps ban sakte hain. Effective trading ke liye proper analysis aur breakout confirmation zaroori hai. Technical indicators jaise volume, moving averages, aur price action patterns breakout ke confirmation mein madadgar sabit hote hain.
اب آن لائن
Working...
تبصرہ
Расширенный режим Обычный режим