**Forex Technical Analysis Kya Hai?**
Forex trading mein technical analysis aik bohat important tool hai jo traders ko market ke movement ko samajhne aur predict karne mein madad karta hai. Technical analysis mein, traders past price data aur trading volume ka use karte hain taake woh future price movements ka andaza laga sakein. Is mein different charts, indicators, aur patterns ka use hota hai jo market ke trends aur price behavior ko identify karne mein madadgar hote hain.
**Technical Analysis ke Basic Components**
1. **Price Charts:**
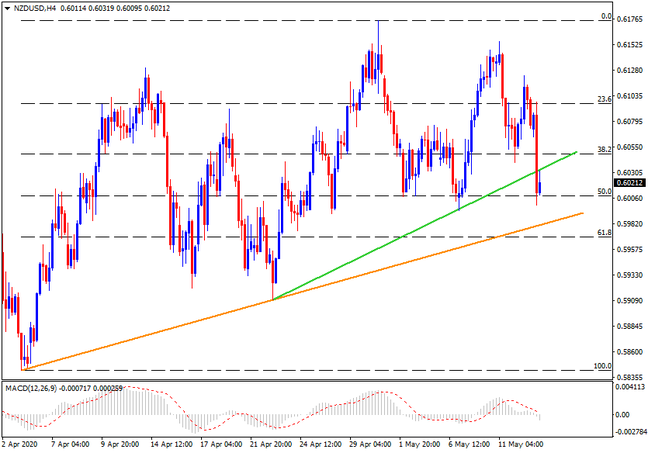
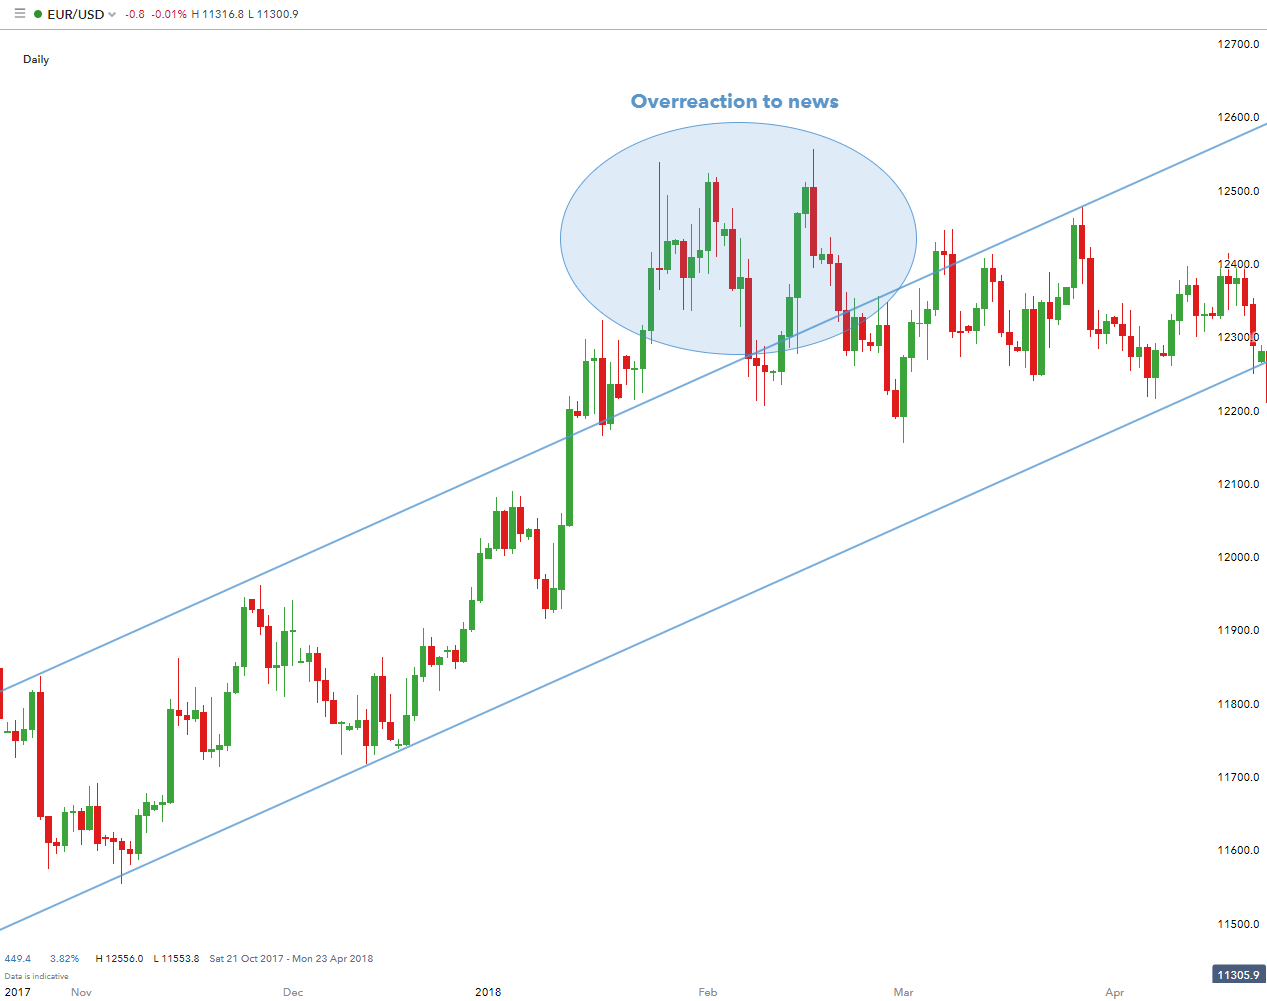
Sab se pehle, technical analysis mein price charts ka use hota hai. Yeh charts market ki price history ko visually represent karte hain. Candlestick charts, bar charts, aur line charts technical analysis mein sab se zyada mashhoor hain. In charts ke zariye traders market ke trends ko pehchan sakte hain aur trading decisions le sakte hain.
2. **Support aur Resistance Levels:**
Technical analysis mein support aur resistance levels ka concept bhi bohat ahmiyat rakhta hai. Support level woh price level hota hai jahan se price ne bar bar bounce kiya hota hai, jab ke resistance level woh hota hai jahan se price ne bar bar decline kiya hota hai. In levels ke zariye traders market ke reversal points ko identify karte hain.
3. **Technical Indicators:**
Indicators jese ke Moving Averages, Relative Strength Index (RSI), aur Moving Average Convergence Divergence (MACD) traders ko market ki strength aur weakness ko samajhne mein madad karte hain. Yeh indicators price aur volume data ko mathematically calculate karte hain aur market ke trend aur momentum ke bare mein valuable information provide karte hain.
4. **Chart Patterns:**
Technical analysis mein chart patterns bhi bohat important hote hain. Yeh patterns, jaise ke Head and Shoulders, Double Top, aur Triangles, market ke reversal ya continuation ke signals dete hain. Traders in patterns ko identify karte hain aur apne trades ko accordingly plan karte hain.
**Kyun Technical Analysis Zaroori Hai?**
Forex market bohat zyada volatile hoti hai aur price movements unpredictable hote hain. Technical analysis ka use karke traders apne trading strategies ko refine karte hain aur market ke unpredictable movements se bachne ki koshish karte hain. Yeh analysis short-term trading ke liye bohat faidemand hota hai kyun ke is mein market ke chhote chhote fluctuations ko observe karna aasaan hota hai.
Aakhir mein, forex technical analysis ek aisa skill hai jo time aur practice ke saath develop hota hai. Isko seekhne ke liye continuous learning aur market ke trends ko closely observe karna zaroori hai. Trading mein successful hone ke liye technical analysis ka samajhna aur isko effectively apply karna traders ke liye intehai zaroori hai.


تبصرہ
Расширенный режим Обычный режим