What is Hikkaki Candlestick Patterns in forex
-
Muskan1Senior Member

- Feb 2021
- 353
- 981
- 412
- 423 USD
-
<a href="https://www.instaforex.org/ru/?x=ruforum">InstaForex</a> -
Muskan1Senior Member
- Feb 2021
- 353
- 981
- 412
- 423 USD
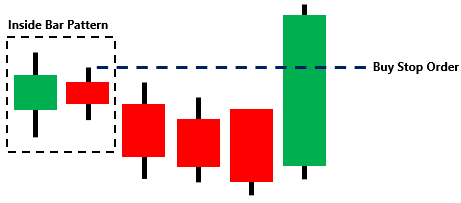
Hikkake Candlestick Patterns, price reversals aur trend changes ko identify karne ke liye istemal hone wale candlestick patterns hain. Ye patterns price action aur candlestick formations ke based par banate hain. Hikkake patterns mein, inside bars aur false breakouts ke concept ka istemal kiya jata hai. Hikkake patterns ki wazahat neeche diye gaye points mein samjhayi gayi hai: 1. Inside Bar: Hikkake patterns ka foundation inside bar formation par hota hai. Inside bar pattern mein, ek candlestick ki high aur low range dusre candlestick ki high aur low range mein hoti hai. Inside bar formation price consolidation aur market indecision ko indicate karta hai. 2. False Breakout: Hikkake patterns mein, inside bar ke baad market false breakout karta hai. False breakout mein, price inside bar ke high ya low level se bahar nikalta hai, lekin phir se inside bar range ke andar re-enter karta hai. Ye false breakout price reversal ke indication ke rup mein dikhta hai. 3. Bullish Hikkake Pattern: Bullish Hikkake pattern mein, inside bar ke baad price breakout karke upar jaata hai aur ek higher high banata hai. Is pattern ke appearance ke baad bullish trend ki shuruwat ho sakti hai. 4. Bearish Hikkake Pattern: Bearish Hikkake pattern mein, inside bar ke baad price breakout karke neeche jaata hai aur ek lower low banata hai. Is pattern ke appearance ke baad bearish trend ki shuruwat ho sakti hai. 5. Confirmation: Hikkake patterns ko confirm karne ke liye, traders dusre technical indicators aur price action patterns ka istemal karte hain. Is pattern ke saath trend lines, moving averages, aur volume analysis ka combination kiya ja sakta hai. Hikkake patterns ki ehmiaat market context aur dusre factors par depend karti hai. Is pattern ka istemal karne se pehle, aapko market conditions ko samajhna aur dusre technical analysis tools ka istemal karna zaruri hai. Demo account par practice karein aur apne trading strategy ko backtest karein, taaki aapko pattern ke performance ka idea mil sake. -
Aneesali7472Senior Member
- Jun 2022
- 185
- 28
- 161 USD
InstaSpot: کسی بھی EPS اور بینک سے منافع واپس لیں، اور EPS اور cryptocurrencies کے تبادلے پر 7% تک کمائیں۔
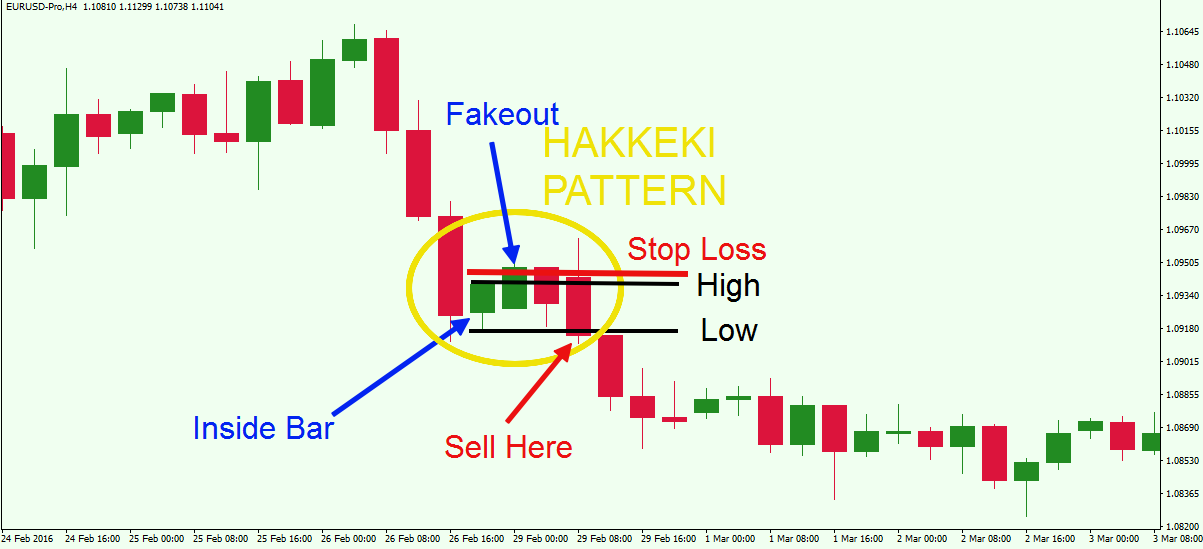
Hikkaki Candlestick Pattern: Dear Trading Partners Hikkaki Candlestick Pattern bohot zyada familiar nahi hai kyunke maximum member is candlestick pattern se related important information nahi jante jiski vajah se yah candlestick pattern bohot zyada famous nahi hy jab ap market mein is candlestick pattern ko study karte hain tou isko ap further 2 major categories mein divide kar sakte hain jisko ap bullish hikkaki aur bearish hikkaki keh sakte hain is related main apko kuch important information share kar deta hun jo apke liye useful ho sakti hai aur apki trading mein bahut zyada help kar sakti h. Indication of Hikkaki Candlestick Pattern: Dear Forex Members Hikkaki Candlestick Pattern market main trend ke change hony ki clear indication deta hai. Aur bohot useful hota hai. Jab market countinuesly ek hi trend main movement karti hai aur same trend main ki candles creat karti hai tou is ke badh ek aisi candle banti hai jo last three candles ko reverse main break kar rahi hon to is ka matlab hota hai ke market ka previous trend khatam ho chuka hai. Is surat main jo trade open hoti hain in ko close kar dena chahiye or new trade new market trend direction main open karny chahiye. Information of Hikkaki Candlestick Pattern: Dear Sisters and Brothers Agar ham Hikkaki Candlestick Pattern ko ignore kar dety hain to hamara loss increase karty karty humara account wash be ho sakta hai isi liye hamy soch samajh kar trading main entry or exit bohot zaroori hota hai ap ko chahiye ke dil se kaam karain or ek acha trade kar ke ek achi earning ki koshish karain ta ke ap ko kamyabi mil saky ap ki mehnat or ek achi trading ap ki kamyabi hoti hy jis se ap kamyabi ke sath apna kaam kar sakty hain. -
Riaz HussainSenior Member
- Mar 2020
- 723
- 790
- 1128
- 980 USD
Hikkaki candlestick pattern:
Hikkake candlestick pattern ek reversal pattern hai. Ye pattern false breakouts ko identify karne mein madad karta hai. Is pattern mein ek small inside bar followed by a breakout candle hota hai. Agar breakout candle ki high ya low ko break nahi kiya jata, toh ye false breakout ke indication hote hain. Is tarah se, hikkake pattern price action analysis mein false breakouts ko detect karne mein madad karta hai.
Trade with hikkaki pattern:
Hikkake candlestick pattern se trading karne ke liye aapko kuch steps follow karne honge:
1. Pattern Recognition:
Hikkake pattern ko identify karein. Ismein ek small inside bar ke baad breakout candle hota hai.
2. Confirmation:
Breakout candle ki high ya low ko confirm karein. Agar price breakout ke baad wapas inside bar ke andar rehta hai, toh ye false breakout ka indication ho sakta hai.
3. Entry and Stop Loss:
Agar aapko hikkake pattern ka confirmation mil gaya hai, toh aap trade enter kar sakte hain. Entry point par buy ya sell order lagayein aur stop loss set karein, jisse aap apne risk ko manage kar sakein.
4. Target and Exit:
Profit target ko set karein aur jab price us level tak pahunch jaye, trade ko exit karein. Apne trading plan ke hisab se profit booking karein.
5. Risk Management:
Apne trades ke liye ek risk management plan banayein. Position size, stop loss, aur take profit levels ko set karein. Apne risk ko control karna hamesha zaroori hai.
6. Practice and Analysis:
Hikkake pattern ko samajhne ke liye practice karein aur historical data analyze karein. Apne trades ko regularly review karein aur apni strategy ko refine karte rahein. Remember, hamesha apne trading plan ko follow karein aur emotions ko control karein. Practice aur patience bahut zaroori hai price action trading mein. -
JERRY1Senior Member
- Nov 2023
- 379
- 58
- 81
- 384 USD
Forex trading mein, market trends aur future movements ko samajhne ke liye traders ne kayi tarah ke technical analysis tools ka istemal kiya hai. Ek aise tool ka jiska istemal traders karte hain, wo hai candlestick patterns. In patterns mein se ek mahir tijaratkaron ke liye khaas tareeqa "Hikkake Candlestick Pattern" hai. Is pattern ka tajzia karte hain aur samajhte hain ke ye traders ke liye kyun ahem ho sakta hai.
Hikkake Candlestick Pattern Kya Hai?
Hikkake, Japanese shabd "kaka" se aaya hai, jo ke "shikar" ya "phanda" ko darust karta hai. Hikkake pattern market mein hone wale reversals ko darust karne ka maqsad rakhta hai. Is pattern mein kuch makhsoos candlesticks ka aapas mein talluq hota hai jo market ke potential changes ko dikhate hain.
Inside Bar Formation:
Hikkake pattern ka pehla kadam hota hai ek inside bar formation ka. Inside bar ka matlab hota hai ke ek candlestick ka range doosre candlestick ke andar fita hua hai.
Fake Out Candle:
Iske baad, market mein ek "fake out" candle hoti hai. Fake out candle market ke opposite direction mein move karti hai, lekin iska range inside bar ke andar rehta hai.
Inside Bar Break:
Agla step hai jab doosri inside bar ka formation hota hai, lekin is bar ka range pehli inside bar ke range ko cross kar leta hai.
Confirmation Candle:
Aakhir mein, ek confirmation candle aati hai jo fake out candle ko cross karte hue inside bars ke range ko bhi paar kar leti hai. Ye candle market mein hone wale reversal ko darust karta hai.
Hikkake Pattern Ka Istemal:
Reversal Indication:
Hikkake pattern market mein hone wale reversals ko darust karta hai. Jab ye pattern tayar hota hai, toh ye ek indication hai ke market ka trend badalne wala hai.
Entry aur Exit Points:
Traders is pattern ko istemal karke entry aur exit points tay karte hain. Hikkake pattern ke confirmation ke baad, traders apne trades ko enter karte hain, expecting ke market ab opposite direction mein move karega.
Risk Management:
Hikkake pattern ke istemal mein risk management ka bhi khayal rakha jata hai. Traders stop-loss orders ka istemal karte hain taake nuksanat se bacha ja sake.

Hikkake Pattern Ka Istemal Karne Ke Tariqay:
Market Analysis:
Pehle toh traders ko market analysis karna hota hai, aur dekhein ke kya market mein potential reversal hone ke chances hain.
Inside Bars Ki Pechan:
Traders ko inside bars ki pechan karni hoti hai. Yani ke do consecutive candlesticks ka range doosre candlestick ke andar fita hua ho.
Fake Out Candle Ka Tajarba:
Fake out candle ko dekh kar traders ko tajarba karna hota hai. Ye candle market ke opposite direction mein move karta hai, lekin iska range inside bars ke andar rehta hai.
Confirmation Candle Ka Intezar:
Confirmatory candle ka intezar kiya jata hai. Jab ye candle inside bars ke range ko paar karta hai, toh ye indication hai ke market mein reversal hone wala hai.
Hikkake Pattern Ke Faida:
Reversal Signals:
Ye pattern traders ko reversal signals deta hai, jisse wo market trends ko aage predict kar sakein.
Entry Aur Exit Points:
Traders ko entry aur exit points tay karne mein madad karta hai, jo ke ek trading strategy ke liye ahem hai.
Risk Management:
Is pattern ka istemal karke traders apne trades ko control mein rakhte hain, risk management ka khayal rakhte hain.
Hikkake Candlestick Pattern ek mofeed tool hai jo market trends ko samajhne mein madad karta hai. Lekin, har ek trading decision ke liye, zaroori hai ke traders apne research aur analysis ko mazbooti se karein. Hamesha yaad rakhein ke market mein kisi bhi pattern ya indicator ka istemal keval ek tajzia ka hissa hota hai, aur market risks ko puri tarah samajh kar hi trading karna chahiye.There is a time to go long, a time to go short and a time to go fishing.
-
WinterSenior Member
- Dec 2023
- 465
- 236
- 185
- 198 USD
InstaSpot: کسی بھی EPS اور بینک سے منافع واپس لیں، اور EPS اور cryptocurrencies کے تبادلے پر 7% تک کمائیں۔
Hikkake candlestick pattern ek complex yet useful technical analysis tool hai jo forex trading mein traders ko potential reversals aur continuation patterns ko identify karne mein madad karta hai. Hikkake pattern Japanese candlestick charting ke basis par develop kiya gaya hai aur ye typically do types ka hota hai: bullish hikkake aur bearish hikkake. Hikkake pattern ko samajhna aur effectively use karna trading decisions ko improve karne mein madadgar ho sakta hai.
Hikkake Candlestick Pattern ke Basics
Hikkake pattern ek multi-bar pattern hota hai jo ek inside bar aur uske subsequent price movements par based hota hai. Ye pattern market ke consolidation phase ko identify karta hai aur price breakout ka potential indication deta hai. Hikkake pattern typically 3 to 5 bars ka hota hai aur isse detect karne ke liye traders ko price action par focus karna padta hai.
Bullish Hikkake Pattern
Bullish Hikkake pattern ek bullish reversal pattern hai jo market ke downward trend ke baad formation leta hai. Is pattern ko identify karne ke liye kuch key points hain:- Inside Bar: Pehla step inside bar ka formation hota hai. Inside bar ek aisi candlestick hoti hai jo apne previous candlestick ke high aur low ke beech close hoti hai.
- Breakout of Inside Bar: Next step inside bar ke high ya low ka breakout hai. Agar price inside bar ke high ko breakout karti hai, toh bullish hikkake pattern ka formation shuru hota hai.
- Failure to Continue: Breakout ke baad price previous candlestick ke range mein wapas aati hai aur uske opposite direction mein move karti hai.
- Bullish Confirmation: Final step bullish confirmation hai, jo tab hota hai jab price inside bar ke high ko dobara breakout karti hai. Ye bullish trend reversal ka signal hota hai.
Bearish Hikkake pattern ek bearish reversal pattern hai jo market ke upward trend ke baad formation leta hai. Is pattern ko identify karne ke liye kuch key points hain:- Inside Bar: Pehla step inside bar ka formation hota hai. Inside bar ek aisi candlestick hoti hai jo apne previous candlestick ke high aur low ke beech close hoti hai.
- Breakout of Inside Bar: Next step inside bar ke high ya low ka breakout hai. Agar price inside bar ke low ko breakout karti hai, toh bearish hikkake pattern ka formation shuru hota hai.
- Failure to Continue: Breakout ke baad price previous candlestick ke range mein wapas aati hai aur uske opposite direction mein move karti hai.
- Bearish Confirmation: Final step bearish confirmation hai, jo tab hota hai jab price inside bar ke low ko dobara breakout karti hai. Ye bearish trend reversal ka signal hota hai.
Forex trading mein Hikkake pattern ko trade karne ke liye kai strategies hain jo traders apni trading style aur market conditions ke mutabiq adopt kar sakte hain.
1. Breakout Trading Strategy
Is strategy ke under, trader Hikkake pattern ke breakout points ka wait karta hai aur trade initiate karta hai. Bullish hikkake pattern ke case mein, trader inside bar ke high ke breakout par buy position initiate karta hai. Similarly, bearish hikkake pattern ke case mein, trader inside bar ke low ke breakout par sell position initiate karta hai.
2. Confirmation Trading Strategy
Is strategy mein trader Hikkake pattern ke confirmation ka wait karta hai aur tab trade initiate karta hai. Bullish hikkake pattern ke case mein, trader inside bar ke high ke breakout ke baad price ka previous high ko break karne ka wait karta hai aur tab buy position initiate karta hai. Similarly, bearish hikkake pattern ke case mein, trader inside bar ke low ke breakout ke baad price ka previous low ko break karne ka wait karta hai aur tab sell position initiate karta hai.
3. Support and Resistance Trading Strategy
Is strategy mein trader Hikkake pattern ko support aur resistance levels ke saath combine karke trade karta hai. Bullish hikkake pattern ke case mein, trader support level ke near buy position initiate karta hai jab confirmation mil jaye. Similarly, bearish hikkake pattern ke case mein, trader resistance level ke near sell position initiate karta hai jab confirmation mil jaye.
Advantages
1. Early Reversal Signals:
Hikkake pattern early reversal signals provide karta hai jo traders ko potential trend changes ko pehle identify karne mein madadgar hota hai.
2. Versatility:
Hikkake pattern versatile hai aur isse different timeframes aur market conditions mein use kiya ja sakta hai.
3. Combines Well with Other Indicators:
Hikkake pattern doosre technical indicators ke saath combine ho kar strong trading signals generate karta hai. Yeh trend lines, moving averages, aur RSI ke saath mil kar trading decisions ko enhance karta hai.
Disadvantages
1. Complexity:
Hikkake pattern complex hai aur isse accurately identify karna mushkil ho sakta hai. Beginners ke liye yeh pattern samajhna aur use karna challenging ho sakta hai.
2. False Signals:
Hikkake pattern false signals generate kar sakta hai, especially volatile markets mein. False signals se traders ko losses face karne pad sakte hain.
Hikkake candlestick pattern ek powerful aur versatile tool hai jo traders ko potential reversals aur continuation patterns ko identify karne mein madad karta hai. Bullish hikkake pattern bullish reversal ka indication deta hai, jabke bearish hikkake pattern bearish reversal ka indication deta hai. Hikkake pattern ko trade karne ke liye kai strategies hain jese ke breakout trading, confirmation trading, aur support and resistance trading strategies. Ye strategies traders ko better trading decisions lene mein madadgar hoti hain aur profitability ko increase karte hain.
Hikkake pattern ka main advantage early reversal signals aur versatility hai, lekin iski complexity aur false signals ke risks ko bhi madde nazar rakhna zaroori hai. Overall, Hikkake pattern ko samajhna aur effectively use karna successful forex trading ke liye zaroori hai aur ye traders ko market ke movements ko better understand karne mein madadgar hota hai. -
Umii128Member
- Mar 2024
- 31
- 19
- 4
What is hikkaki candlestick patterns in forex
Hikkake Candlestick Patterns in Forex
Forex trading mein candlestick patterns ko bohot importance di jati hai. In patterns mein se ek unique pattern hikkake candlestick pattern hai. Hikkake pattern ko market trend ko samajhne aur trading decisions lene mein help ke liye use kiya jata hai. Is article mein hum Hikkake candlestick pattern ke bare mein tafseel se janenge.
Hikkake Pattern Kya Hai?
Hikkake pattern ek reversal aur continuation pattern hai jo market ke trend ka signal deta hai. Yeh pattern do tarah se banta hai: bullish hikkake aur bearish hikkake. Hikkake pattern tab banta hai jab ek inside bar ke baad, market next few bars mein opposite direction mein move karta hai, aur phir uske baad wapas inside bar ke direction mein jata hai.
Bullish Hikkake Pattern
Bullish hikkake pattern tab banta hai jab ek inside bar ke baad market niche move karta hai, magar phir bullish reversal hota hai. Is pattern ka matlab hai ke market pehle bearish tha magar ab bullish trend shuru ho raha hai.
Example:- Pehle ek inside bar banta hai.
- Agle ek ya do bars mein market niche move karta hai.
- Phir uske baad market wapas upward move karta hai, jo bullish trend ka signal hai.
Bearish Hikkake Pattern
Bearish hikkake pattern bullish hikkake ka ulta hota hai. Yeh tab banta hai jab ek inside bar ke baad market upar move karta hai, magar phir bearish reversal hota hai. Is pattern ka matlab hai ke market pehle bullish tha magar ab bearish trend shuru ho raha hai.
Example:- Pehle ek inside bar banta hai.
- Agle ek ya do bars mein market upar move karta hai.
- Phir uske baad market wapas downward move karta hai, jo bearish trend ka signal hai.
Hikkake Pattern Ko Identify Karna
Hikkake pattern ko identify karna thoda tricky ho sakta hai, magar kuch steps follow kar ke aap asaani se is pattern ko pehchan sakte hain.- Inside Bar: Pehle inside bar ko identify karen. Inside bar wo hota hai jiska high aur low previous bar ke range ke andar hota hai.
- Breakout: Dekhen ke inside bar ke baad market ne breakout kiya hai ya nahi. Bullish hikkake ke liye breakout niche hona chahiye aur bearish hikkake ke liye breakout upar hona chahiye.
- Reversal: Breakout ke baad market ko reversal karte hue inside bar ke direction mein move karna chahiye.
Hikkake Pattern Ka Use
Hikkake pattern ko use kar ke aap trading mein fayda utha sakte hain. Yeh pattern market ke reversal aur continuation signals ko samajhne mein madad karta hai.- Entry Point: Jab aapko hikkake pattern nazar aaye, to aap uske reversal point pe entry le sakte hain.
- Stop Loss: Hikkake pattern use karte hue stop loss ko breakout point ke thoda upar ya niche rakhen.
- Take Profit: Take profit levels ko previous support aur resistance levels pe rakhen.
Hikkake Pattern Ki Limitations
Har trading pattern ki tarah hikkake pattern ki bhi kuch limitations hain. Yeh zaroori nahi ke har baar yeh pattern sahi signal de. Market mein bohot si aur cheezen bhi affect kar sakti hain jaise economic news, market sentiment, aur geopolitical events.
Conclusion
Hikkake candlestick pattern ek valuable tool hai forex traders ke liye. Is pattern ko samajhne aur sahi tarah se use karne se aap apne trading decisions ko improve kar sakte hain. Magar yaad rakhen ke kisi bhi pattern ko blindly follow karna sahi nahi hota. Hamesha apne analysis aur risk management ko prioritize karen.
-
KhatibSenior Member
- Jun 2024
- 164
- 97
- 28
What is Hikkaki Candlestick Patterns in forex
The Hikkake candlestick pattern is a technical analysis tool used by traders to predict potential price reversals or continuations in forex and other financial markets. Developed by Daniel L. Chesler, this pattern involves a specific sequence of price movements and is categorized as a price action pattern rather than relying on indicators.
Key Characteristics:- Setup Bar: The first bar in the pattern, which can be either bullish or bearish.
- Inside Bar: The second bar has a high and low within the range of the setup bar.
- False Breakout: The third bar moves outside the range of the inside bar, indicating a potential breakout.
- Reversal Bar: The fourth bar moves back inside the range of the inside bar, suggesting that the breakout was false and indicating a potential reversal.
- Bullish Hikkake: Formed during a downtrend and signals a potential upward reversal.
- Bearish Hikkake: Formed during an uptrend and signals a potential downward reversal.
- Bullish Hikkake:
- Entry: After the price moves back above the inside bar's high.
- Stop Loss: Below the low of the false breakout bar.
- Target: Based on risk-reward ratio or technical analysis.
- Bearish Hikkake:
- Entry: After the price moves back below the inside bar's low.
- Stop Loss: Above the high of the false breakout bar.
- Target: Based on risk-reward ratio or technical analysis.
Consider a bearish Hikkake pattern:- Day 1 (Setup Bar): High of 1.1500, Low of 1.1450.
- Day 2 (Inside Bar): High of 1.1495, Low of 1.1455.
- Day 3 (False Breakout): High of 1.1510, Low of 1.1460.
- Day 4 (Reversal): High of 1.1490, Low of 1.1445.
In this scenario, traders might enter a short position when the price moves below
Certainly! Here is a detailed explanation of the Hikkake candlestick pattern, including its formation, identification, and trading strategies.
Hikkake Pattern: Detailed Explanation
Definition:
The Hikkake pattern is a short-term price action pattern that can indicate a potential reversal or continuation in the market. It comprises a specific sequence of candlesticks and relies on identifying false breakouts.
Formation:
The Hikkake pattern forms over four trading sessions and involves the following key components:- Setup Bar (Day 1):
- The setup bar can be either bullish (close higher than open) or bearish (close lower than open).
- This bar sets the high and low range for the subsequent inside bar.
- Inside Bar (Day 2):
- The inside bar has a high that is lower than or equal to the high of the setup bar and a low that is higher than or equal to the low of the setup bar.
- This bar signals a potential period of consolidation.
- False Breakout (Day 3):
- The third bar moves outside the range of the inside bar.
- This can be an upward move above the high of the inside bar or a downward move below the low of the inside bar.
- The false breakout suggests a potential breakout from the consolidation range.
- Reversal Bar (Day 4):
- The fourth bar moves back inside the range of the inside bar, indicating that the breakout was false.
- This bar signals a potential reversal in the market direction.
To identify a Hikkake pattern, follow these steps:- Identify the Setup Bar: Look for a significant high and low range on Day 1.
- Identify the Inside Bar: Ensure that the high and low of Day 2 are within the range of the setup bar.
- Identify the False Breakout: On Day 3, observe if the price moves outside the high or low of the inside bar.
- Identify the Reversal Bar: On Day 4, check if the price moves back inside the range of the inside bar.
- Bullish Hikkake: Typically occurs in a downtrend and suggests a potential upward reversal.
- Bearish Hikkake: Typically occurs in an uptrend and suggests a potential downward reversal.
- Bullish Hikkake Pattern:
- Entry: Enter a long position when the price moves above the high of the inside bar.
- Stop Loss: Place a stop loss below the low of the false breakout bar.
- Take Profit: Set a target based on a favorable risk-reward ratio or technical resistance levels.
Example:- Day 1 (Setup Bar): High of 1.2000, Low of 1.1900.
- Day 2 (Inside Bar): High of 1.1980, Low of 1.1920.
- Day 3 (False Breakout): High of 1.1995, Low of 1.1880.
- Day 4 (Reversal): High of 1.1970, Low of 1.1910.
In this scenario, enter a long position when the price moves above 1.1980, with a stop loss below 1.1880. - Bearish Hikkake Pattern:
- Entry: Enter a short position when the price moves below the low of the inside bar.
- Stop Loss: Place a stop loss above the high of the false breakout bar.
- Take Profit: Set a target based on a favorable risk-reward ratio or technical support levels.
Example:- Day 1 (Setup Bar): High of 1.1500, Low of 1.1450.
- Day 2 (Inside Bar): High of 1.1490, Low of 1.1460.
- Day 3 (False Breakout): High of 1.1510, Low of 1.1440.
- Day 4 (Reversal): High of 1.1480, Low of 1.1455.
In this scenario, enter a short position when the price moves below 1.1460, with a stop loss above 1.1510.
- Simplicity: Easy to identify and implement.
- Price Action Based: Relies on raw price data without the need for additional indicators.
- Reversal Signals: Helps traders identify potential market reversals early.
- False Signals: Like any technical pattern, it can produce false signals.
- Short-Term: Primarily useful for short-term trading and may not be as effective for long-term trends.
By understanding and effectively utilizing the Hikkake candlestick pattern, traders can enhance their ability to identify potential market reversals and improve their trading performance.
-
JunubalochSenior Member
- Jun 2024
- 281
- 16
- 113
- 51 USD
InstaSpot: کسی بھی EPS اور بینک سے منافع واپس لیں، اور EPS اور cryptocurrencies کے تبادلے پر 7% تک کمائیں۔
Hikkaki Candlestick Patterns in Forex
Forex trading mein candlestick patterns ko samajhna bohot zaroori hai kyun ke yeh price movements aur market trends ko predict karne mein madadgar hote hain. Hikkaki candlestick pattern ek unique aur useful pattern hai jo traders ko market reversals ko identify karne mein madad karta hai. Aayiye is pattern ke baare mein tafseel se baat karte hain.
Hikkaki Candlestick Pattern Kya Hai?
Hikkaki candlestick pattern ek rare pattern hai jo do types mein aata hai: bullish hikkaki aur bearish hikkaki. Yeh pattern typically do ya zyada candlesticks par mushtamil hota hai aur yeh market reversal ka indication deta hai.
Bullish Hikkaki Pattern:
Yeh pattern tab hota hai jab ek bearish candlestick ke baad ek bullish candlestick aati hai jo pehle candlestick ke body ke andar close hoti hai. Yeh indicate karta hai ke market trend ab reversal ki taraf ja raha hai aur prices upar ja sakti hain.
Bearish Hikkaki Pattern:
Yeh pattern tab hota hai jab ek bullish candlestick ke baad ek bearish candlestick aati hai jo pehle candlestick ke body ke andar close hoti hai. Yeh indicate karta hai ke market trend ab reversal ki taraf ja raha hai aur prices neeche ja sakti hain.
Hikkaki Pattern Ki Pehchaan:
1. First Candle:
Pehli candle ek clear trend ko show karti hai, yani bullish ya bearish trend.
2. Second Candle:
Dusri candle pehli candle ke range ke andar close hoti hai.
3. Pattern Confirmation:
Yeh pattern tab confirm hota hai jab third candle previous trend ke opposite direction mein move karti hai.
Hikkaki Pattern Ka Istemaal:
1. Entry Points:
Hikkaki pattern ke through traders apni entry points ko identify kar sakte hain. Jab bullish hikkaki pattern form hota hai, yeh acha mauka hota hai buy karne ka. Isi tarah, bearish hikkaki pattern short-selling ka indication hota hai.
2. Risk Management:
Risk management ke liye stop-loss orders ko use karna zaroori hai. Stop-loss ko previous low (bullish hikkaki ke liye) ya previous high (bearish hikkaki ke liye) par set karain.
3. Confirmation:
Hamesha additional indicators aur tools ka istemal karke hikkaki pattern ko confirm karain. Volume indicators, moving averages, aur other technical indicators ke through aap apni trades ko further validate kar sakte hain.
Conclusion:
Hikkaki candlestick patterns forex trading mein ek valuable tool hai jo market reversals ko identify karne mein madad karta hai. Yeh pattern mushkil ho sakta hai identify karna lekin jab sahi tareeke se pehchana jaye tou yeh profitable trades ka source ban sakta hai. Hamesha yaad rakhein ke kisi bhi trading strategy ko use karne se pehle proper research aur practice karna bohot zaroori hai.
-
Sumi2193Senior Member
- Mar 2024
- 427
- 25
- 19
- 69 USD
HIKKAKI PATTERNExplanation of Hikkaki Pattern:
As salam o alikum behno or bhaiyon, Hikkaki pattern ik reversal signal deta hy. Agar inside bar ky bad market false breakout karky phir se inside bar ky range ky andar ata hy or phir confirmation candle dikhta hy, to ye ik bullish ya bearish reversal signal ho sakta hy, depending on the direction of the breakout.Hikkaki pattern ko samajhne ky liye, traders ko candlistick charts or price action analysis ky sath candle formations ko closely monitor karna hota hy. Is pattern ko trading strategy ky hissa ky tor par istemal kiya jata hy, jisse traders market reversals ko pehchan sakte hain. Hikkaki pattern ko dusre technical indicators or analysis ky sath istemal karne se behtar risults mil sakte hain.Hikkaki Candlistick Pattern ik technical analysis tool hy jo traders istemal karte hain market direction or potential reversals ko identify karne ky liye. Is pattern ka maqsad market ki instability or trend reversal ko indicate karna hota hy. Hikkaki pattern ko samajhne ky liye, apko candlistick charts or unky formations ko dikhne ki zarurat hoti hy.
Importance of Hikkaki pattern:
Hello dear traders, Hikkaki Candlistick Pattern hamain trend change hony ki clear indication provide karta hy jab market continuously ik hi trend main movement karti hy or same trend main koi candlis create karti hy to aisy time per agar ik aysi candle create ho jay jo last three candlis ko reverse order main break kyr rehi ho to is ka matlab hy ky ab market main previous trend end ho chuka hy, or market main trend change ho k market reverse direction main new trend start karny ja rehi hay. jis ky according apni trade ko adjust kiya ja sakta hy.Hikkaki Candlistick Pattern bohot zyada familiar nahin hy kiu ky maximum member is candlistick pattern se related important information nahi jante jiski vajah se yeh candlistick pattern bohot zyada famous nahi hy Jab ap market main is candlistick pattern ko study karte hain to isko ap further 2 major categoriis main divide kar sakte hain Jisko ap bullish Hikkaki or bearish Hikkaki kyh sakte hain is se related main apko kuch important information share kar deta hun jo apky liye useful ho sakti hy or apki trading main apki bohot zyada help kar sakti hy.
-
legoSenior Member
- May 2024
- 201
- 11
- 63 USD
Hikkaki Candlestick Patterns in Forex
Forex trading mein candlestick patterns ko samajhna bohot zaroori hai kyun ke yeh price movements aur market trends ko predict karne mein madadgar hote hain. Hikkaki candlestick pattern ek unique aur useful pattern hai jo traders ko market reversals ko identify karne mein madad karta hai. Aayiye is pattern ke baare mein tafseel se baat karte hain.Hikkaki Candlestick Pattern Kya Hai
Hikkaki candlestick pattern ek rare pattern hai jo do types mein aata hai: bullish hikkaki aur bearish hikkaki. Yeh pattern typically do ya zyada candlesticks par mushtamil hota hai aur yeh market reversal ka indication deta hai.
Bullish Hikkaki Pattern
Yeh pattern tab hota hai jab ek bearish candlestick ke baad ek bullish candlestick aati hai jo pehle candlestick ke body ke andar close hoti hai. Yeh indicate karta hai ke market trend ab reversal ki taraf ja raha hai aur prices upar ja sakti hain.
Bearish Hikkaki Pattern
Yeh pattern tab hota hai jab ek bullish candlestick ke baad ek bearish candlestick aati hai jo pehle candlestick ke body ke andar close hoti hai. Yeh indicate karta hai ke market trend ab reversal ki taraf ja raha hai aur prices neeche ja sakti hain.
Hikkake Pattern Ka Istemal
Reversal Indication
Hikkake pattern market mein hone wale reversals ko darust karta hai. Jab ye pattern tayar hota hai, toh ye ek indication hai ke market ka trend badalne wala hai.
Entry aur Exit Points
Traders is pattern ko istemal karke entry aur exit points tay karte hain. Hikkake pattern ke confirmation ke baad, traders apne trades ko enter karte hain, expecting ke market ab opposite direction mein move karega.
Risk Management
Hikkake pattern ke istemal mein risk management ka bhi khayal rakha jata hai. Traders stop-loss orders ka istemal karte hain taake nuksanat se bacha ja sake.
-
NaveedeagleSenior Member
- Jul 2024
- 462
- 1
- 5
- 39 USD
InstaSpot: کسی بھی EPS اور بینک سے منافع واپس لیں، اور EPS اور cryptocurrencies کے تبادلے پر 7% تک کمائیں۔
What is Hikkaki Candlestick Patterns in Forex?
Introduction
Hikkaki Candlestick Pattern aik kamyab aur complex reversal pattern hai jo traders ko forex market mein trend reversals identify karne mein madad karta hai. Ye pattern do alag-alag candlestick patterns par mabni hota hai jo ek dusre ke opposite hote hain.
Pattern Formation
Hikkaki pattern do alag candlestick patterns ko include karta hai: Inside Bar aur Hikkaki Pattern khud. Pehla, ek inside bar formation hota hai jahan doosra candlestick, pehle candlestick ke range ke andar hota hai. Iske baad, Hikkaki pattern form hota hai jo ek bullish ya bearish trend reversal indicate karta hai.
Bullish Hikkaki Pattern
Bullish Hikkaki pattern tab hota hai jab market downtrend mein ho aur inside bar formation ke baad ek bullish reversal signal diya jata hai. Isme:
Pehli candle bearish hoti hai.
Doosri candle bhi bearish hoti hai aur pehli candle ke range ke andar hoti hai.
Teesri candle bullish hoti hai aur pehli do candles ke high ko break karti hai.
Ye pattern indicate karta hai ke buyers market mein enter ho gaye hain aur price upar ki taraf move karne wali hai.
Bearish Hikkaki Pattern
Bearish Hikkaki pattern tab hota hai jab market uptrend mein ho aur inside bar formation ke baad ek bearish reversal signal diya jata hai. Isme:
Pehli candle bullish hoti hai.
Doosri candle bhi bullish hoti hai aur pehli candle ke range ke andar hoti hai.
Teesri candle bearish hoti hai aur pehli do candles ke low ko break karti hai.
Ye pattern indicate karta hai ke sellers market mein enter ho gaye hain aur price neeche ki taraf move karne wali hai.
Psychology Behind the Pattern
Is pattern ke peeche psychology yeh hai ke inside bar formation ke baad market indecisive hoti hai aur traders wait karte hain ke price kis direction mein move karega. Jab Hikkaki pattern form hota hai, to yeh ek strong reversal signal provide karta hai jo indicate karta hai ke ek naya trend shuru hone wala hai.
Trading Strategy Using Hikkaki Pattern
Hikkaki pattern ko trading strategy mein use karne ke liye, aapko is pattern ko identify karna hoga aur uske baad appropriate entry aur exit points ko define karna hoga. Yahan kuch steps hain:
Identify the Pattern: Market mein inside bar formation ko dekhain aur uske baad Hikkaki pattern ko identify karein.
Set Entry Point: Bullish Hikkaki pattern ke case mein, teesi bullish candle ke high ke upar buy entry place karein. Bearish Hikkaki pattern ke case mein, teesi bearish candle ke low ke neeche sell entry place karein.
Set Stop Loss: Risk management ke liye stop loss set karna zaroori hai. Bullish pattern mein, stop loss second candle ke low ke neeche place karein. Bearish pattern mein, stop loss second candle ke high ke upar place karein.
Set Target: Target profit level ko previous support aur resistance levels ke base par define karein. Risk-reward ratio ko madde nazar rakhte hue target set karein.
Advantages and Disadvantages
Advantages:
Strong Reversal Signal: Hikkaki pattern strong reversal signal provide karta hai jo high probability trades ke liye effective hota hai.
Clear Entry and Exit Points: Ye pattern clear entry aur exit points define karta hai jo trading strategy ko simplify karta hai.
Disadvantages:
Complexity: Ye pattern complex hai aur isko accurately identify karna mushkil ho sakta hai.
False Signals: Market mein false signals bhi mil sakte hain jo loss ka sabab ban sakte hain.
Conclusion
Hikkaki Candlestick Pattern ek valuable tool hai forex traders ke liye jo trend reversals ko identify karne mein madad karta hai. Is pattern ko samajhne aur effectively use karne ke liye practice aur market experience zaroori hai. Ye pattern trading strategy mein risk management aur disciplined approach ke sath use kiya jana chahiye taake profitable results hasil ho saken...
-
<a href="https://www.instaforex.org/ru/?x=ruforum">InstaForex</a> -
TreetSenior Member
- Jun 2024
- 1300
- 5
- 17
- 134 USD
### Hikkake Candlestick Pattern in Forex
Hikkake Candlestick Pattern ek complex aur kam-jana pehchana pattern hai jo forex trading mein potential price reversals aur continuations ko identify karne ke liye use hota hai. Is pattern ka naam Japanese word "Hikkake" se liya gaya hai, jo "trick" ya "catch" ka matlab deta hai. Is post mein hum Hikkake Candlestick Pattern ke concept aur uske significance ko discuss karenge.
**1. Hikkake Pattern Kya Hai:**
Hikkake Pattern ek multi-candle formation hai jo price consolidation aur subsequent breakout ko indicate karta hai. Ye pattern bullish aur bearish dono scenarios mein form ho sakta hai aur mostly false breakouts ko trap karta hai. Hikkake pattern ko samajhna aur identify karna thoda challenging ho sakta hai, lekin jab sahi se identify kiya jaye, toh ye kaafi reliable signal de sakta hai.
**2. Pattern Formation:**
Hikkake Pattern ki formation kuch specific steps par based hoti hai:
- **Inside Bar:** Pehli do candles ek inside bar pattern banati hain, jahan doosri candle pehli candle ke range ke andar hoti hai.
- **False Breakout:** Teesri candle inside bar pattern ko break karti hai, lekin ye breakout false hota hai aur price wapas inside bar range ke andar aata hai.
- **Confirmation Candle:** Agli candle false breakout ke direction ke against close hoti hai, jo pattern ko confirm karti hai.
**3. Types of Hikkake Patterns:**
Hikkake Pattern do types ka hota hai: bullish aur bearish.
- **Bullish Hikkake:** Ye pattern downtrend ke baad form hota hai aur price reversal ka indication deta hai. Isme pehli inside bar ke baad false bearish breakout hota hai, aur confirmation candle bullish hoti hai.
- **Bearish Hikkake:** Ye pattern uptrend ke baad form hota hai aur price reversal ka indication deta hai. Isme pehli inside bar ke baad false bullish breakout hota hai, aur confirmation candle bearish hoti hai.
**4. Importance of Hikkake Pattern:**
Hikkake Pattern forex traders ke liye bohot valuable hai kyun ke ye false breakouts ko identify karne mein madad karta hai. Ye pattern price action aur market psychology ko samajhne mein bhi madadgar hota hai. Hikkake pattern identify karne se traders false signals se bach sakte hain aur more accurate trades place kar sakte hain.
**5. How to Trade the Hikkake Pattern:**
Hikkake Pattern ko trade karne ke liye aapko confirmation candle ka wait karna chahiye. Jab confirmation candle form ho jaye, tabhi aap trade enter karein. Bullish Hikkake pattern mein long position enter karein aur stop-loss inside bar ke low ke neeche place karein. Bearish Hikkake pattern mein short position enter karein aur stop-loss inside bar ke high ke upar place karein. Profit target recent support aur resistance levels par set karein.
**Conclusion:**
Hikkake Candlestick Pattern ek intricate aur effective trading tool hai jo forex market mein price reversals aur continuations ko identify karne mein madad karta hai. Is pattern ko samajhne aur sahi tarike se use karne se aap false breakouts se bach sakte hain aur apni trading accuracy ko improve kar sakte hain. Trading mein patience aur proper analysis se kaam lena bohot zaroori hai, aur Hikkake pattern isme aapko bohot madad de sakta hai.
اب آن لائن
Working...
تبصرہ
Расширенный режим Обычный режим