Balance Volume Indicator in Forex
-
SkydiversSenior Member
- Mar 2023
- 882
- 238
- 362
- 333 USD
InstaSpot: کسی بھی EPS اور بینک سے منافع واپس لیں، اور EPS اور cryptocurrencies کے تبادلے پر 7% تک کمائیں۔
Believe in yourself and your abilities. When you fight for your dreams, you can achieve anything.
-
<a href="https://www.instaforex.org/ru/?x=ruforum">InstaForex</a> -
SkydiversSenior Member
- Mar 2023
- 882
- 238
- 362
- 333 USD
Volume Indicator forex trading mein aik ahem tool hai jo market ki gatividhiyon aur mogheem ke kisam ko samajhne mein madadgar hota hai. Mukhtalif volume indicators mein se aik aham indicator On-Balance Volume (OBV) Indicator hai, jo ke apne unikie tareeqay se keemat ke irtiqaa ko anjaam dene mein madadgar hota hai. Origins and Basics 1960 mein tayyar hui On-Balance Volume Indicator ka asal usool yeh hai ke volume qeemat ke manzil se pesh-e-nazar hai. Joseph Granville ke dawedar, volume ikhtiarati khareedari aur farokhtari ke faaliatein daryaft karne mein ehmiyat rakhta hai, aur in faaliyat ko janchne se traders ke liye qeemat rehnumai faraham ho sakti hai. Is liye, OBV Indicator, is par mustamil hone wale volume flow par tawajju deta hai, is par zor dete hue ke volume kisi khaas currency pair mein dakhil ho raha hai ya kharij ho raha hai. Calculation Method On-Balance Volume Indicator ka hisaab karne ka tareeqa kaafi asaan hai. Is ki bunyad par, OBV ek musallas mustahiq volume hai jo musbat aur manfi volume par mabni hota hai. Is ko hisaab karne ka tareeqa is tarah hai.
- Ibtida mein ek shuruati OBV qeemat se shuru hota hai: Yeh zero ya pichle din ki band hone wali qeemat ho sakti hai.
- Agar band hone wali qeemat pehle din ki band hone wali qeemat se zyada hai, to us din ka volume OBV mein shamil ho jata hai.
- Agar band hone wali qeemat kam hai, to us din ka volume OBV se minus kar diya jata hai.
- Agar band hone wali qeemat wahi rehti hai, to OBV wahi rehta hai.
- Rising OBV: Jab OBV mein izafa hota hai, yeh ishara karti hai ke khareedari volume farokhtari volume ko peechay chor raha hai. Is barhne wale momentum nehayat ummidwar trend ki taraf ishara kar sakta hai, jo ke bullish trend ka soorat-e-haal hosakti hai.
- Falling OBV: Mutabiq, girte hue OBV yeh ishara karti hai ke farokhtari volume khareedari volume ko peechay chor raha hai. Ye naye farahmi mein izafa hone se market mein barhne wali supply ka ishara karti hai, jo ke bearish trend ka soorat-e-haal hosakti hai.
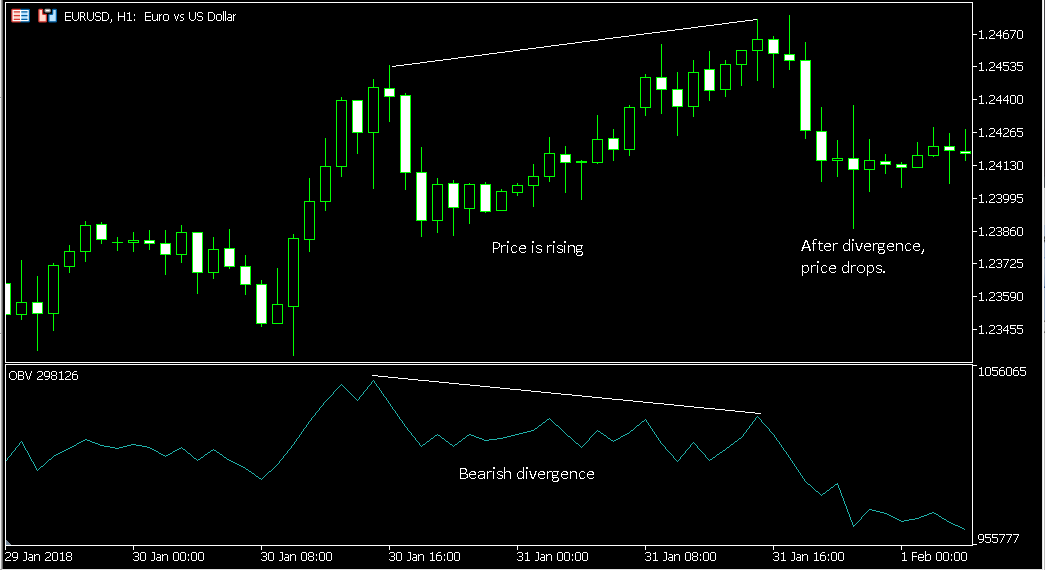
- Divergence: OBV mein ibtidaat woh waqt hoti hai jab OBV aur qeemat ki harkatein ek doosre se mukhtalif hoti hain. Jaise agar qeemat barh rahi hai jab ke OBV gir raha hai, to yeh trend mein kamzori ko ishara karti hai, jo ke mumkin hai ke aane wale waqt mein palat jane ka ishara kare.
Practical Applications On-Balance Volume Indicator forex trading strategies mein mukhtalif amli istemal kiye jate hain.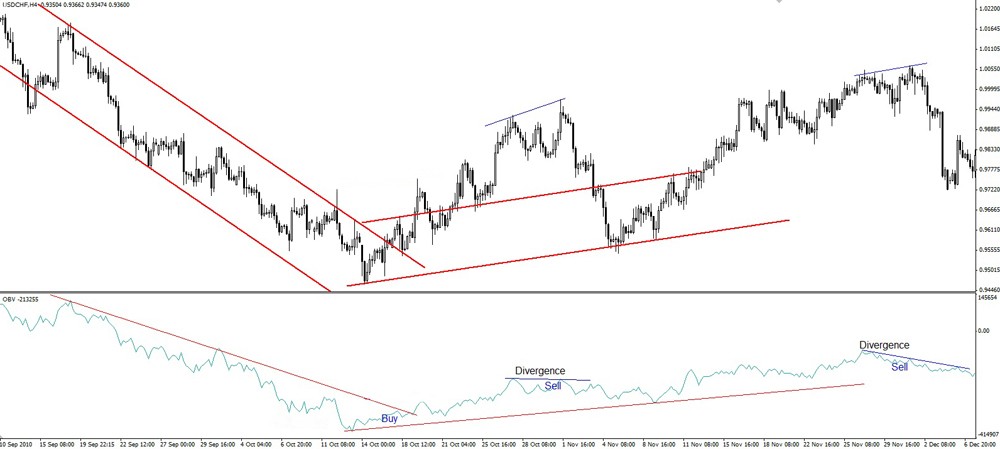
- Confirmation of Trends: OBV mojuday trendon ki tasdeeq ke liye istemal kiya ja sakta hai. Agar OBV qeemat ke trend ke mutabiq hai, to yeh mojuday market ke manzil mein itminan barhata hai.
- Identifying Reversals: OBV ibtidaat mein istemal hoti hai, jahan indicator qeemat ke mutabiq na ho. Traders aksar isharaat ke liye in ibtidaat ki talash mein hote hain ke trend ki palat jane ki mumkin soorat-e-haal batata hai.
- Volume Breakouts: OBV mein achanak izafa yeh ishara karti hai ke mazbooti se khareedari ya farokhtari mein izafa ho raha hai. OBV ke breakouts ko istemal kiya ja sakta hai ke potential dakhilay ya nikalne ke points ke liye, khaas kar jab qeemat ke sath breakouts ke saath ho.
- Support and Resistance Levels: OBV woh ahem support aur resistance levels ko pata karne mein madadgar sabit ho sakti hai. Agar OBV mein istemari tarah se izafa ho raha hai jab ke qeematain mustaqil hain, to yeh ishara karti hai ke khareedari mein izafa ho raha hai aur ishara karta hai ke aane wale waqt mein qeemat ka breakout resistance level ke upar ho sakta hai.
 Believe in yourself and your abilities. When you fight for your dreams, you can achieve anything.
 -
<a href="https://www.instaforex.org/ru/?x=ruforum">InstaForex</a> -
Riaz HussainSenior Member
- Mar 2020
- 714
- 790
- 1128
- 973 USD
InstaSpot: کسی بھی EPS اور بینک سے منافع واپس لیں، اور EPS اور cryptocurrencies کے تبادلے پر 7% تک کمائیں۔
Balance Volume Indicator:
Balance Volume (BV) indicator ek volume-based technical indicator hai jo price movement aur volume ke beech ki relationship ko track karta hai. Is indicator mein, volume ko positive aur negative values mein represent kiya jata hai, jisse price ke upar aur neeche ke movement ke saath corresponding volume changes ko dekhne mein madad milti hai. BV indicator traders ko price trends aur potential reversals ko samajhne mein madad karta hai. Is indicator ka istamal karke traders volume analysis aur price action ko combine karke trading decisions lete hain.
Trading with Balance volume:
Balance Volume (BV) indicator ke sath trading karne ke liye, aapko BV indicator ke signals aur price action ko combine karna hoga. Yahan kuch steps hain jo aap follow kar sakte hain:
1. BV aur price movement ka correlation:
BV indicator ko price movement ke saath compare karein. Agar price upar ja raha hai aur BV bhi positive hai, toh ye bullish signal ho sakta hai. Agar price neeche ja raha hai aur BV bhi negative hai, toh ye bearish signal ho sakta hai.
2. Divergence ki talaash karein:
Price movement aur BV ke beech divergence dhoondein. Agar price upar ja raha hai lekin BV down ja raha hai, ya fir price neeche ja raha hai lekin BV up ja raha hai, toh ye reversal ki possibility indicate kar sakta hai.
3. Support aur resistance levels ka istemal karein:
BV indicator ko support aur resistance levels ke saath combine karein. Agar BV indicator kisi strong support ya resistance level ke paas bounce kar raha hai, toh ye price reversal ka indication ho sakta hai.
4. Stop loss aur target levels set karein:
Har trade mein stop loss aur target levels ko set karna zaroori hai. BV indicator ke signals ke saath apne trading strategy ko align karein aur risk management ka dhyan rakhein. Lekin yaad rakhein, BV indicator ek tool hai aur isko confirm karne ke liye dusre technical indicators aur price analysis ka istemal karna zaroori hai. Apne trading strategy ko test karne ke liye demo account ka istemal karein aur hamesha risk management ka dhyan rakhein.
Working...
تبصرہ
Расширенный режим Обычный режим