What is Tweezer Bottom Candlestick Pattern..?
-
Doa84Senior Member

- Dec 2022
- 578
- 18
- 124 USD
-
<a href="https://www.instaforex.org/ru/?x=ruforum">InstaForex</a> -
Doa84Senior Member
- Dec 2022
- 578
- 18
- 124 USD
Introduction Tweezer Bottom Candlestick Pattern ek ahem forex trading candlestick pattern hai jo price movements aur trend reversals ko samajhne mein madadgar hota hai. 2. Candlestick Patterns Candlestick patterns trading mein price aur market sentiment ko samajhne ke liye istemal hoti hain. Ye patterns candles ki shapes aur unke arrangements ko darust karti hain. 3. Tweezer Bottom Candlestick Pattern Tweezer Bottom aik bullish reversal candlestick pattern hai. Is pattern mein do ya zyada candles ki shakal aik doosre se milti hai, jis se yeh pattern ban jata hai. Tweezer Bottom Pattern ek do-candle pattern hai, jismein do consecutive candles shamil hoti hain. Pehli candle bearish (girawat wali) hoti hai aur doosri candle bullish (barhne wali) hoti hai. Dono candles ki low prices barabar hoti hain aur ye ek saath aati hain, jaise ek pair of tweezers (chimta). 4. Interpretation Tweezer Bottom Candlestick Pattern ko samajhna trading mein ahem hota hai. Is pattern ki samajh se traders market mein bullish reversal ya trend change ko anticipate kar sakte hain. Bearish candle ko dekh kar initial selling pressure aur downtrend indicate hota hai. Bullish candle jo usse follow karti hai, woh buyers ki aagahi aur control ko darust karti hai. 5. Trading Strategies Tweezer Bottom Candlestick Pattern se judi trading strategies mein shaamil hain: Entry Point: Agar tweezer bottom pattern bearish trend ke baad aata hai, to ye bullish reversal ki possibility dikhata hai. Traders is point par long position le sakte hain. Stop Loss aur Take Profit: Har trade mein stop loss aur take profit levels ko set karna zaroori hai, taki nuksan se bacha ja sake. 6. Tweezer Bottom Uses Agar aap forex trading mein Tweezer Bottom pattern ko dekh rahe hain to iska matlab hai ke market bullish trend mein hai aur ab market bearish trend mein jane wala hai. Is pattern ko dekh kar aap sell position close kar sakte hain aur buy position open kar sakte hain. 7. Conclusion Tweezer Bottom Candlestick Pattern forex trading mein ek ahem tool hai jo price movements ko samajhne mein madadgar hota hai. Lekin, candlestick patterns ko sahi tarah se interpret karna aur trading decisions lene ke liye practice aur research ki zarurat hoti hai. -
jabbarchohanSenior Member
- May 2023
- 516
- 304
- 390
- 165 USD
InstaSpot: کسی بھی EPS اور بینک سے منافع واپس لیں، اور EPS اور cryptocurrencies کے تبادلے پر 7% تک کمائیں۔
<<Tweezer Bottom Candlestick Pattern>>
Tweezer Bottom ek bullish reversal candlestick pattern hai jo ke market ke downtrend ke end par hota hai.
Tweezer Bottom pattern ka matlub hai ke jab market ek downtrend mein hota hai, yani ke prices neeche ki taraf ja rahe hain, to Tweezer Bottom pattern ka appearance ek possible trend reversal ko darust kar sakta hai.
Jab ye pattern dikhta hai, to ye indicate karta hai ke pehle sellers ne control kiya hua tha, lekin ab buyers aa rahe hain aur market mein dobara control hasil kar rahe hain. Pehla bearish candle indicate karta hai ke sellers abhi bhi strong hain, lekin dusra bullish candle ye dikhata hai ke buyers ne defend kiya aur market mein aik muddat tak control hasil kar liya hai.
Traders is pattern ko dekhte hain taake woh predict kar sakein ke market mein trend reversal hone ke chances hain aur woh position lein ya close karein. Hamesha yaad rahe ke kisi bhi trading decision se pehle market ki overall conditions aur doosre indicators ka bhi moolyaankan karna zaroori hai.
<<Tweezer Bottom Candlestick Pattern Ki Khasiyat>>- Pehla Candlestick:
- Pehla candlestick ek bearish (neechay ki taraf) candle hota hai jo ke mojooda downtrend ko darust karti hai.
- Iski body (open aur close prices ke darmiyan farq) ko zor daar banana chahiye aur iski aik lambi lower shadow honi chahiye.
- Dusra Candlestick:
- Dusra candlestick ek bullish (ooper ki taraf) candle hota hai.
- Ye candle pehle candle ke low ya uske qareeb open hoti hai.
- Iski body pehle candle se mukhtalif nahi ya thori si choti honi chahiye.
- Iska ahem pehlu ye hai ke iski lower shadow lambi hoti hai aur pehle candle ke low se neeche tak extend hoti hai, jahan market ne test kiya tha lekin wahan se neeche nahi gayi.
Tweezer Bottom ye suggest karta hai ke downtrend ka mawafiq ulat jaa sakta hai, isey samajh aata hai ke bear (sellers) apna control kho rahe hain aur buyers (khareedne wale) daakhil ho rahe hain. -
Asim14Senior Member
- Sep 2023
- 780
- 25
- 184
- 326 USD
What is tweezer bottom candlestick pattern..?
Tweezer Bottom ek candlestick pattern hai, jo technical analysis mein istemal hota hai, especially stock market aur forex market mein. Ye pattern market mein trend reversal ko indicate karne ke liye istemal hota hai. Tweezer Bottom ek bullish reversal pattern hai, matlab ki jab ye pattern form hota hai, to market mein bearish trend ko follow karne ke badle bullish trend hone ke chances hote hain.
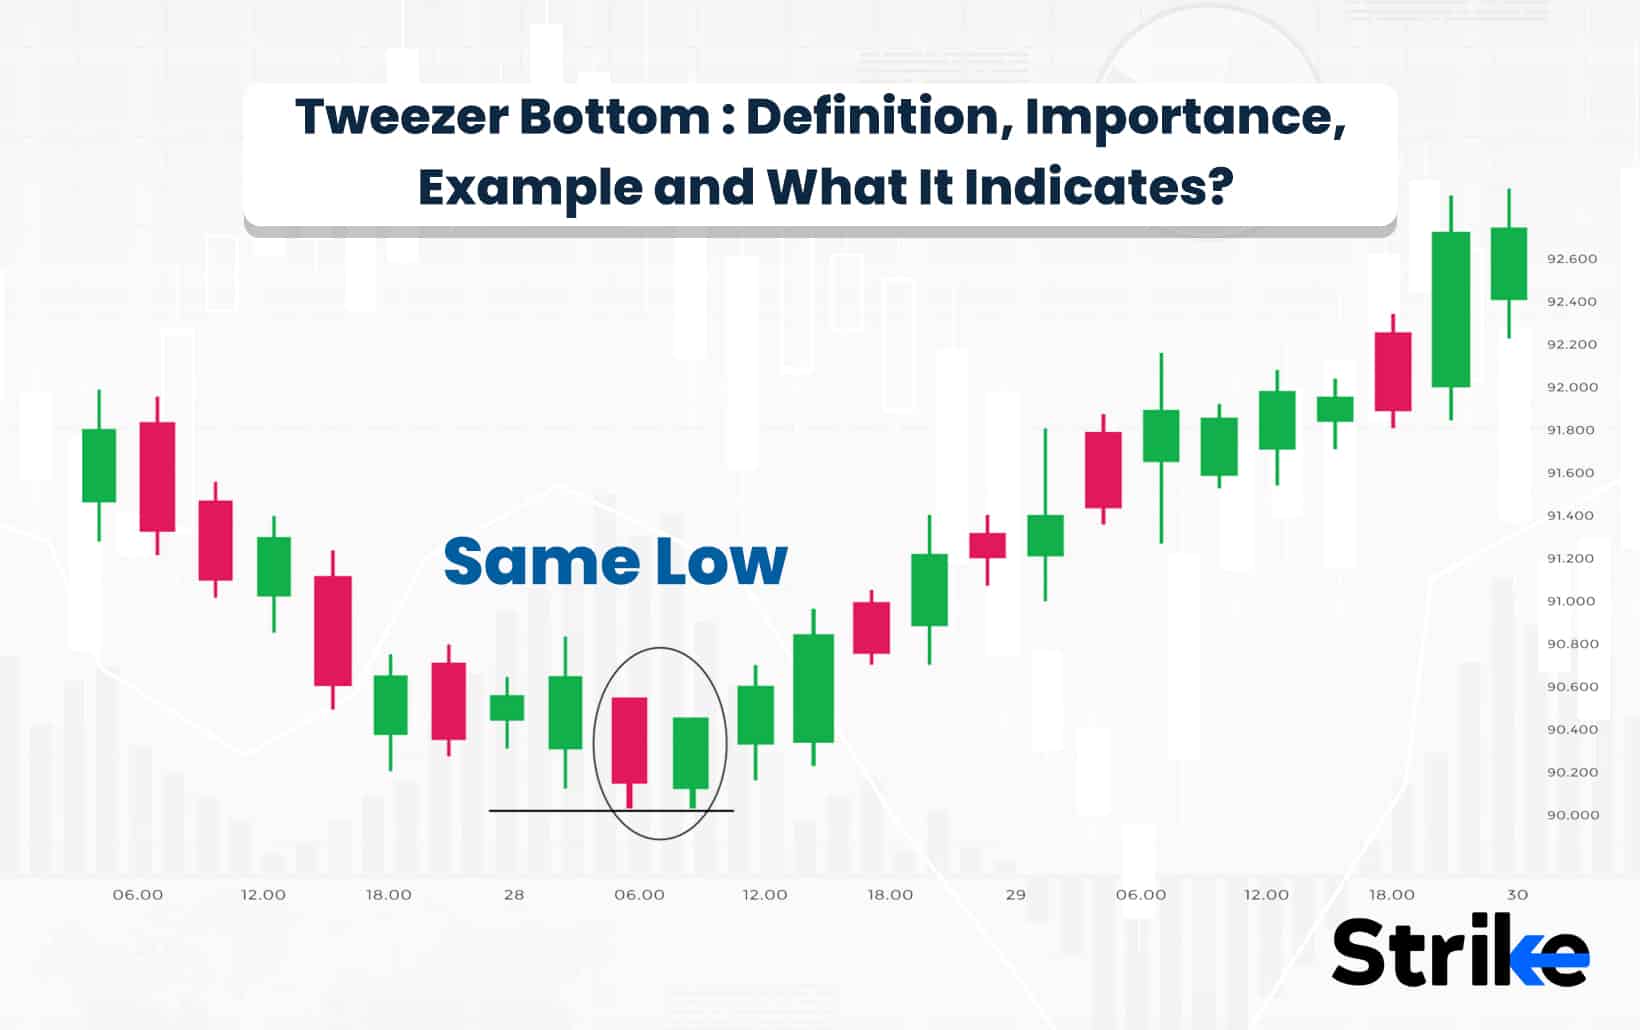
Is pattern mein, do consecutive candles hote hain jismein lower shadows (yaani ki candle ke neeche ki choti lines) ek doosre ke bahut kareeb hoti hain. Ye do candles ek saath form hokar ek level pe close karte hain. Jab ye tweezer bottom pattern form hota hai, toh ye ek potential trend reversal signal provide karta hai.
Tweezer Bottom candlestick pattern ki key characteristics hain:- Do Consecutive Candles: Ye pattern do consecutive candles se form hota hai - ek bearish candle (downward movement) aur ek bullish candle (upward movement).
- Lower Shadows: Dono candles ki lower shadows nearly equal hoti hain aur neeche ki taraf extend hoti hain, jisse ek saath aane wali buying interest ko indicate karein.
- Close at the Same Level: Dono candles ek dusre ke bahut kareeb close hote hain, ideally same level pe.
Tweezer Bottom pattern ka interpretation hota hai ki jab market ek downtrend ke baad hai aur ye pattern form hota hai, toh ye indicate karta hai ki selling pressure kam ho rahi hai aur buying interest badh rahi hai. Traders ise ek potential trend reversal signal samajh kar bullish positions le sakte hain.
Hamesha yaad rakhein ki kisi bhi candlestick pattern ka istemal karne se pehle, dusre technical indicators aur market conditions ko bhi consider karna important hai, aur risk management ko bhi dhyan mein rakhna chahiye. Candlestick patterns ke istemal mein practice aur experience ka hona bhi mahatvapurna hai.
-
Raza512Senior Member
- Nov 2023
- 673
- 218
- 1164
- 491 USD
What is Tweezer Bottom Candlestick Pattern
"Tweezer Bottom" candlestick pattern ek technical analysis concept hai jo ke financial markets, jaise ke stocks, commodities, ya currencies, me use hota hai. Ye pattern price chart par dikhne wale candlesticks ki arrangement par focus karta hai.
Tweezer Bottom pattern typically market ke downtrend ke baad aata hai aur ye bullish reversal ko indicate karta hai. Is pattern mein do consecutive candlesticks hote hain, jo ke neeche diye gaye hote hain:
First Candlestick (Bearish): Ye downtrend ke dauran aane wala candlestick hota hai jo market mein selling pressure ko represent karta hai. Is candlestick ka closing price neeche hota hai.
Second Candlestick (Bullish): Ye candlestick first candlestick ke just neeche open hota hai, lekin throughout the trading session, price mein recovery hoti hai aur candlestick ka closing price higher hota hai. Isse ye indicate hota hai ke market sentiment me change aaya hai aur buyers ne control lena shuru kar diya hai.
Tweezer Bottom pattern ka naam isliye hai kyunki ye candlesticks ki arrangement ki wajah se tweezer ya chhanty ki tarah dikhta hai, jisme dono ends barabar hote hain.
Ye pattern ek potential trend reversal ko suggest karta hai, lekin market dynamics hamesha change ho sakte hain, aur is pattern ko confirm karna ke liye doosre technical indicators ka bhi istemal karna important hai.
Note: Stock market aur trading mein involved hona financial risk ke saath aata hai, isliye aapko apne financial advisor ki salah leni chahiye aur market analysis ke liye multiple tools ka istemal karna chahiye.
Is pattern ko traders use karte hain takey woh market trend ka pata lagakar apne trading decisions better taur par le sakein. Tweezer Bottom ek bullish reversal signal ho sakta hai, jo indicate karta hai ke bearish trend ke baad ab market mein buying interest badh rahi hai. Lekin hamesha yaad rahe ke kisi bhi trading decision se pehle, aapko aurat information ka achha analysis karna chahiye aur market conditions ko dhyan mein rakhna zaroori hai.
-
SalamPakistanSenior Member
- Nov 2023
- 913
- 38
- 539
- 717 USD
InstaSpot: کسی بھی EPS اور بینک سے منافع واپس لیں، اور EPS اور cryptocurrencies کے تبادلے پر 7% تک کمائیں۔
Tweezer Bottom ek candlestick pattern hai jo market analysis mein istemal hota hai. Yeh pattern market ke reversal ko indicate karta hai. Is pattern mein do consecutive candles hote hain, jinmein pehli candle bearish hoti hai, aur dusri candle bullish hoti hai.
Pehli candle mein price down jati hai, lekin dusri candle mein price upar chali jati hai, jisse ek bottom formation hoti hai. Yeh pattern traders ko indicate karta hai ke market mein selling pressure ke baad buying pressure aa rahi hai, aur trend reversal hone ke chances hote hain.
Tweezer Bottom ka interpretation market conditions par depend karta hai. Agar yeh pattern strong support level ya trend line ke paas develop hota hai, toh yeh more reliable hota hai. Traders is pattern ko dekh kar apne trading decisions ko refine karte hain.
Is pattern ko recognize karne ke liye, traders ko candles ki high, low, opening, aur closing prices par dhyan dena hota hai. Agar do candles ke bottoms approximately ek hi level par hote hain, toh yeh Tweezer Bottom pattern ko confirm karta hai.
Traders is pattern ka istemal karke apne stop loss aur take profit levels ko set karte hain. Yeh pattern short-term ya long-term trading strategies mein incorporate kiya ja sakta hai, lekin risk management ka bhi dhyan rakhna important hai.
Is pattern ki validity ko confirm karne ke liye, traders ko doosre technical indicators aur market analysis tools ka bhi istemal karna chahiye. Tweezer Bottom pattern ek tool hai, lekin isey isolated form mein dekh kar trading decisions na lena advisable hai
In conclusion, Tweezer Bottom candlestick pattern market mein trend reversal ko suggest karta hai. Traders ko is pattern ko recognize karke apni trading strategies ko enhance karne mein madad milti hai. Lekin, hamesha market analysis ko comprehensive taur par karna important hai trading decisions ke liye
-
<a href="https://www.instaforex.org/ru/?x=ruforum">InstaForex</a> -
5SRZSenior Member
- Jan 2024
- 559
- 213
- 199
- 193 USD
Tweezer Bottom Candlestick Pattern kia hai
Tweezer Bottom, candlestick chart analysis mein ek reversal pattern hai jo market ke bottom ya downtrend ke end ko indicate karta hai. Is pattern mein do consecutive candles hote hain jinke low prices nearly equal hote hain, aur yeh ek potential trend reversal ko suggest karte hain.
Tweezer Bottom Candlestick Pattern ki Key Characteristics:- Two Consecutive Candles:
- Tweezer Bottom pattern mein do back-to-back candles hote hain: ek bearish candle aur ek bullish candle.
- Equal or Nearly Equal Lows:
- Dono candles ke low prices nearly equal hote hain, indicating that sellers tried to push the price lower, but the bulls stepped in, preventing further decline.
- Long Lower Shadows:
- Both candles have long lower shadows, which represent the unsuccessful attempt by sellers to maintain control. The long lower shadows indicate strong buying pressure at the lower levels.
- Upper Shadows:
- Upper shadows of the candles may vary, but they are generally shorter than the lower shadows. The upper shadows represent the high prices during the respective candle periods.
- Volume Confirmation:
- Traders often look for volume confirmation when identifying Tweezer Bottom patterns. An increase in volume during the bullish candle can validate the pattern.
Tweezer Bottom Candlestick Pattern Trading Strategy:
Tweezer Bottom pattern ko identify karne ke baad, traders iske basis par apni trading strategy banate hain:- Confirmation:
- Traders wait for confirmation before making trading decisions. This can include waiting for the next candle to close higher or looking for additional technical indicators to support the reversal.
- Entry and Stop-Loss:
- Agar confirmation mil gaya hai, to traders long positions le sakte hain. Stop-loss order ko thoda sa neeche, ideally pattern ke low prices ke neeche, set kiya ja sakta hai.
- Target:
- Target price ko set karne ke liye traders previous swing highs ya resistance levels ko consider karte hain.
- Risk-Reward Ratio:
- Risk-reward ratio ko dhyan mein rakhte hue traders apne stop-loss aur target prices set karte hain.
Caution:- Har pattern ki tarah, Tweezer Bottom bhi 100% accurate nahi hota, aur is par pura bharosa karke hi trading decisions nahi lena chahiye. Always use additional technical analysis tools and risk management strategies for comprehensive trading decisions.
Working...
تبصرہ
Расширенный режим Обычный режим