What's the Bearish kicking pattern
Barish kicking patteren aik do mom batii wala candlestick patteren hai jo aik up trained mein taiz raftaar Reversal ki nishandahi karta hai. is mein do mom batian shaamil hoti hain, pehli aik lambi safaid ya sabz mom batii hai, aur doosri aik lambi siyah ya surkh mom batii hai jo pichlle din ke oonchai se oopar khulti hai aur pichlle din ke kam se kam se neechay band hoti hai .
Barish kicking patteren ki khususiyaat
pehli mom batii aik lambi safaid ya sabz mom batii hai, jisayMarbozo bhi kaha jata hai .

doosri candlestick
doosri mom batii aik lambi siyah ya surkh mom batii hai, jisayMarbozo bhi kaha jata hai .
doosri mom batii pehlay din ke oonchai se oopar khulti hai .
doosri mom batii pehlay din ke kam se kam se neechay band hoti hai .
Barish kicking patteren kya batata hai
Barish kicking patteren market ke rujhan mein achanak tabdeeli ki nishandahi karta hai, jis mein reechh control letay hain aur qeemat ko neechay dhkilte hain. yeh patteren is waqt hota hai jab aik lambi blush mom batii ke baad aik lambi Bearish mom batii aati hai jo pichlle din ke oonchai se oopar khulti hai aur pichlle din ke kam se kam se neechay band hoti hai. tajir aksar is patteren ko aik mazboot Bearish signal ke tor par tashreeh karte hain aur usay lambi pozishnon se niklny ya mukhtasir pozishnon mein daakhil honay ke liye sale signal ke tor par istemaal kar satke hain .
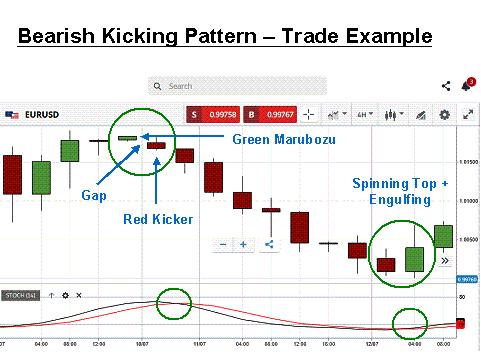
Barish kicking patteren ki misaal
darj zail chart aik Barish kicking patteren ki misaal dekhata hai .
chart mein, pehli
chart mein, pehli mom batii aik lambi safaid mom batii hai jo up trained ka hissa hai. doosri mom batii aik lambi siyah mom batii hai jo pehlay din ke oonchai se oopar khulti hai aur pichlle din ke kam se kam se neechay band hoti hai. yeh Barish kicking patteren market ke rujhan mein achanak tabdeeli ki nishandahi karta hai, jis mein reechh control letay hain aur qeemat ko neechay dhkilte hain .
Barish kickingpatteren ki qabil Reliability
Barish kicking patteren ki qabil Reliability aala hai jab yeh up trained ya Overboot ilaqay mein bantaa hai. taham, yeh note karna zaroori hai ke koi bhi kicking candlestick patteren 100 % durust nahi hai, aur deegar awamil ko bhi mad e nazar rakha jana chahiye jab tijarti faislay kiye jayen .
Barish kicking patteren ka istemaal karte waqt ghhor karne ke liye kuch izafi nakaat
patteren ki tasdeeq ke liye, doosri mom batii ko mazboot Bearish mom batii honi chahiye .
patteren ki qabil Reliability ko badhaane ke liye, usay hajam mein izafay ke sath hona chahiye .
patteren ka istemaal karte waqt, deegar takneeki isharay aur bunyadi awamil par bhi ghhor karna chahiye .
nateeja
Barish kicking patteren aik taaqatwar takneeki ishara hai jo market ke rujhan mein achanak tabdeeli ki nishandahi kar sakta hai. taham, yeh note karna zaroori hai ke koi bhi candlestick patteren 100 % durust nahi hai, aur deegar awamil ko bhi mad e nazar rakha jana chahiye jab tijarti faislay kiye jayen .
Barish kicking patteren aik do mom batii wala candlestick patteren hai jo aik up trained mein taiz raftaar Reversal ki nishandahi karta hai. is mein do mom batian shaamil hoti hain, pehli aik lambi safaid ya sabz mom batii hai, aur doosri aik lambi siyah ya surkh mom batii hai jo pichlle din ke oonchai se oopar khulti hai aur pichlle din ke kam se kam se neechay band hoti hai .
Barish kicking patteren ki khususiyaat
pehli mom batii aik lambi safaid ya sabz mom batii hai, jisayMarbozo bhi kaha jata hai .
doosri candlestick
doosri mom batii aik lambi siyah ya surkh mom batii hai, jisayMarbozo bhi kaha jata hai .
doosri mom batii pehlay din ke oonchai se oopar khulti hai .
doosri mom batii pehlay din ke kam se kam se neechay band hoti hai .
Barish kicking patteren kya batata hai
Barish kicking patteren market ke rujhan mein achanak tabdeeli ki nishandahi karta hai, jis mein reechh control letay hain aur qeemat ko neechay dhkilte hain. yeh patteren is waqt hota hai jab aik lambi blush mom batii ke baad aik lambi Bearish mom batii aati hai jo pichlle din ke oonchai se oopar khulti hai aur pichlle din ke kam se kam se neechay band hoti hai. tajir aksar is patteren ko aik mazboot Bearish signal ke tor par tashreeh karte hain aur usay lambi pozishnon se niklny ya mukhtasir pozishnon mein daakhil honay ke liye sale signal ke tor par istemaal kar satke hain .
Barish kicking patteren ki misaal
darj zail chart aik Barish kicking patteren ki misaal dekhata hai .
chart mein, pehli
chart mein, pehli mom batii aik lambi safaid mom batii hai jo up trained ka hissa hai. doosri mom batii aik lambi siyah mom batii hai jo pehlay din ke oonchai se oopar khulti hai aur pichlle din ke kam se kam se neechay band hoti hai. yeh Barish kicking patteren market ke rujhan mein achanak tabdeeli ki nishandahi karta hai, jis mein reechh control letay hain aur qeemat ko neechay dhkilte hain .
Barish kickingpatteren ki qabil Reliability
Barish kicking patteren ki qabil Reliability aala hai jab yeh up trained ya Overboot ilaqay mein bantaa hai. taham, yeh note karna zaroori hai ke koi bhi kicking candlestick patteren 100 % durust nahi hai, aur deegar awamil ko bhi mad e nazar rakha jana chahiye jab tijarti faislay kiye jayen .
Barish kicking patteren ka istemaal karte waqt ghhor karne ke liye kuch izafi nakaat
patteren ki tasdeeq ke liye, doosri mom batii ko mazboot Bearish mom batii honi chahiye .
patteren ki qabil Reliability ko badhaane ke liye, usay hajam mein izafay ke sath hona chahiye .
patteren ka istemaal karte waqt, deegar takneeki isharay aur bunyadi awamil par bhi ghhor karna chahiye .
nateeja
Barish kicking patteren aik taaqatwar takneeki ishara hai jo market ke rujhan mein achanak tabdeeli ki nishandahi kar sakta hai. taham, yeh note karna zaroori hai ke koi bhi candlestick patteren 100 % durust nahi hai, aur deegar awamil ko bhi mad e nazar rakha jana chahiye jab tijarti faislay kiye jayen .
تبصرہ
Расширенный режим Обычный режим