Tweezer Bottom Candlestick Pattern.
-
chandiasahabSenior Member

- Feb 2022
- 218
- 167
- 117
- 178 USD
-
<a href="https://www.instaforex.org/ru/?x=ruforum">InstaForex</a> -
chandiasahabSenior Member
- Feb 2022
- 218
- 167
- 117
- 178 USD
Tweezer Bottom Candlestick Pattern, ek technical analysis tool hai jo candlestick charts par dekha jata hai. Is pattern ko traders aur investors market direction aur trend reversal ke liye use karte hain. Yeh pattern bearish trend ke end ya reversal ko indicate karta hai. Tweezer Bottom Candlestick Pattern, Tweezer Bottom pattern mein, do consecutive candles hote hain jo similar lows par close karte hain. Pehla candlestick bearish hota hai, jiske baad ek small body wala bullish candlestick aata hai. Dono candles ke lows same hote hain, jisse ek "tweezer bottom" shape ban jata hai.Is pattern ki wazahat karte hue, yeh important hai ke tweezer bottom pattern kaise dikhta hai aur uski interpretation kya hoti hai. Pehla candlestick bearish hota hai, jise downtrend indicate karta hai. Dusri candlestick small body wala bullish candlestick hota hai, jise trend reversal ya trend exhaustion indicate karta hai.Tweezer Bottom pattern mein, bearish sentiment ko indicate karne wala pehla candlestick ki range extend hoti hai. Iske baad, bullish sentiment ko indicate karne wala dusra candlestick ki range pehle wale candlestick se overlap karta hai. Dono candlesticks ke lows same hote hain, jisse tweezer bottom shape ban jata hai.Is pattern ka interpretation yeh hai ke market mein selling pressure kam ho rahi hai aur buying pressure badh rahi hai. Yeh bearish trend ke end ya reversal ko suggest karta hai. Agar tweezer bottom pattern strong support level ya trendline ke paas form hota hai, toh iska significance aur strong hota hai.Tweezer Bottom pattern ke breakout point bhi important hota hai. Breakout point jab price tweezer bottom pattern ke highs se bahar nikalta hai. Agar breakout bullish direction mein hota hai, toh yeh bullish signal hai aur further upside movement expect kiya ja sakta hai.Traders aur investors tweezer bottom pattern ka use karke entry aur exit points decide kar sakte hain. Agar pattern strong support level ke near form hota hai, toh traders buy positions le sakte hain. Stop loss levels aur target levels ko determine karke risk management bhi kiya ja sakta hai.Yeh thi Tweezer Bottom Candlestick Pattern ki wazahat hindi mein. Agar aapko aur kisi topic par sawal hai, toh aap pooch sakte hain. -
Abubakar006Member
- May 2022
- 66
- 4
- 10
- 47 USD
What is meant by Tweezer Bottom Candlestick Pattern? Assalam o alaikum!Dear my friends Tweezer Bottom candlestick pattern sy murad hy ky jab two candles pehli hamasha bearish aur dosri bullish banalay aur dono ka loss taqreban ya bilkul same ho. Isky mutabiq jahan per market close hui hy udhar sy he uper chali jati hy.Tweezer Bottom candlesticks pattern strong signal tab hoga jab ye bearish trend k bad banalay.Jab market apni low positions per jati hai or usk bad aik esi candlestick banti hai jahan per last candlestick close hui thi same usi jaga sa next candlestick bullish trend ki banti hai tu us point ko ap tweezer Bottom khety hain. Last bearish closing candlestick or next bullish candlestick ka point or shadows same point same hona chahiye. Isko tweezer Bottom candlestick pattern kaha jata hai. Benefits from Tweezer Bottom candlestick pattern: Dear forex members Tweezer Bottom candlesticks pattern ko pehchana bohot hi asan hota hai qk unki education aur learning bohot asan hai aur isko aap asani ke sath samajh sakte hain aur Iske bad Aap conformational candlestick ka Intezar karne ke baad forun trading kar sakte hain aur is sy bohot sare benefits hasil kar sakte hain. Apky question ka last step hai agar yah candlestick support and resistance level ke upar banti hai To phir is ki accuracy ho sakti hai to iske liye aapko sabse pahle support and resistance level ki calculation ka pata hona chahiye phir uske baad aap properly iski accuracy ko find out kar sakte hain aur aapko pata chal sakta hai yeh q is level ko touch kar sakti hai.tweezer bottom k foran bad ager hammer candlesticks pattern correctness ky signal ha. Is mein Buy ki trade lagein.Tweezer bottom candlestick pattern k baad candle Agar bullish Bane to agle candles mein apane trade entry bike leni hai aur in case of the tweezer top pattern ke a Jab Bhi tweezer top candle ki candle complete hone ke sath Agali candle complete ho to aap ny sell ki trade laga leni hai. -
maria123Senior Member
- Dec 2020
- 1080
- 1909
- 1267
- 617 USD
Tweezer Bottom Candlestick Pattern, ek bullish reversal pattern hai jo price chart par dikhai deta hai. Is pattern mein do consecutive candles hote hain, jahan ek candlestick bearish (downward movement) aur dusri candlestick bullish (upward movement) hoti hai, aur dono candles ke low price levels similar ya bahut paas hote hain. Tweezer Bottom pattern ki zaroorat ya ahmiyat yeh hai ki isse traders ko bullish trend reversal ko pehchanne aur entry points ko identify karne mein madad milti hai. Kuch ahem points is pattern ke bare mein hain: 1. Indication of Reversal: Tweezer Bottom pattern bearish trend ke baad bullish reversal ko indicate karta hai. Jab market mein downtrend ho raha hota hai aur Tweezer Bottom pattern develop hota hai, toh yeh ek potential trend reversal signal hai. 2. Support Level: Tweezer Bottom pattern ke low price levels similar ya bahut paas hote hain, jisse ek support level create hota hai. Jab price is support level se upar move karta hai, toh yeh bullish sentiment ko indicate karta hai. 3. Confirmation: Tweezer Bottom pattern ki validity aur effectiveness ke liye confirmation zaroori hai. Confirmation ke liye traders dusre technical indicators jaise ki volume analysis, trend lines, ya moving averages ka istemal karte hain. 4. Entry Points: Tweezer Bottom pattern ko dekh kar traders potential entry points ko pehchane mein madad milti hai. Jab price tweezer bottom pattern ke low level se upar move karta hai, toh traders long positions le sakte hain. Tweezer Bottom pattern ke alag variations hote hain, jaise ki bullish engulfing pattern, hammer pattern, ya doji pattern. In patterns ko samajhne aur pehchanne ke liye practice aur experience zaroori hai. -
nimuSenior Member
- Feb 2022
- 899
- 161
- 1141
- 500 USD
Tweezer Bottom candlestick pattern ek bullish reversal pattern hai, jo bearish trend ke baad hota hai. Is pattern mein do candlesticks hote hain. Pehli candlestick bearish (red) hoti hai aur dusri candlestick bullish (green) hoti hai.Bearish candlestick ka low aur bullish candlestick ka low lagbhag same hote hain, yaani ke dono ki bottoms ek dusre ke paas hote hain. Ye pattern bullish trend ke indication hote hain, jiska matlab hai ke price mein upward movement hone ki sambhavna hai.Jab ye pattern ban jata hai, toh traders ko buying ka signal milta hai. Ye pattern price reversal ke possibility ko darshata hai aur traders ko market mein long positions lena suggest karta hai. Tweezer Bottom candlestick pattern ki tafseel Tweezer Bottom candlestick pattern bearish trend ke baad hone wala ek bullish reversal pattern hai. Is pattern mein do candlesticks hote hain - ek bearish (red) aur dusri bullish (green).Bearish candlestick ka low aur bullish candlestick ka low lagbhag same hote hain. Yani ke dono candlesticks ki bottoms ek dusre ke paas hote hain. Isse pattern ki pehchan hoti hai.Jab bearish trend ke baad ye pattern ban jata hai, toh isse ek bullish trend ke shuru hone ki sambhavna hoti hai. Ye pattern price reversal ko indicate karta hai, jahan se price mein upward movement ki sambhavna hoti hai.Ye pattern traders ko buying ka signal deta hai. Jab ye pattern ban jata hai, tab traders ko market mein long positions lena suggest karta hai. Kyunki is pattern se ek bullish trend ki shuruwat hone ki sambhavna hoti hai. main batain Tweezer Bottom candlestick pattern ek bullish reversal pattern hai, jo bearish trend ke baad hota hai. Is pattern mein do candlesticks hote hain - ek bearish (red) aur ek bullish (green).Dono candlesticks ki bottoms lagbhag same hote hain, yani ke dono ki bottoms ek dusre ke paas hote hain. Ye pattern bullish trend ki taraf ishara karte hain, jiska matlab hai ke price mein upar ki taraf movement hone ki sambhavna hai.Jab ye pattern ban jata hai, toh traders ko buying ka signal milta hai. Ye pattern price reversal ki sambhavna ko dikhata hai aur traders ko market mein long positions lena suggest karta hai. -
Trading_EmpireMember
- Sep 2023
- 40
- 1
- 39
What Is Tweezer Bottom Candlestick Chart Pattern: Tweezer Base candle design ek bullish inversion design hai, jo negative pattern ke baad hota hai. Is design mein do candles hote hain - ek negative (red) aur ek bullish (green).Dono candles ki bottoms lagbhag same hote hain, yani ke dono ki bottoms ek dusre ke paas hote hain. Ye design bullish pattern ki taraf ishara karte hain, jiska matlab hai ke cost mein upar ki taraf development sharpen ki sambhavna hai.Jab ye design boycott jata hai, toh merchants ko purchasing ka signal milta hai. Ye design cost inversion ko dikhata hai aur dealers ko market mein long positions lena recommend karta hai.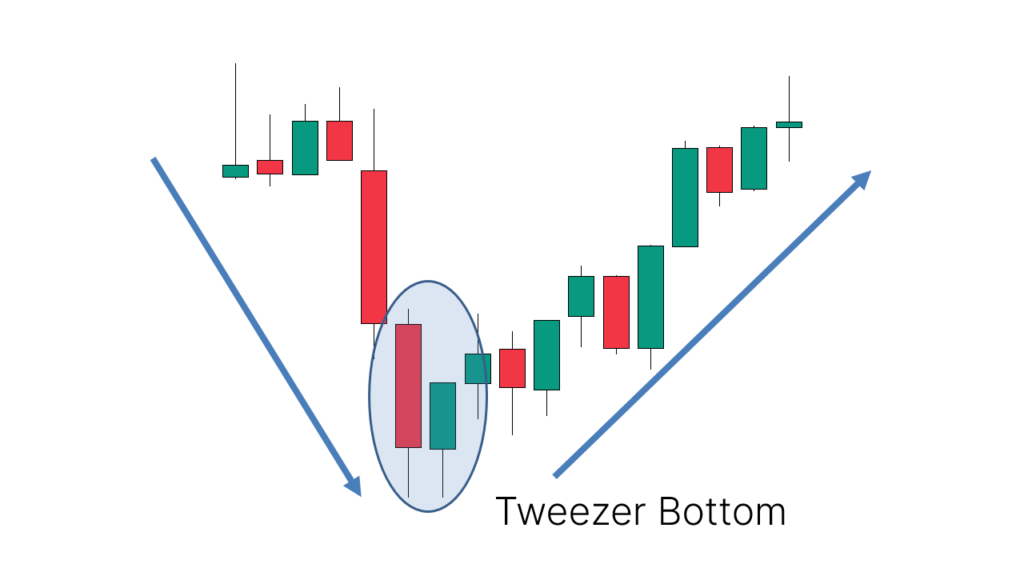 Tweezer Bottom candlestick pattern bearish trend ke baad hone wala ek bullish reversal pattern hai. Is pattern mein do candlesticks hote hain - ek bearish (red) aur dusri bullish (green).Bearish candlestick ka low aur bullish candlestick ka low lagbhag same hote hain. Yani ke dono candlesticks ki bottoms ek dusre ke paas hote hain. Isse pattern ki pehchan hoti hai.Jab bearish trend ke baad ye pattern ban jata hai, toh isse ek bullish trend ke shuru hone ki sambhavna hoti hai. Ye pattern price reversal ko indicate karta hai, jahan se price mein upward movement ki sambhavna hoti hai.Ye pattern traders ko buying ka signal deta hai. Jab ye pattern ban jata hai, tab traders ko market mein long positions lena suggest karta hai. Kyunki is pattern se ek bullish trend ki shuruwat hone ki hai. Types Of Tweezer Bottom Chart Pattern: Tweezer Base example ke low cost levels comparative ya bahut paas hote hain, jisse ek support level make hota hai. Hit cost is support level se upar move karta hai, toh yeh bullish feeling ko show karta hai. Tweezer Base example ki legitimacy aur adequacy ke liye affirmation zaroori hai. Affirmation ke liye merchants dusre specialized markers jaise ki volume examination, pattern lines, ya moving midpoints ka istemal karte hain.Tweezer Base example ko dekh kar brokers potential section focuses ko pehchane mein madad milti hai. Punch cost tweezer base example ke low level se upar move karta hai, toh brokers long positions le sakte hain.Tweezer Base example ke alag varieties hote hain, jaise ki bullish overwhelming example, hammer design, ya doji design. In designs ko samajhne aur pehchanne ke liye practice aur experience zaroori hai.
  Tweezer Base candles design ko pehchana bohot greetings asan hota hai qk unki instruction aur learning bohot asan hai aur isko aap asani ke sath samajh sakte hain aur Iske terrible Aap conformational candle ka Intezar karne ke baad forun exchanging kar sakte hain aur is sy bohot sare benefits hasil kar sakte hain. Apky question ka last step hai agar yah candle backing and obstruction level ke upar banti hai To phir is ki exactness ho sakti hai to iske liye aapko sabse pahle backing and opposition level ki computation ka pata hona chahiye phir uske baad aap appropriately iski precision ko find out kar sakte hain aur aapko pata chal sakta hai yeh q is level ko contact kar sakti hai.tweezer base k foran awful ager hammer candles design rightness ky signal ha. Formation Of Tweezer Bottom Candlestick Chart Pattern: Tweezer Base example mein, do sequential candles hote hain jo comparative lows standard close karte hain. Pehla candle negative hota hai, jiske baad ek little body wala bullish candle aata hai. Dono candles ke lows same hote hain, jisse ek "tweezer base" shape boycott jata hai.Is design ki wazahat karte shade, yeh significant hai ke tweezer base example kaise dikhta hai aur uski understanding kya hoti hai. Pehla candle negative hota hai, jise downtrend demonstrate karta hai. Dusri candle little body wala bullish candle hota hai, jise pattern inversion ya pattern weariness show karta hai.Tweezer Base example mein, negative feeling ko demonstrate karne wala pehla candle ki range broaden hoti hai. Iske baad, bullish feeling ko show karne wala dusra candle ki range pehle grain candle se cross-over karta hai.
  Dono candles ke lows same hote hain, jisse tweezer base shape boycott jata hai.Is design ka translation yeh hai ke market mein selling pressure kam ho rahi hai aur purchasing pressure badh rahi hai. Yeh negative pattern ke end ya inversion ko recommend karta hai. Agar tweezer base areas of strength for example level ya trendline ke paas structure hota hai, toh iska importance aur solid hota hai.Tweezer Base example ke breakout point bhi significant hota hai. Breakout point punch cost tweezer base example ke highs se bahar nikalta hai. Agar breakout bullish course mein hota hai, toh yeh bullish sign hai aur further potential gain development expect kiya ja sakta hai.Traders aur financial backers tweezer base example ka use karke passage aur leave focuses choose kar sakte hain. Agar design solid help level ke close to frame hota hai, toh merchants purchase positions le sakte hain. Tweezer Bottom Chart Pattern Trading: Design ko dekhte waqt, dealers iske signals ko samajhne ki koshish karte hain. Yadi downtrend ke baad ek Tweezer Base example structure hota hai, toh yeh ek potential bullish inversion signal ho sakta hai. Iska matlab ho sakta hai ke market pattern change sharpen wala hai aur costs upar ki taraf move karne ka prashna ho sakta hai. Brokers is signal ko affirm karne ke liye aur bhi specialized markers aur examination devices istemal karte hain. candle designs single markers nahi hote, aur ek greetings design se exchanging choices lene se bachein. Dusri specialized aur crucial investigation bhi zaroori hoti hai market ki sahi samajhne ke liye.note ke market mein exchanging karne se pehle, apko careful exploration karna chahiye aur agar conceivable ho toh ek monetary consultant ki salah bhi leni chahiye.
  Candle design ek specialized examination instrument hai jo ke monetary business sectors, jaise ke stocks, forex, aur products mein istemal hota hai. Is design ki madad se brokers aur financial backers market pattern aur potential inversions ko samajhne ki koshish karte hain."Tweezer Base" design do continuous (ek ke baad ek) candles se bana hota hai, jahan pe pehli candle (typically a negative flame) ek downtrend ke dauraan structure hoti hai aur doosri candle (normally a bullish light) uske baad structure hoti hai. Dono candles ka close cost comparable hota hai ya phir bohat qareeb hota hai.Pattern ki wazahat karne ke liye, principal steps specialty diye gaye hain Pehli candle downtrend mein structure hoti hai, matlab ke costs ne neeche jaane ki propensity dikhayi di hai. Dusra candle bhi downtrend mein structure hoti hai, lekin yeh pehli candle ki wick (upper shadow) ke qareeb ya usse contact karti hai, isse "tweezer base" design total hota hai. Dusra candle normally bullish hoti hai
-
muz5Senior Member
- Sep 2022
- 447
- 112
- 14
- 123 USD
Tweezer bottom candlestick pattern, bazaar mein istemaal hone wale ek prakar ke candlestick patterns hai. Is pattern ko dekh kar traders ko bearish trend ke reversal ki indication milti hai. Is pattern mein do candlesticks hote hain, jinhe tweezer bottom kehte hain. Tweezer bottom pattern ko samajhne ke liye, niche diye gaye steps follow karein: 1. Pehla candlestick: Pehla candlestick bearish (girawat ki taraf) hota hai, jiske bottom wick (tail) se price ne ek support level touch kiya hota hai. Is candlestick ke body ka size chota hota hai aur wick (tail) ka size bada hota hai. 2. Dusra candlestick: Dusra candlestick bullish (badhne ki taraf) hota hai aur pehle candlestick ke bottom wick (tail) ke neeche close hota hai. Is candlestick ke body ka size bada hota hai aur wick (tail) ka size chota hota hai. Tweezer bottom pattern ki wazahat kuch reasons se ahmiyat hoti hai: 1. Reversal signal: Tweezer bottom pattern bearish trend ke reversal ki indication deta hai. Pehli candlestick bearish trend ko represent karta hai, jabki dusri candlestick bullish trend ko represent karta hai. Yeh pattern indicate karta hai ki bearish pressure khatam ho gayi hai aur bullishtrend shuru hone wala hai. 2. Support level: Pehli candlestick ke bottom wick (tail) se price ne support level touch kiya hota hai. Jab dusri candlestick ke neeche close hota hai, toh ye support level ko confirm karta hai. Support level ko confirm karna traders ke liye important hota hai, kyunki yeh price ka reversal point ho sakta hai. 3. Entry and exit points: Tweezer bottom pattern traders ko entry aur exit points provide karta hai. Traders pehli candlestick ke bottom wick (tail) ke neeche buy positions le sakte hain, jisse unhe price ka reversal point ka benefit milta hai. Exit points ko traders price targets aur stop loss levels ke basis par set kar sakte hain.Tweezer bottom pattern market analysis mein ek useful tool hai, lekin iska istemaal karne se pehle aapko aur bhi technical analysis ke concepts aur indicators ko samajhna zaroori hai. Iske saath hi risk management aur money management bhi dhyan mein rakhna chahiye. -
SkydiversSenior Member
- Mar 2023
- 1450
- 240
- 372
- 608 USD
Forex trading yani foreign exchange trading aik aisa market hai jahan currencies ka trade hota hai. Is market mein successful trading ke liye different strategies aur technical analysis ka use hota hai. Candlestick patterns trading mein bohat important role play karte hain kyun ke ye market sentiment aur price action ko samajhne mein madadgar hote hain. Unmein se aik popular candlestick pattern hai Tweezer Bottom Candlestick Pattern.
Candlestick patterns price action ko visually represent karte hain aur ye traders ko market trend aur potential reversals identify karne mein madadgar hote hain. Candlesticks mein aik body hoti hai jo opening aur closing price ko represent karti hai, aur shadows (wicks) hoti hain jo high aur low price ko dikhati hain. Candlestick patterns kai types ke hotay hain, jaise single, double aur triple candlestick patterns.
Tweezer Bottom Candlestick Pattern aik bullish reversal pattern hai jo downtrend ke baad form hota hai. Ye pattern do consecutive candlesticks par mabni hota hai, jinke lows approximately same hote hain. Is pattern ka matlab ye hota hai ke market ne apna bottom touch kar liya hai aur ab bullish reversal ki taraf ja sakta hai. Tweezer Bottom Pattern typically support level par form hota hai aur ye indicate karta hai ke sellers ka momentum kam ho raha hai aur buyers market control mein aa rahe hain.
Tweezer Bottom Pattern ki Characteristics:- Two Candlesticks:
- Ye pattern do candlesticks par mabni hota hai. Pehli candlestick bearish hoti hai (red ya black) aur dusri candlestick bullish hoti hai (green ya white).
- Same Lows:
- Dono candlesticks ke lows approximately same hote hain. Ye important characteristic hai jo Tweezer Bottom ko identify karne mein madadgar hoti hai.
- Bullish Reversal:
- Ye pattern indicate karta hai ke market mein bullish reversal aa sakta hai. Matlab downtrend khatam hone wala hai aur uptrend start ho sakta hai.
- Support Level:
- Ye pattern typically support level par form hota hai, jahan price ne pehle bhi reversal show kiya hota hai.
Tweezer Bottom Pattern ko identify karne ke liye aapko price chart par do consecutive candlesticks ko dekhna hota hai. Aayiye dekhte hain ke is pattern ko kaise identify kiya jata hai:- Downtrend:
- Sabse pehle ensure karein ke market downtrend mein ho. Ye pattern sirf downtrend ke baad form hota hai.
- First Candlestick:
- Pehli candlestick bearish honi chahiye. Iska matlab hai ke opening price high aur closing price low hoti hai.
- Second Candlestick:
- Dusri candlestick bullish honi chahiye. Iska matlab hai ke opening price low aur closing price high hoti hai.
- Same Lows:
- Dono candlesticks ke lows approximately same hone chahiye. Matlab dono candlesticks ka lowest point ek hi level par hona chahiye.
Agar pehli candlestick ka low 1.1000 hai aur dusri candlestick ka low bhi 1.1000 hai, to ye Tweezer Bottom Pattern hai, agar dono candlesticks ke lows same levels par hain aur pehli candlestick bearish aur dusri bullish hai.
Tweezer Bottom Pattern ka Practical Use
Forex trading mein Tweezer Bottom Pattern ko practically use karne ke liye aapko kuch steps follow karne padte hain. Aayiye dekhte hain ke is pattern ko trading mein kaise use kiya jata hai:
Step-by-Step Guide- Identify the Downtrend:
- Sabse pehle price chart par downtrend ko identify karein. Ye ensure karein ke market downward movement mein ho aur recent price action lower highs aur lower lows show kar raha ho.
- Spot the Tweezer Bottom:
- Downtrend mein do consecutive candlesticks ko dekhein jo Tweezer Bottom pattern banati hain. Pehli candlestick bearish aur dusri candlestick bullish honi chahiye aur dono ke lows same hone chahiye.
- Confirm the Pattern:
- Pattern ko confirm karne ke liye additional indicators use kar sakte hain jaise RSI (Relative Strength Index) ya MACD (Moving Average Convergence Divergence). Ye indicators oversold conditions ko confirm karne mein madadgar hote hain.
- Enter the Trade:
- Pattern confirm hone ke baad bullish trade enter karein. Aap buy position open kar sakte hain jab dusri (bullish) candlestick close ho jaye ya uske close hone ke thodi der baad.
- Set Stop Loss:
- Risk management ke liye stop loss zaroor set karein. Stop loss ko recent low se thoda niche set karein taake agar market aapki expectation ke against move kare to aapka loss limited ho.
- Set Take Profit:
- Profit target set karein jo aapki risk-reward ratio ke mutabiq ho. Aap recent resistance level ko profit target bana sakte hain.
Jese ke har trading strategy aur pattern ki apni limitations hoti hain, waise hi Tweezer Bottom Pattern ki bhi kuch limitations hain. Aayiye dekhte hain:- False Signals:
- Kabhi kabar market false signals deti hai jahan pattern form hota hai lekin expected reversal nahi hota. Isliye pattern confirmation aur additional indicators ka use zaroori hai.
- Market Conditions:
- Ye pattern har market condition mein work nahi karta. Trending markets mein ye pattern zyada effective hota hai jabke sideways markets mein kam effective hota hai.
- Risk Management:
- Proper risk management ke baghair ye pattern profitable nahi ho sakta. Stop loss aur take profit levels set karna zaroori hai.
- Timeframes:
- Different timeframes par ye pattern different results de sakta hai. Higher timeframes par ye pattern zyada reliable hota hai jabke lower timeframes par false signals ki probability zyada hoti hai.
Tweezer Bottom Pattern ko different market conditions mein use karne ke liye aapko market sentiment aur price action ko samajhna zaroori hai. Aayiye dekhte hain ke is pattern ko different market conditions mein kaise use kiya jata hai:
Trending Market
Trending market mein Tweezer Bottom Pattern zyada reliable hota hai. Downtrend ke baad agar ye pattern form hota hai to ye bullish reversal ka strong signal hota hai. Is condition mein aap pattern ko confidently use kar sakte hain aur bullish trade enter kar sakte hain.
Sideways Market
Sideways market mein price ek range ke andar move karti hai. Is market condition mein Tweezer Bottom Pattern ka use thoda mushkil hota hai kyun ke price ek definite trend follow nahi kar rahi hoti. Is condition mein aapko pattern confirmation ke liye additional indicators aur support/resistance levels ka use karna chahiye.
Volatile Market
Volatile market mein price movements unpredictable hoti hain aur sudden spikes aur drops common hote hain. Is market condition mein Tweezer Bottom Pattern ka use risky ho sakta hai kyun ke false signals ki probability zyada hoti hai. Is condition mein aapko stop loss ko thoda wide rakhna chahiye taake sudden price movements aapki position ko prematurely close na kar dein.
Practical Examples
Suppose ke EUR/USD ke 4-hour chart par downtrend chal raha hai. Ek point par do consecutive candlesticks form hoti hain jinke lows approximately same hote hain. Pehli candlestick bearish hai aur dusri bullish hai. Ye Tweezer Bottom Pattern ka clear example hai. Aap ye pattern dekh kar bullish trade enter karte hain aur stop loss recent low ke niche set karte hain. Take profit recent resistance level par set karte hain. Agar market aapki expectation ke mutabiq move karti hai to aapko acha profit milta hai.
GBP/JPY ke daily chart par ek strong downtrend chal raha hai. Ek point par do consecutive candlesticks form hoti hain jinke lows same hote hain. Pehli candlestick bearish aur dusri bullish hoti hai. Ye Tweezer Bottom Pattern ka example hai. Aap ye pattern dekh kar bullish trade enter karte hain aur stop loss recent low ke niche set karte hain. Take profit recent resistance level par set karte hain. Is tarah se aap market ka reversal ka faida utha sakte hain.
Tweezer Bottom Candlestick Pattern forex trading mein aik powerful tool hai jo bullish reversal ko indicate karta hai. Ye pattern do consecutive candlesticks par mabni hota hai jinke lows same hote hain aur ye typically downtrend ke baad form hota hai. Is pattern ko identify karne ke liye aapko price chart par do candlesticks ko dekhna hota hai aur additional indicators ka use karke pattern ko confirm karna hota hai. Proper risk management aur market analysis ke saath, ye pattern aapki trading strategy mein bohat valuable ho sakta hai aur aapko profitable trades execute karne mein madadgar ho sakta hai.
Believe in yourself and your abilities. When you fight for your dreams, you can achieve anything.
-
Tanveer5Senior Member
- Nov 2023
- 620
- 38
- 165 USD
Tweezer Bottom Candlestick Pattern.
Tweezer Bottom Candlestick Pattern kya hai? Tweezer Bottom ek reversal candlestick pattern hai jo ke typically downtrend ke end par dekha jata hai. Yeh pattern indicate karta hai ke market mein price bottom bana raha hai aur bullish reversal hone ka chance hai. Tweezer Bottom pattern do candles se mil kar banta hai jo lagbhag equal low price par close hoti hain.
Pattern Structure Tweezer Bottom pattern mein pehli candle bearish hoti hai aur doosri candle bullish hoti hai. Dono candles ka low price almost same hota hai, jo indicate karta hai ke support level par strong buying pressure hai. Yeh pattern visually tweezer ki tarah lagta hai, isiliye isse "Tweezer Bottom" kaha jata hai.
Identification Tweezer Bottom pattern ko identify karne ke liye aapko kuch cheezon ka dhyan rakhna hota hai:- Downtrend: Yeh pattern tabhi reliable hota hai jab market downtrend mein ho.
- Bearish Candle: Pehli candle bearish (red) hoti hai jo ke downtrend ko continue karti hai.
- Bullish Candle: Doosri candle bullish (green) hoti hai jo pehli candle ke low ke around open hoti hai aur upar close hoti hai.
- Equal Lows: Dono candles ka low price almost same hota hai.
Psychology Behind Tweezer Bottom Tweezer Bottom pattern market participants ke psychology ko reflect karta hai. Jab pehli bearish candle banti hai, sellers market ko neeche le jaate hain. Lekin, doosri candle ke waqt buyers aggressive ho jaate hain aur price ko upar push karte hain, jo indicate karta hai ke support level strong hai aur market reverse ho sakti hai.
Trading Strategy Tweezer Bottom pattern ko trade karne ke liye kuch steps follow kar sakte hain:- Identify Downtrend: Sabse pehle confirm karen ke market downtrend mein hai.
- Find the Pattern: Tweezer Bottom pattern ko identify karen.
- Confirmation: Pattern ke baad bullish confirmation ka wait karen, jaise ke higher volume ya next bullish candle.
- Entry Point: Confirmation milne par bullish trade enter karen.
- Stop Loss: Low of the pattern ke niche stop loss set karen.
- Target: Resistance levels ya Fibonacci retracement levels ko target karen.
Example Suppose EUR/USD downtrend mein hai aur aap 1-hour chart dekh rahe hain. Aap dekhte hain ke 1.1200 level par do candles banti hain jinka low almost same hai. Pehli candle bearish hai aur doosri bullish candle, jo indicate karta hai ke 1.1200 level par strong support hai aur market reverse ho sakti hai. Aap bullish trade enter karte hain aur stop loss 1.1190 par lagate hain. Apna target 1.1300 par set karte hain, jo ke nearest resistance level hai.
Risk Management Risk management FX trading mein crucial hai. Tweezer Bottom pattern reliable ho sakta hai lekin kabhi-kabhi false signals bhi de sakta hai. Isliye, stop loss ka use zaroori hai. Risk-reward ratio ko bhi consider karen, taake aapka potential profit loss se zyada ho.
Limitations Tweezer Bottom pattern ke kuch limitations bhi hain:- False Signals: Market mein noise ke wajah se kabhi-kabhi false signals mil sakte hain.
- Need for Confirmation: Pattern ke baad confirmation ka wait karna zaroori hai.
- Market Conditions: Pattern ka effectiveness different market conditions mein vary kar sakta hai.
Conclusion Tweezer Bottom candlestick pattern ek powerful reversal pattern hai jo market mein bottom formation aur bullish reversal ko indicate karta hai. Lekin, isse trade karne se pehle market context, confirmation aur risk management ko consider karna zaroori hai. Proper analysis aur disciplined approach se aap is pattern ka effectively use kar sakte hain aur apne trading outcomes improve kar sakte hain.
-
NaveedeagleSenior Member
- Jul 2024
- 647
- 1
- 10
- 153 USD
Tweezer Bottom Candlestick Pattern
Introduction
Tweezer Bottom candlestick pattern ek bullish reversal pattern hai jo price action me ek reversal ka signal deti hai. Ye pattern do candles par mushtamil hota hai jo typically market ke niche levels par paayi jati hain. Tweezer Bottom pattern ko samajhna aur use karna traders ke liye bohot faidemand ho sakta hai, khaaskar jab wo market ke bottom par reversal dhondhna chahte hain.
Formation of Tweezer Bottom
Tweezer Bottom pattern do consecutive candles par mushtamil hoti hai. Inki khas formation kuch is tarah hoti hai:
First Candle: Pehli candle ek bearish candle hoti hai jo ke strong selling pressure ko represent karti hai. Ye candle ek significant low banati hai.
Second Candle: Dusri candle ek bullish candle hoti hai jo ke buying pressure ko represent karti hai. Ye candle usually pehli candle ke low ke equal ya usse thoda neeche open hoti hai, aur high banate hue pehli candle ke body ko engulf kar leti hai.
Ye pattern tab confirm hota hai jab dusri candle bullish close hoti hai, jo ke reversal ka strong signal hota hai.
Characteristics of Tweezer Bottom
Tweezer Bottom pattern ki kuch khas characteristics hain jo isko identify karne me madadgar hoti hain:
Symmetry: Is pattern me dono candles ke lows aksar equal hote hain, jo ke ek strong support level ko indicate karta hai.
Volume: Volume typically pehli bearish candle me high hota hai aur dusri bullish candle me bhi increase hota hai, jo ke reversal ke signal ko confirm karta hai.
Shadows: Dono candles ke shadows bhi significant hote hain. Shadows ka equal hona bhi ek confirmation signal hota hai ke price ek strong support level par hai.
Trading Strategy
Tweezer Bottom pattern ko trading me use karte waqt kuch strategies madadgar hoti hain:
Entry Point: Entry usually dusri bullish candle ke close par ki jaati hai jab confirmation mil jata hai ke market ne reversal kar liya hai.
Stop Loss: Stop loss usually pehli bearish candle ke low ke thoda neeche lagaya jata hai taake agar market wapas niche jaye to losses ko minimize kiya ja sake.
Take Profit: Take profit ka target previous resistance levels ya recent highs ko dekhte hue set kiya jata hai. Ye levels woh hote hain jahan market pehle ruk gaya tha ya reverse hua tha.
Example
Agar hum ek example dekhen, to maan lijiye ke ek stock ka price gir raha hai aur ek point par ek bearish candle banata hai. Agle din, market me buying pressure aata hai aur ek bullish candle ban jati hai jo pehli candle ke low ko test karte hue wapas upar close hoti hai. Ye Tweezer Bottom pattern hai, aur is point par ek trader buy kar sakta hai, stop loss pehli candle ke low ke neeche laga sakta hai, aur take profit recent highs par target kar sakta hai.
Conclusion
Tweezer Bottom candlestick pattern ek powerful bullish reversal signal hai jo ke market ke bottom par strong buying pressure ko indicate karta hai. Is pattern ko samajhna aur effectively use karna traders ke liye bohot faidemand ho sakta hai, khaaskar jab wo market ke bottom par buying opportunities dhond rahe hon. Proper entry, stop loss, aur take profit levels set karke, traders is pattern se maximum faida utha sakte hain.
Advantages and Disadvantages
Advantages:
Clear Signal: Ye pattern ek clear bullish reversal signal deta hai.
Easy to Identify: Symmetrical formation ke wajah se is pattern ko identify karna asaan hota hai.
Strong Support Indication: Dono candles ke equal lows ek strong support level ko indicate karte hain.
Disadvantages:
False Signals: Kabhi kabhi ye pattern false signals de sakta hai agar volume aur market conditions supportive na hon.
Dependency on Confirmation: Ye pattern dusri bullish candle ke confirmation par dependent hai, jo ke har time available nahi hoti.
Best Practices
Confirm with Volume: Volume analysis ke sath is pattern ko confirm karna madadgar hota hai. High volume bullish candle confirmation ko strong banati hai.
Combine with Other Indicators: Is pattern ko doosre technical indicators, jaise ke moving averages aur RSI ke sath combine karke trading decisions lena behtareen hota hai.
Avoid in Low Volatility Markets: Low volatility markets me ye pattern kam effective hota hai, isliye high volatility markets me trade karna prefer karein.
Summary
Tweezer Bottom candlestick pattern ek bullish reversal pattern hai jo do candles par mushtamil hota hai aur strong buying pressure ko indicate karta hai. Is pattern ko samajhna aur use karna traders ko market ke bottom par buying opportunities ko identify karne me madad deta hai. Proper risk management aur confirmation ke sath, ye pattern profitable trading decisions lene me madadgar ho sakta hai..
-
TractorSenior Member
- Sep 2023
- 2357
- 55
- 386
- 690 USD
### Tweezer Bottom Candlestick Pattern
Tweezer bottom candlestick pattern ek powerful reversal signal hai jo traders ko potential market reversals ki taraf ishara karta hai. Ye pattern do candlesticks par mushtamil hota hai aur aksar bearish trend ke baad banta hai. Is post mein hum tweezer bottom pattern ki pehchan, significance, aur iska kaise istemal kiya jata hai, ka jaiza lenge.
**Tweezer Bottom Ki Pehchan:**
Tweezer bottom pattern do candlesticks par mabni hota hai:
1. **Pehli Candle:** Ye ek bearish candle hoti hai jo market ke downward trend ke dauran banti hai. Is candle ki closing price pichli candles se neeche hoti hai, jo downward momentum ko darshati hai.
2. **Dusri Candle:** Ye ek bullish candle hoti hai jo pehli candle ke baad aati hai. Iski closing price pehli candle ki low ke aas-paas hoti hai, lekin ye pehli candle se zyada upar band hoti hai. Is pattern ka matlab hai ke buyers ne market mein entry ki hai aur wo price ko upar ki taraf push kar rahe hain.
**Significance:**
Tweezer bottom pattern ka sab se bada significance ye hai ke ye bullish reversal ka strong indication hai. Jab ye pattern banta hai, to ye indicate karta hai ke bearish pressure kam ho raha hai aur buyers market mein wapas aa rahe hain. Is pattern ki pehchan karne se traders ko potential buying opportunities milti hain.
**Trading Strategies:**
1. **Confirmation Candle:**
Tweezer bottom pattern ke baad ek confirmation candle ka intezar karna zaroori hai. Agar agla candle bullish hota hai, to ye strong confirmation deta hai ke market bullish ho raha hai. Is waqt traders entry ka faisla kar sakte hain.
2. **Stop-Loss Setting:**
Trading karte waqt stop-loss zaroor set karein. Aap apne stop-loss ko pehli candle ke low ke thoda neeche rakh sakte hain, taake agar market aapke against jata hai to aapki losses limit ho.
3. **Target Setting:**
Target price set karne ke liye aap previous resistance levels ko dekh sakte hain. Ye levels aapko help karenge ye samajhne mein ke aap kitna profit hasil kar sakte hain.
**Risk Management:**
Tweezer bottom pattern ke sath trading karte waqt risk management ka khayal rakhna bohot zaroori hai. Is pattern ko dusre indicators ke sath mila kar dekhna behtar hota hai, jese ke Moving Averages ya RSI, taake aapki decision-making ko support mile.
**Conclusion:**
Tweezer bottom candlestick pattern ek effective tool hai jo traders ko market ke reversal points samajhne mein madad karta hai. Is pattern ko sahi tarah se samajhne aur istemal karne se aap apne trading decisions ko behtar bana sakte hain. Hamesha yaad rahein ke trading mein patience aur discipline zaroori hai, aur risk management ko kabhi nazar andaz na karein. Is tarah, aap apne trading experience ko successful bana sakte hain.
-
<a href="https://www.instaforex.org/ru/?x=ruforum">InstaForex</a> -
Aliyar_0Senior Member
- Aug 2024
- 1060
- 24
- 16
- 212 USD
Tweezer Bottom Candlestick Pattern
Tweezer Bottom Kya Hai?
Tweezer Bottom ek candlestick pattern hai jo bullish reversal ko darshata hai. Ye pattern tab banta hai jab do candlesticks ek hi price level par close hote hain, magar alag-alag time periods mein. Iska matlab ye hai ke market ne do baar ek hi low price par support dikhaya hai. Is pattern ko samajhne ke liye, humein do alag candlesticks ki zaroorat hoti hai: pehli candlestick bearish hoti hai, jabke doosri candlestick bullish hoti hai.
Pattern Ki Pehchaan
Tweezer Bottom ka pehla candlestick usually ek lambe red (bearish) candlestick se shuru hota hai. Ye candlestick market ki bearish momentum ko darshata hai. Phir, doosra candlestick green (bullish) hota hai jo pehle candlestick ke close ke barabar ya thoda upar close hota hai. Ye do candlesticks ek flat bottom banaate hain, jo ek strong support level ko indicate karta hai.
Tweezer Bottom Ki Ahmiyat
Is pattern ki ahmiyat ye hai ke ye market ke reversal ki nishani hoti hai. Jab aap is pattern ko dekhte hain, to aap samajh sakte hain ke sellers ki strength kam ho rahi hai aur buyers ki strength badh rahi hai. Is wajah se, traders is pattern ko bullish trend ki shuruaat ke tor par dekhte hain. Ye pattern aam tor par lower time frames, jaise ke 15-minutes, 30-minutes, aur hourly charts par dekha jata hai, lekin ye higher time frames par bhi kaam kar sakta hai.
Pattern Ki Taqreeban Pehchan
Tweezer Bottom ko pehchanne ke liye, kuch cheezein yaad rakhni chahiye:- Do Candlesticks: Pehli candlestick bearish honi chahiye, jabke doosri candlestick bullish honi chahiye.
- Close Price: Doosri candlestick ka close pehle candlestick ke close ke barabar ya thoda upar hona chahiye.
- Support Level: Ye pattern aksar ek significant support level par banta hai. Is support level ki tasdeeq ke liye aapko pichle price action ko dekhna chahiye.
Trade Entry Aur Exit
Agar aap Tweezer Bottom pattern dekhte hain, to aapko trade entry ke liye kuch specific strategies istemal karni chahiye:- Entry Point: Jab doosri candlestick close hoti hai, tab aap entry kar sakte hain. Aapko confirmation ke liye volume ko bhi dekhna chahiye. Agar volume high hai, to ye bullish signal ko mazid mazboot karta hai.
- Stop Loss: Aapka stop loss pehli candlestick ke low ke thoda neeche hona chahiye. Is tarah, agar market aapke favor mein nahi jata, to aap zyada loss se bach sakte hain.
- Target Price: Aap target price ko previous swing high ya kisi aur resistance level par set kar sakte hain. Is tarah, aap profit ko maximize kar sakte hain jab market bullish ho jata hai.
Tweezer Bottom Aur Technical Analysis
Tweezer Bottom pattern ko akele nahi dekhna chahiye. Aapko isay dusre technical indicators ke sath milakar use karna chahiye, jaise ke RSI (Relative Strength Index) ya MACD (Moving Average Convergence Divergence). Agar ye indicators bhi bullish signals de rahe hain, to aapko is pattern par zyada confidence hoga.
Nazar Rakhne Ki Baatain
Tweezer Bottom pattern ko samajhne aur trading mein istemal karne ke liye sabse zaroori hai ke aap market ki dynamics ko samjhein. Har market condition ke liye alag strategies hoti hain. Yeh zaroori hai ke aap trading plan tayyar karen aur emotional trading se bachen. Trading mein discipline aur patience ki bohat ahmiyat hoti hai.
Aakhri Khatma
Tweezer Bottom ek powerful candlestick pattern hai jo traders ko reversal points identify karne mein madad karta hai. Agar aap is pattern ko sahi tareeqe se samjhein aur use karein, to aap apni trading strategy ko mazboot kar sakte hain aur profits hasil kar sakte hain. Har waqt yaad rakhein, knowledge aur practice hi trading mein success ki kunji hai.


اب آن لائن
Working...
تبصرہ
Расширенный режим Обычный режим