Ichimoku Cloud in Forex Trading
-
SkydiversSenior Member
- Mar 2023
- 1459
- 241
- 372
- 614 USD
-
<a href="https://www.instaforex.org/ru/?x=ruforum">InstaForex</a> -
SkydiversSenior Member
- Mar 2023
- 1459
- 241
- 372
- 614 USD
Forex trading mein technical analysis ka bara maqam rakhta hai jiska asar daalne walay faislay mein madad milti hai. Aik mashhoor aur efektive technical analysis ka zariya Ichimoku Kinko Hyo hai, jo aam tor par Ichimoku Cloud ya sirf Cloud ke naam se jana jata hai. Late 1930s mein tajziakaar Goichi Hosoda ne develop kiya tha, jo ke Japanese journalist thay. Ichimoku Cloud aik comprehensive indicator hai jo market trends ke bare mein qeemti maloomat farahem karta hai, jaise ke support aur resistance levels, trend ki taraf, aur potential khareedne ya bechne ke signals. Ichimoku Cloud kay kuch ahem components hain, jo har aik market trend ke mutalik khaas maloomat farahem karte hain. Ichimoku Cloud ke mukhtalif hissay include karte hain Kumo (Cloud), Tenkan-sen (Conversion Line), Kijun-sen (Base Line), Senkou Span A (Leading Span A), aur Senkou Span B (Leading Span B).Kumo (Cloud) Kumo jo aksar Cloud ke tor par jana jata hai, Ichimoku Cloud indicator ka central aur sab se ahem hissa hai. Ye do leading spans, yani Senkou Span A aur Senkou Span B ke darmiyan woh area hai jo Cloud ko banata hai. Cloud ki rangat (aam tor par bullish ke liye sabz aur bearish ke liye surmai) overall market sentiment ko darust karti hai. Ek bullish Cloud ek maujooda uptrend ko zahir karta hai, jabke ek bearish Cloud ek downtrend ko zahir karta hai. Cloud ki motai bhi market ki volatility ko darust karti hai; zyada moti Cloud taqatwar support ya resistance ko zahir karta hai, jabke patli Cloud kamzor support ya resistance levels ko darust karti hai. Tenkan-sen (Conversion Line) aur Kijun-sen (Base Line) Tenkan-sen yaani Conversion Line, ko specific periods ke dauraan highest high aur lowest low ka average banakar calculate kiya jata hai, aam tor par nau periods ke liye. Ye chhoti-term market momentum ko zahir karta hai. Kijun-sen, yaani Base Line, bhi isi tarah calculate kiya jata hai lekin zyada lambay periods ke liye, aam tor par chabbis periods ke liye. Ye middle-term market momentum ko darust karta hai. Jab Conversion Line Base Line ke oopar cross karta hai, to ye aik bullish signal generate karta hai, jisse ke potential buying opportunities ka ishara hota hai. Baraks, jab Conversion Line Base Line ke neeche cross karta hai, to ye aik bearish signal generate karta hai, jisse ke potential selling opportunities ka ishara hota hai. Senkou Span A aur Senkou Span B (Leading Spans A aur B) Senkou Span A Tenkan-sen aur Kijun-sen ka average hai jo 26 periods ke liye aage plot kiya jata hai. Senkou Span B ko calculate karne ke liye 52 periods ke dauraan highest high aur lowest low ka average banaya jata hai, jise ke 26 periods ke liye aage plot kiya jata hai. Ye leading spans Cloud ke edges banate hain aur future support aur resistance levels ka kaam karte hain. Senkou Span A aur Senkou Span B ke darmiyan area ko aam tor par shade kiya jata hai, jisse Cloud ban jati hai. Agar price Cloud ke oopar hoti hai, to ye ek bullish trend ko zahir karta hai, jabke agar price Cloud ke neeche hoti hai, to ye ek bearish trend ko zahir karta hai.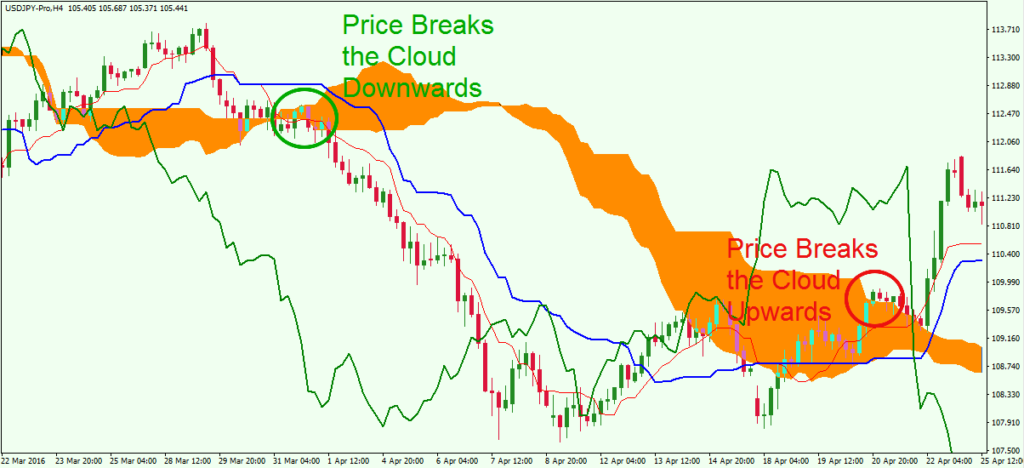 Application of Ichimoku Cloud in Forex Trading Traders Ichimoku Cloud indicator ko trading decisions banane ke liye kai tariko se istemal karte hain. Aik aam strategy ye hai ke Kumo breakouts ki taraf dekha jata hai, jahan price Cloud ke oopar ya neeche jaati hai, jisse ke potential trend reversal ya continuation ka ishara hota hai. Ek bullish Kumo breakout tab hota hai jab price Cloud ke oopar jaati hai, jisse ke ek downtrend se uptrend ki taraf shift hone ka ishara hota hai. Baraks, ek bearish Kumo breakout tab hota hai jab price Cloud ke neeche jaati hai, jisse ke ek uptrend se downtrend ki taraf shift hone ka ishara hota hai. Dusri mashhoor strategy ye hai ke Conversion Line aur Base Line ke darmiyan interaction par nazar rakhi jati hai. Jab Conversion Line Base Line ke oopar cross karti hai, to ye aik bullish signal generate hoti hai. Traders long position enter karne ka soch sakte hain. Baraks jab Conversion Line Base Line ke neeche cross karti hai, to ye aik bearish signal generate hoti hai, aur traders short position enter karne ka soch sakte hain.
 Is ke ilawa traders price aur Cloud ke darmiyan relationship ko analyze karte hain. Agar price Cloud ke oopar hoti hai, to ye aik support level ka kaam karti hai. Agar price uptrend ke dauraan Cloud tak wapas aati hai, to traders ise ek mauka samajhte hain ke wo long position enter karein, umeed ki jaati hai ke bullish trend jaari rahega. Baraks, agar price Cloud ke neeche hoti hai, to ye aik resistance level ka kaam karti hai. Agar price downtrend ke dauraan Cloud tak pohanchti hai, to traders ise ek mauka samajhte hain ke wo short position enter karein, umeed ki jaati hai ke bearish trend jaari rahega.
Believe in yourself and your abilities. When you fight for your dreams, you can achieve anything.
Is ke ilawa traders price aur Cloud ke darmiyan relationship ko analyze karte hain. Agar price Cloud ke oopar hoti hai, to ye aik support level ka kaam karti hai. Agar price uptrend ke dauraan Cloud tak wapas aati hai, to traders ise ek mauka samajhte hain ke wo long position enter karein, umeed ki jaati hai ke bullish trend jaari rahega. Baraks, agar price Cloud ke neeche hoti hai, to ye aik resistance level ka kaam karti hai. Agar price downtrend ke dauraan Cloud tak pohanchti hai, to traders ise ek mauka samajhte hain ke wo short position enter karein, umeed ki jaati hai ke bearish trend jaari rahega.
Believe in yourself and your abilities. When you fight for your dreams, you can achieve anything.
-
Realome98Senior Member
- May 2024
- 1207
- 1
- 149
- 389 USD
Assalamu Alaikum Dosto!
Ichimuko Cloud Indicator
Kuch candlestick k pattern ya shap ko same hi Japanese language se change kia hai. Ichimoku Cloud, jo ke Japanese technical analysis ka ek popular indicator hai, traders aur investors ke liye trend identification aur support-resistance levels ke determination mein madad karta hai. Is indicator ka naam "Ichimoku Kinko Hyo" hai, jo Japanese bhasha mein "Ek aankh se dekhna" ka matlab hota hai. Ichimoku Cloud ek comprehensive indicator hai, jismein multiple components shamil hote hain.
Ichimoku Cloud ka upyog karke traders market ke trend direction, trend strength, support-resistance levels, aur entry-exit points ka analysis kar sakte hain. Is indicator ke components mein tenkan-sen (Conversion Line), kijun-sen (Base Line), senkou span A (Leading Span A), senkou span B (Leading Span B), aur chikou span (Lagging Span) shamil hote hain.
Ichimoku Cloud ke components ka combination traders ko visual representation deta hai, jo unko market conditions aur price movements ko samajhne mein madad karta hai. Ichimoku Cloud ke components ke saath-saath, iska interpretation aur application ke liye traders ko additional technical analysis tools aur price action ka istemal karna zaroori hota hai.
Components of Ichimoku Cloud
Ichimoku Cloud ka interpretation aur analysis karne ke liye iske components ko samajhna zaroori hai. Yahaan Ichimoku Cloud ke mukhtalif components ka zikr kiya gaya hai:
- Tenkan-sen (Conversion Line): Tenkan-sen ek short-term indicator hai, jo average price ko calculate karta hai. Iska calculation karte waqt, last 9 periods ka high aur low ka average nikala jata hai. Tenkan-sen traders ko current price ka momentum aur short-term trend direction batata hai.
- Kijun-sen (Base Line): Kijun-sen ek medium-term indicator hai, jo average price ko calculate karta hai. Iska calculation karte waqt, last 26 periods ka high aur low ka average nikala jata hai. Kijun-sen traders ko medium-term trend direction aur support-resistance levels ke bare mein information deta hai.
- Senkou span A (Leading Span A): Senkou span A, ek component hai jo future ke support-resistance levels ko represent karta hai. Iska calculation karte waqt, Tenkan-sen aur Kijun-sen ke average values ko plot kiya jata hai aur phir unko 26 periods aage forward shift kiya jata hai.
- Senkou span B (Leading Span B): Senkou span B, dusra component hai jo future ke support-resistance levels ko represent karta hai. Iska calculation karte waqt, last 52 periods ka high aur low ka average nikala jata hai, aur phir unko 26 periods aage forward shift kiya jata hai.
- Chikou span (Lagging Span): Chikou span current closing price ko 26 periods peeche shift karta hai. Yeh component traders ko price ke past movements aur possible reversal points ke bare mein information deta hai.
Ichimuko Cloud Calculation
Ichimoku Cloud ka calculation aur formula multiple components ka upyog karta hai. Yahaan Ichimoku Cloud ke mukhtalif components aur unke calculation formulas ka zikr kiya gaya hai:
- Tenkan-sen (Conversion Line):
Tenkan-sen ka calculation last 9 periods ke high aur low prices ka average banakar hota hai. Formula is tarah hai:
Tenkan-sen = (Highest High of Last 9 Periods + Lowest Low of Last 9 Periods) / 2 - Kijun-sen (Base Line):
Kijun-sen ka calculation last 26 periods ke high aur low prices ka average banakar hota hai. Formula is tarah hai:
Kijun-sen = (Highest High of Last 26 Periods + Lowest Low of Last 26 Periods) / 2 - Senkou Span A (Leading Span A):
Senkou Span A ka calculation Tenkan-sen aur Kijun-sen ke average values ko plot karke aur phir unko 26 periods aage forward shift karke hota hai. Formula is tarah hai:
Senkou Span A = (Tenkan-sen + Kijun-sen) / 2 - Senkou Span B (Leading Span B):
Senkou Span B ka calculation last 52 periods ke high aur low prices ka average banakar hota hai, aur phir unko 26 periods aage forward shift kiya jata hai. Formula is tarah hai:
Senkou Span B = (Highest High of Last 52 Periods + Lowest Low of Last 52 Periods) / 2 - Chikou Span (Lagging Span):
Chikou Span current closing price ko 26 periods peeche shift karta hai. Formula is tarah hai:
Chikou Span = Current Closing Price plotted 26 periods behind
Yeh hain Ichimoku Cloud ke mukhtalif components aur unke calculation formulas. In components ka upyog karke Ichimoku Cloud ka plot banta hai, jo traders ko trend direction, support-resistance levels, aur entry-exit points ke analysis mein madad karta hai.
Interpretation and Application of Ichimoku Cloud
Ichimoku Cloud ka interpretation aur application karne ke liye traders ko Ichimoku Cloud ke components aur unki interaction ko samajhna zaroori hai. Yahan kuch common Ichimoku Cloud strategies ka zikr kiya gaya hai:
- Trend Identification: Ichimoku Cloud ka upyog karke traders trend direction ko identify kar sakte hain. Jab price chart Ichimoku Cloud se upar hai aur Cloud green color mein hai, toh uptrend ki indication hoti hai. Jab price chart Cloud se neeche hai aur Cloud red color mein hai, toh downtrend ki indication hoti hai.
- Support and Resistance Levels: Ichimoku Cloud traders ko support aur resistance levels ka determination karne mein madad karta hai. Cloud ke upper span aur lower span ke beech wale area ko traders support aur resistance levels ke roop mein interpret karte hain.
- TK Crossover: Jab Tenkan-sen (Conversion Line) Kijun-sen (Base Line) se upar cross karta hai, toh buy signal generate hota hai. Jab Tenkan-sen Kijun-sen se neeche cross karta hai, toh sell signal generate hota hai. Yeh crossover strategy trend reversal points ko identify karne mein istemal hoti hai.
- Kumo Breakout: Jab price chart Cloud se bahar nikalta hai, toh Kumo breakout ki indication hoti hai. Jab price chart Cloud se bahar nikal kar upside move karta hai, toh buy signal generate hota hai. Jab price chart Cloud se bahar nikal kar downside move karta hai, toh sell signal generate hota hai.
Advantages and Limitations of Ichimoku Cloud
Ichimoku Cloud ke kuch fayde aur limitations hain, jo traders ko samajhne zaroori hote hain:
- Benifits:
- Comprehensive Analysis: Ichimoku Cloud traders ko trend identification, support-resistance levels, aur entry-exit points ka comprehensive analysis karne mein madad karta hai. Is indicator ke multiple components traders ko market conditions aur price movements ko visually represent karte hain.
- Trend Confirmation: Ichimoku Cloud trend direction ko confirm karne mein madad karta hai. Traders ko buy aur sell signals ke liye trend direction ko analyze karne mein help milti hai.
- Versatility: Ichimoku Cloud long-term, medium-term, aur short-term timeframes mein istemal kiya ja sakta hai. Iski versatility traders ko alag-alag trading scenarios mein istemal karne ki flexibility deta hai.
- Limitations:
- Lagging Indicator: Ichimoku Cloud ka nature lagging hai, kyun ki iska calculation past price data par based hota hai. Yeh indicator current market conditions ko reflect karne mein thoda samay le sakta hai.
- False Signals: Ichimoku Cloud keval ek indicator hai aur dusre technical indicators aur price action ke saath combine karke istemal karna zaroori hota hai. Alag-alag market situations mein, Ichimoku Cloud false signals generate kar sakta hai.
- Complex Interpretation: Ichimoku Cloud ke multiple components aur interaction ko interpret karna challenging ho sakta hai. Is indicator ko sahi tarah se samajhne ke liye traders ko dedicated practice aur experience ki zaroorat hoti hai.
Conclusion
Ichimoku Cloud, ek powerful technical indicator hai jo traders ko trend identification, support-resistance levels, aur entry-exit points ka analysis karne mein madad karta hai. Iska comprehensive nature aur multiple components traders ko market conditions aur price movements ko visually represent karte hain. Traders ko Ichimoku Cloud ke components ko samajhna, interpretation karna, aur additional technical analysis tools ke saath combine karna zaroori hai. Iske fayde aur limitations ko samajh kar, traders ko Ichimoku Cloud ke signals ko analyze karke apni trading strategies ko develop karna chahiye.
-
<a href="https://www.instaforex.org/ru/?x=ruforum">InstaForex</a> -
mabdulrehmanSenior Member
- Jul 2024
- 2570
- 30
- 46
- 522 USD
Ichimoku Cloud in Forex Trading
Ichimoku Cloud Kya Hai?
Ichimoku Cloud aik comprehensive indicator hai jo multiple components ko ikatha karta hai taake market trends aur potential trading signals ko identify kiya ja sake. Yeh indicator Japanese journalist Goichi Hosoda ne develop kiya tha aur iska full naam "Ichimoku Kinko Hyo" hai. Yeh indicator traders ko ek nazar me market ke different aspects dikhata hai.
Ichimoku Cloud ke Components
Ichimoku Cloud ke paanch main components hain:- Tenkan-Sen (Conversion Line): Yeh 9-period moving average hai. Isko calculate karne ke liye highest high aur lowest low ka average liya jata hai pichle 9 periods me.
- Kijun-Sen (Base Line): Yeh 26-period moving average hai. Isko bhi highest high aur lowest low ka average liya jata hai pichle 26 periods me.
- Senkou Span A (Leading Span A): Tenkan-Sen aur Kijun-Sen ka average hai jo 26 periods aage plot kiya jata hai.
- Senkou Span B (Leading Span B): Yeh 52-period moving average hai jo 26 periods aage plot kiya jata hai.
- Chikou Span (Lagging Span): Current price ko 26 periods pichay plot kiya jata hai.
Trend Identification
Ichimoku Cloud ka sabse basic use trend identification hai. Jab price cloud ke upar ho, to market bullish hota hai aur jab price cloud ke niche ho, to market bearish hota hai. Agar price cloud ke andar ho, to market range-bound ya sideways hota hai.
Support aur Resistance
Cloud future me support aur resistance levels ko predict kar sakta hai. Jab price cloud ke upar ho, to lower boundary support ka kaam karti hai aur jab price cloud ke niche ho, to upper boundary resistance ka kaam karti hai.
Trading Signals
Ichimoku Cloud different types ke trading signals generate karta hai:- Bullish Signals: Jab Tenkan-Sen Kijun-Sen ko neeche se cross kare aur price cloud ke upar ho, to yeh ek bullish signal hota hai.
- Bearish Signals: Jab Tenkan-Sen Kijun-Sen ko upar se cross kare aur price cloud ke niche ho, to yeh ek bearish signal hota hai.
Ichimoku Cloud har trading scenario me effective nahi hota. Yeh indicator trending markets me zyada effective hota hai, lekin choppy aur sideways markets me false signals generate kar sakta hai. Isliye, traders ko isko doosre indicators ke sath use karna chahiye taake trading decisions zyada accurate ho sakein.
Conclusion
Ichimoku Cloud aik powerful tool hai jo Forex trading me traders ko market trends aur potential trading opportunities ko identify karne me madad karta hai. Lekin, isko effectively use karne ke liye iske different components aur signals ko achi tarah samajhna zaroori hai. Har indicator ki tarah, isko bhi trading strategy ka ek hissa banana chahiye aur doosre tools ke sath use karna chahiye.
⚡ "Profit is the reward for patience, loss is the fee for learning." 💡
اب آن لائن
Working...
تبصرہ
Расширенный режим Обычный режим