Positive Volume Index Vs Negative Volume Index in forex
-
SkydiversSenior Member
- Mar 2023
- 901
- 238
- 362
- 345 USD
InstaSpot: کسی بھی EPS اور بینک سے منافع واپس لیں، اور EPS اور cryptocurrencies کے تبادلے پر 7% تک کمائیں۔
Believe in yourself and your abilities. When you fight for your dreams, you can achieve anything.
-
<a href="https://www.instaforex.org/ru/?x=ruforum">InstaForex</a> -
SkydiversSenior Member
- Mar 2023
- 901
- 238
- 362
- 345 USD
Positive Volume Index (PVI) aur Negative Volume Index (NVI) forex trading aur doosre maliyat market mein istemal hone wale technical indicators hain jo trading volumes ke sath qeemat tahqiq karne ke liye istemal hotay hain. Ye indeks Paul Dysart ne 1930s mein tayyar kiye thay aur tab se traders aur analysts ke liye ahem tools ban gaye hain. Positive Volume Index (PVI) Jaise iska naam ishara karta hai, Positive Volume Index ek indicator hai jo market mein positive ya up days par tawajjo deta hai. Iska maqsad bullish price movements ko pehchan kar unki taqat ko qeemat treen karna hai jo dino mein hoti hain jab trading volumes barh jati hain. Dusri baaton mein, PVI ye kosish karta hai ke market mein mazboot khareedari ke asar ko qeemat trendon mein nape.Calculation of PVI PVI ka hisab buhat asaan tariqe se hota hai. Ye 1000 ke sath shuru hota hai (haan, is shuruat point ki choice trader ya charting software ke tayyar karne walay par depend karti hai). Phir, har trading day ke liye PVI ye formula istemal karke update hota hai: PVI = Pechli PVI + [(Aaj ki Close - Kal ki Close) / Kal ki Close] * Pechli PVI Is calculation mein pehli baat to close prices mein hone wala tabdeelai hai. Agar aaj ki closing price kal ki closing price se zyada hai, to PVI barh jayega, jo ke positive price movement ko refect karega. Ulta agar aaj ki closing price kal ki closing price se kam hai, to PVI waisa hi rehta hai. Is calculation ka maqsad hai ke zyada trading volumes ke dino ko zyada wazan diya jaye, umooman ye samjha jata hai ke bari trading volumes market sentiment ko ziada darust taur par darust karte hain. Isliye, dino mein barhne wale trading activity ke sath, PVI ke index par ziada asar hota hai. Interpretation of PVI PVI ki taqat ki tafsili interpretation is ke value aur trend par mabni hai. Yahan di gayi key points ko ghor se samjha jaa sakta hai: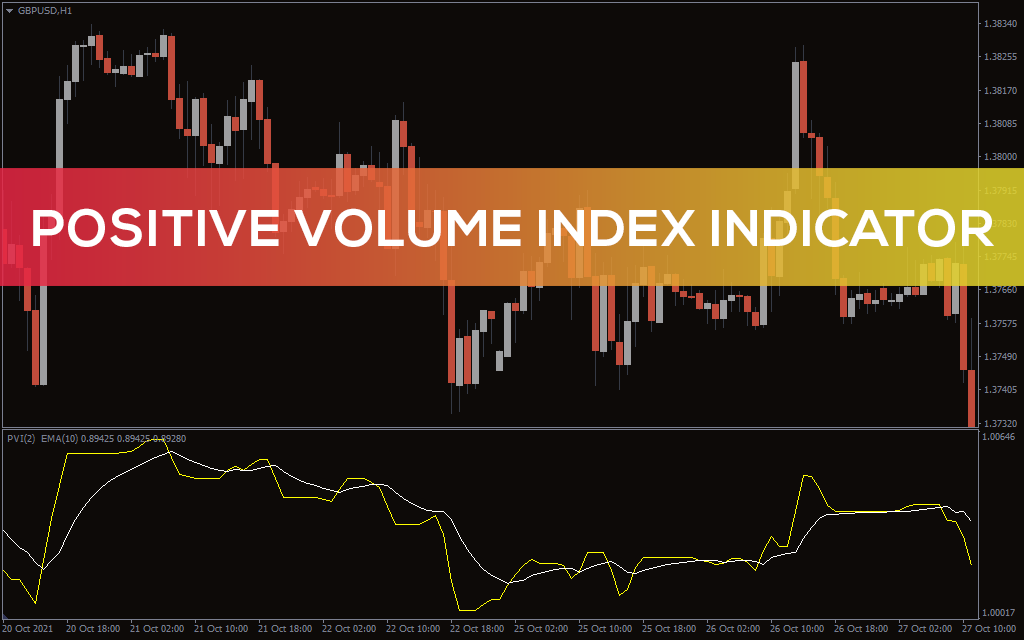
- Trend Confirmation: Aik barhte hue PVI ye tasdeeq karta hai ke market ek uptrend mein hai. Ye ishara karta hai ke khareedari ki dilchaspi mazboot hai aur positive price movements ko zyada trading volumes ke sath support mil rahi hain. Traders isey ek bullish trend ki tasdeeq samajh sakte hain.
- Divergence: PVI aur price mein farq ko "divergence" kehte hain, aur ye ek taqatwar signal ho sakta hai. Agar prices barh rahi hain lekin PVI gir raha hai, to ye mazboot bullish momentum ki kamzori aur trend reversal ki alamat ho sakti hai. Ulti halat mein, agar prices gir rahi hain lekin PVI barh raha hai, to ye kamzoor bearish trend aur upside ki taraf trend reversal ki alamat ho sakti hai.
- Flat or Declining PVI: Relatively flat ya kam hone wala PVI ek uptrend mein kamzori hone ki alamat ho sakti hai, ye ishara karta hai ke price increases ko zyada trading volumes ne support nahi kiya. Traders isey ehtiyaat se kaam lena samajh sakte hain.
Calculation of NVI NVI PVI ki tarah shuru hota hai (aam taur par 1000) aur har trading day ke liye is formula ke istemal se update hota hai: NVI = Pechla NVI + [(Kal ki Close - Aaj ki Close) / Kal ki Close] * Pechla NVI Bilkul PVI ki tarah closing prices mein hone wala tabdeelai is Negative Volume Index ke calculation mein pehla factor hota hai. Agar aaj ki closing price kal ki closing price se kam hai, to NVI barh jayega, jo negative price movement ko refect karega. Dusra rasta, agar aaj ki closing price kal ki closing price se zyada hai, to NVI waisa hi rehta hai. Interpretation of NVI Negative Volume Index ki tafsili interpretation PVI ki tarah hai, lekin iska tawajjo bearish trend par hota hai: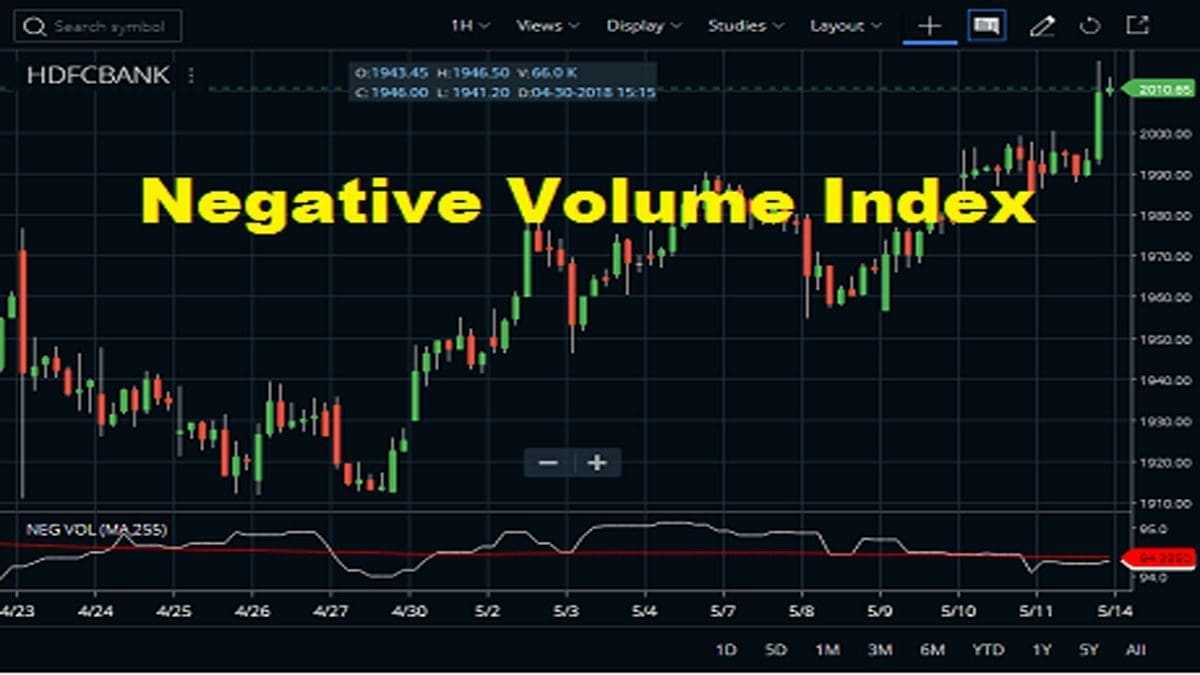
- Trend Confirmation: Barhta hua NVI ye ishara karta hai ke market ek downtrend mein hai. Isse ye sabit hota hai ke bechne ki dilchaspi mazboot hai aur negative price movements zyada trading volumes ke sath hoti hain, bearish trend ki tasdeeq karti hain.
- Divergence: PVI ya price ke darmiyan divergence bhi aik ahem signal ho sakti hai. Agar prices gir rahi hain, lekin NVI barh raha hai, to ye bearish momentum ki kamzori aur trend reversal ki alamat ho sakti hai aur upside ki taraf trend reversal ki alamat ho sakti hai.
- Flat or Declining NVI: Aik downtrend mein relatively flat ya kam hone wala NVI bearish momentum ki kamzori ho sakti hai, ye ishara karta hai ke price declines zyada trading volumes se support nahi kiye ja rahe hain. Ye traders ke liye ehtiyaat ki alamat ho sakti hai.
Believe in yourself and your abilities. When you fight for your dreams, you can achieve anything. -
<a href="https://www.instaforex.org/ru/?x=ruforum">InstaForex</a> -
BlazeMember

- Jul 2023
- 38
- 3
- 6 USD
InstaSpot: کسی بھی EPS اور بینک سے منافع واپس لیں، اور EPS اور cryptocurrencies کے تبادلے پر 7% تک کمائیں۔
Positive Volume Index (PVI) aur Negative Volume Index (NVI) dono stock market aur financial markets mein volume-based technical indicators hain jo ki price trends ko analyze karne mein istemal hote hain. In dono mein mukhya fark yah hai ki kis tarah ke market conditions mein inka istemal hota hai aur kis prakar ke signals generate karte hain: **Positive Volume Index (PVI):** 1. PVI ek indicator hai jo uptrends ko identify karne ke liye istemal hota hai. 2. PVI ka calculation volume ke upar adharit hota hai, yaani ki jab trading volume previous day se badh jata hai, to PVI badhne ki taraf ishara karta hai. 3. Positive Volume Index ki calculation mein, PVI = PVI(previous day) + [(Close - Close(previous day)) / Close(previous day)] * PVI(previous day) * (Volume / Volume(previous day)) **Negative Volume Index (NVI):** 1. NVI ek indicator hai jo downtrends ko identify karne ke liye istemal hota hai. 2. NVI ka calculation bhi volume ke upar adharit hota hai, lekin ismein jab trading volume previous day se kam hota hai, to NVI badhne ki taraf ishara karta hai. 3. Negative Volume Index ki calculation mein, NVI = NVI(previous day) + [(Close - Close(previous day)) / Close(previous day)] * NVI(previous day) * (Volume / Volume(previous day)) In dono indexes ke upar adharit, yadi PVI ya NVI ki value badhti hai, to iska matlab hai ki uptrend (PVI ke case mein) ya downtrend (NVI ke case mein) strong ho raha hai. Agar volume badh raha hai aur PVI ya NVI dono badh rahe hain, to yah trend ke confirmation ka sanket ho sakta hai. In dono indexes ke istemal se traders price trends ko samajhne aur confirm karne mein madadgar signals prapt kar sakte hain. Yah indicators traders ke liye ek aur tarika hote hain market analysis ke liye.
اب آن لائن
Working...
تبصرہ
Расширенный режим Обычный режим