Describe about Continuation Pattern in Forex
-
Km2006Senior Member
- Mar 2022
- 1260
- 72
- 152
- 1 120 USD
-
<a href="https://www.instaforex.org/ru/?x=ruforum">InstaForex</a> -
Km2006Senior Member
- Mar 2022
- 1260
- 72
- 152
- 1 120 USD
Continuation Pattern and its types Assalam O Alaikum Dear friends and fellows Continuation pattern aik qisam ka technical analysis pattern hai jo chart ke analysis mein use kiya jata hai taakay short time ke istehkaam ya tawaquf ke baad mojooda rujhan ke dobara shuru honay ki nishandahi ki ja sakay .in other words, aik tasalsul ka namona batata hai ke current trend arzi istehkaam ya islaah ki muddat ke bad jari rehny ka imkaan hai. yeh pattrens trader ko mumkina tijarti mawaqay faraham kar satky hain, kyun kay yeh current trend ki simt aur taaqat ki nishandahi karny mein madad kar satky hain .aam Continuation Patterns mein flags, pen, triangles aur mustateel shaamil hain. Flag aur pattern short term patterns hain jo is waqt hotay hain jab qeematon mein taiz raftaar harkat hoti hai jis ke baad istehkaam ki muddat hoti hai, aam tor par aik mustateel shakal banti hai. masalas aur mustateel taweel mudti pattern hain jo is waqt hotay hain jab qeemat aik makhsoos range ke andar ikathi hojati hai, aik masalas ya mustateel shakal banti hai .yeh note karna zaroori hai ke tasalsul ke pattern hamesha durust nahi hotay aur nakaam ho saktay hain, is liye un pitrnz ki bunyaad par kiye gaye kisi bhi tijarti faislay ki tasdeeq ke liye deegar takneeki isharay aur tajzia istemaal karna zaroor hai. Continuation Pattern ki 2 types hain 1. Bullish Continuation Pattern 2. Bearish Continuation Pattern. What is Continuation Pattern Continuation pattern us pattern ko kaha jata hai jis main jo market ke jo bhi price ho wo apna previous trend ko follow karty huwy jati hai ya jo continuation pattern hota ha ya 2 trha sa banta hai aik bullish continuation or dosra bearish continuation pattern ya jo dono continuation pattern hoty hain ya apna previous trend ko follow karty huwy banta hai jo bullish continuation pattern hota ha ya apna previous uptrend ko follow karta huwy banta ha or stock market ke price ko bullish kr janab continue karna ka kam karta ha or jo bearish continuation pattern ha ya jab banta ha yo is time par bearish ka trend hota ha or ya bearish continuation pattern is bearish ka trend sa ban kar stock ke price ko bearish ke janab continues ka kam karta ha ya bullish continuation or bearish continuation pattern apas ma ak dosra ka opposed ma banta ha or huma bahot sa continues pattern dakhna ko mil jata ha yani ka jo bullish continuation hota ha in ki bahot se types hoyi ha jo ka stock ke price ko upwards ke janab continue karti ha or bearish continuation pattern ki bhi bahot si types hoti ha or is bearish continuation ke all types stock ke price ko lower ke janab la jana ka kam karti ha. -
Sanwal115Senior Member

- Feb 2023
- 149
- 73
- 129
- 66 USD
Forex trading ek complex aur dynamic duniya hai, jahan traders currencies ko kharidte hain aur bechte hain. Ismein kamyabi hasil karne ke liye, traders ko market analysis ka acha ilm hona zaruri hai. Continuation pattern, ya musalsal shakal, forex trading mein aik ahem hissa hai jisse traders istemal karte hain market trends aur price movements ko samajhne ke liye. Continuation patterns market mein trend ke jari rehne ki soorat-e-haal ko darust karti hain. Ye patterns typically ek trend ke doran aate hain jab market ek mukhtalif trend ki taraf badh rahi hoti hai. Traders ko ye patterns samajhna chahiye takay woh trend ko samajh saken aur trading decisions behtar tor par le saken. Describe about Continuation Pattern in Forex trading Do aham aur common continuation patterns hain: Bullish Flag: Bullish flag pattern hoti hai jab market mein pehle se hi ek uptrend chal raha hota hai aur phir ek short-term consolidation phase aata hai. Is phase mein price ek tight range mein move karti hai, jise flag ke jaisa dekha jata hai. Iske baad, price phir se uptrend mein chali jati hai. Traders bullish flag ko dekhte hain, woh aksar uptrend ke continuation ki taraf ishara karte hain. Bearish Pennant: Bearish pennant pattern bearish trend ke doran aati hai. Is pattern mein bhi ek consolidation phase hota hai, lekin iski shape ek pennant ya triangle ki tarah hoti hai. Yeh pattern bearish trend ki jari rehne ki indication deta hai. Jab price pennant ke baad neeche ki taraf move karta hai, toh traders sell positions par focus karte hain. Continuation patterns traders ke liye trading opportunities create kar sakti hain. In patterns ko samajh kar, traders apne positions ko entry aur exit points par set kar sakte hain. Lekin, yaad rahe ke kisi bhi pattern ko sirf ek element ke roop mein nahi dekha jana chahiye. Market analysis, risk management, aur trading strategy ka acha combination hona chahiye. Isliye, forex trading mein success hasil karne ke liye, traders ko market mein hone wale patterns aur events ko samajhna zaruri hai. Continuation patterns un patterns mein se hain jo market trends ke continuation ko represent karti hain, aur traders in patterns ko samajh kar apni trading decisions ko improve kar sakte hain. -
LuqmanHakeemSenior Member
- Aug 2023
- 163
- 1
"Linear Regression kya hai?Linear Regression ek statistical technique hai jisse data analysis mein istemal kiya jata hai. Iska main uddeshya ek dependent variable aur ek ya adhik independent variables ke beech ki linear sambandh ko samjhna hai. Isse ham data mein se patterns aur trends ko samajh sakte hain, jisse future predictions aur inference nikala ja sakta hai." -
Asim14Senior Member
- Sep 2023
- 794
- 25
- 185
- 326 USD
Describe about Continuation Pattern in Forex Forex market mein, "continuation patterns" ek ahem concept hain jo technical analysis mein istemal hoti hain taa'kay currency prices ke possible trends ko pehchana ja sake. Ye patterns ishara dete hain ke mojooda trend, chahe wo upward ya downward ho, ek muddat ke consolidation ya correction ke baad aksar jari rahega. Continuation patterns ko pehchanna forex traders ke liye ahem hota hai kyun ke ye unko forex market mein entry aur exit points ki tafseelat pesh karne mein madadgar ho sakte hain. Neeche kuch aam continuation patterns hain:- Flag Pattern (Jhanda Pattern): Jhanda pattern ek aisa pattern hai jo ek trend ke beech mein choti si rukawat ya correction ko darust karta hai. Is pattern mein, currency price ek flag ki tarah aik chhota rectangle ya parallelogram banata hai, jo trend ke continuation ki taraf ishara karta hai. Agar trend pehle se upar ja raha hai, to ye bullish flag hai, aur agar trend pehle se neeche ja raha hai, to ye bearish flag hai.
- Pennant Pattern (Jhalar Pattern): Jhalar pattern ek aur continuation pattern hai jo flag pattern ki tarah hota hai, lekin isme flag ke bajaye ek jhalar ki tarah dekha jata hai. Ye pattern bhi trend ke continuation ki taraf ishara karta hai aur traders ke liye trading opportunities paida kar sakta hai.
- Symmetrical Triangle Pattern (Hamwar Tika Pattern): Symmetrical triangle pattern mein, currency price ek symmetrical triangle banata hai jiska matlab hai ke buying aur selling forces barabar hain. Is pattern ko dekhte hue traders expect karte hain ke price trend mein rehkar agey badhega, lekin ye uncertain hai ke ye upar jaega ya neeche. Isliye, is pattern ko trading ke liye breakout ka intezaar karna hota hai.
- Ascending Triangle Pattern (Uper Wala Tika Pattern): Ascending triangle pattern mein, currency price ek ascending triangle ya tika banata hai. Is pattern mein, resistance level horizontal hota hai aur support level upar ki taraf slope karta hai. Ye pattern usually bullish hota hai aur traders expect karte hain ke price upar ja kar trend ko continue karega.
- Descending Triangle Pattern (Neeche Wala Tika Pattern): Descending triangle pattern mein, currency price ek descending triangle ya tika banata hai. Is pattern mein, support level horizontal hota hai aur resistance level neeche ki taraf slope karta hai. Ye pattern usually bearish hota hai aur traders expect karte hain ke price neeche ja kar trend ko continue karega.
-
Shahid17Member
- Feb 2023
- 60
- 47
- 38
- 15 USD
Continuation Example and its sorts Assalam O Alaikum Dear companions and colleagues Continuation design aik qisam ka specialized examination design hai jo diagram ke investigation mein use kiya jata hai taakay brief time frame ke istehkaam ya tawaquf ke baad mojooda rujhan ke dobara shuru honay ki nishandahi ki ja sakay .at the end of the day, aik tasalsul ka namona batata hai ke latest thing arzi istehkaam ya islaah ki muddat ke terrible jari rehny ka imkaan hai. yeh pattrens dealer ko mumkina tijarti mawaqay faraham kar satky hain, kyun kay yeh latest thing ki simt aur taaqat ki nishandahi karny mein madad kar satky hain .aam Continuation Examples mein banners, pen, triangles aur mustateel shaamil hain. Banner aur design transient examples hain jo is waqt hotay hain hit qeematon mein taiz raftaar harkat hoti hai jis ke baad istehkaam ki muddat hoti hai, aam peak standard aik mustateel shakal banti hai. masalas aur mustateel taweel mudti design hain jo is waqt hotay hain poke qeemat aik makhsoos range ke andar ikathi hojati hai, aik masalas ya mustateel shakal banti hai .yeh note karna zaroori hai ke tasalsul ke design hamesha durust nahi hotay aur nakaam ho saktay hain, is liye un pitrnz ki bunyaad standard kiye gaye kisi bhi tijarti faislay ki tasdeeq ke liye deegar takneeki isharay aur tajzia istemaal karna zaroor hai. Continuation Example ki 2 sorts hain 1. Bullish Continuation Example 2. Negative Continuation Example. Neeche kuch aam continuation designs hain: Banner Example (Jhanda Example): Jhanda design ek aisa design hai jo ek pattern ke beech mein choti si rukawat ya rectification ko darust karta hai. Is design mein, cash cost ek banner ki tarah aik chhota square shape ya parallelogram banata hai, jo pattern ke continuation ki taraf ishara karta hai. Agar pattern pehle se upar ja raha hai, to ye bullish banner hai, aur agar pattern pehle se neeche ja raha hai, to ye negative banner hai. Flag Example (Jhalar Example): Jhalar design ek aur continuation design hai jo banner example ki tarah hota hai, lekin isme banner ke bajaye ek jhalar ki tarah dekha jata hai. Ye design bhi pattern ke continuation ki taraf ishara karta hai aur brokers ke liye exchanging open doors paida kar sakta hai. Even Triangle Example (Hamwar Tika Example): Balanced triangle design mein, money cost ek even triangle banata hai jiska matlab hai ke purchasing aur selling powers barabar hain. Is design ko dekhte tint merchants expect karte hain ke cost pattern mein rehkar agey badhega, lekin ye unsure hai ke ye upar jaega ya neeche. Isliye, is design ko exchanging ke liye breakout ka intezaar karna hota hai. Climbing Triangle Example (Uper Wala Tika Example): Rising triangle design mein, cash cost ek climbing triangle ya tika banata hai. Is design mein, obstruction level even hota hai aur support level upar ki taraf slant karta hai. Ye design normally bullish hota hai aur brokers expect karte hain ke cost upar ja kar pattern ko proceed karega. Slipping Triangle Example (Neeche Wala Tika Example): Slipping triangle design mein, cash cost ek diving triangle ya tika banata hai. Is design mein, support level flat hota hai aur opposition level neeche ki taraf slant karta hai. Ye design typically negative hota hai aur merchants expect karte hain ke cost neeche ja kar pattern ko proceed karega. -
HamnatariqJunior Member
- Mar 2023
- 3
Assalamu-Alaikum! Dear members Me umeed kerti hoke aap sb khair se hoge or ap sb ka forex trading py kam bahut acha chal rha hoga. Aj jis topic py hum baat kre gy wo Neeche mention hy.Forex Continuation Patterns (Forex Mein Jama Jama Nizam):Forex trading involves the analysis of price charts and patterns to make informed trading decisions. Continuation patterns are an essential part of technical analysis in Forex. These patterns provide traders with valuable information about potential future price movements. In Roman Urdu, let's delve into what continuation patterns are in the context of Forex trading.Continuation Patterns (Jama Jama Nizam)Continuation patterns are chart patterns that suggest a temporary pause or consolidation in the current price trend before the prevailing trend resumes. These patterns indicate that the market is taking a breather before continuing in the same direction. They are valuable to traders because they can help identify potential entry and exit points for trades.Here are some common continuation patterns in Forex tradingFlag Pattern (Jhanda Nizam) Flag patterns are characterized by a rectangular-shaped consolidation within a strong and steep price trend. In a bullish flag, the flagpole is an upward price movement, followed by a sideways or slightly downward consolidation. In a bearish flag, the flagpole is a downward price movement, followed by a sideways or slightly upward consolidation. Traders often enter trades when the price breaks out of the flag pattern in the direction of the previous trend.Pennant Pattern (Pennon Nizam) Pennant patterns are similar to flag patterns but have a triangular shape. They consist of converging trendlines that form a small symmetrical triangle. Like flags, bullish pennants appear after an upward trend, and bearish pennants appear after a downward trend. Traders anticipate a breakout in the direction of the prior trend when trading pennant patterns.Rectangle Pattern (Muttasil Nizam) Rectangle patterns are horizontal consolidation phases in a price chart. They are characterized by parallel support and resistance levels that create a rectangular shape. In a bullish rectangle, traders expect an upward breakout, and in a bearish rectangle, they anticipate a downward breakout. Entry points are typically chosen when the price breaks out of the rectangle Triangle Pattern (Tikona Nizam):** Triangle patterns consist of converging trendlines that form a triangle shape. There are three main types of triangles: ascending, descending, and symmetrical. Ascending triangles suggest potential bullish breakouts, descending triangles suggest bearish breakouts, and symmetrical triangles indicate an imminent move without specifying direction. Traders use trendline breaks to enter trades in triangle patterns.Wedge Pattern (Kona Nizam)Wedge patterns resemble triangles but slant either upward (rising wedge) or downward (falling wedge).Rising wedges often result in bearish breakouts, while falling wedges typically lead to bullish breakouts.Traders watch for the price to exit the wedge pattern before taking positions.In Forex trading, it's essential to remember that no pattern is 100% reliable, and risk management is crucial. Traders often use continuation patterns in conjunction with other technical indicators and analysis methods to make well-informed trading decisions. Additionally, it's vital to wait for confirmation through price movement beyond the pattern's boundaries before executing a trade based on a continuation pattern. -
AdeelyousifMember
- Sep 2023
- 57
- 2
- 5
Describe about Continuation Pattern in Forex Forex mein Continuation Pattern ka matlab hota hai ke jab market trend ek specific direction mein move kar raha hota hai, to yeh pattern indicate karta hai ke yeh trend jari rahega aur phir se wohi direction mein move karega. Continuation patterns traders ke liye useful hote hain kyunki woh market mein hone wale future moves ko anticipate karne mein madadgar hote hain.Kuch aam continuation patterns hain: Flag Pattern: Flag pattern ek small rectangle-shaped pattern hota hai, jo market mein ek strong uptrend ya downtrend ke baad aata hai. Uptrend ke case mein, flag pattern usually neeche jhukta hai, jabki downtrend mein woh upar jhukta hai. Is pattern ke baad market usually apni previous trend mein wapas chala jata hai.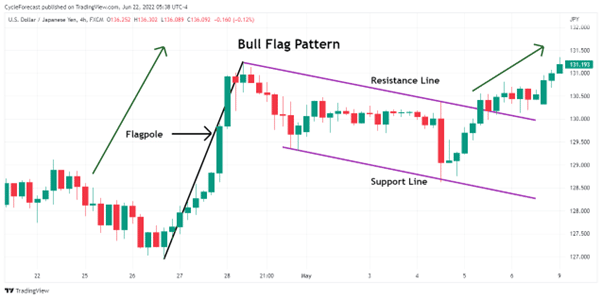 Pennant Pattern: Pennant pattern ek triangle-shaped pattern hota hai, jo flag pattern ki tarah hota hai, lekin iska shape triangular hota hai. Yeh pattern bhi market trend ko confirm karne mein madadgar hota hai.
 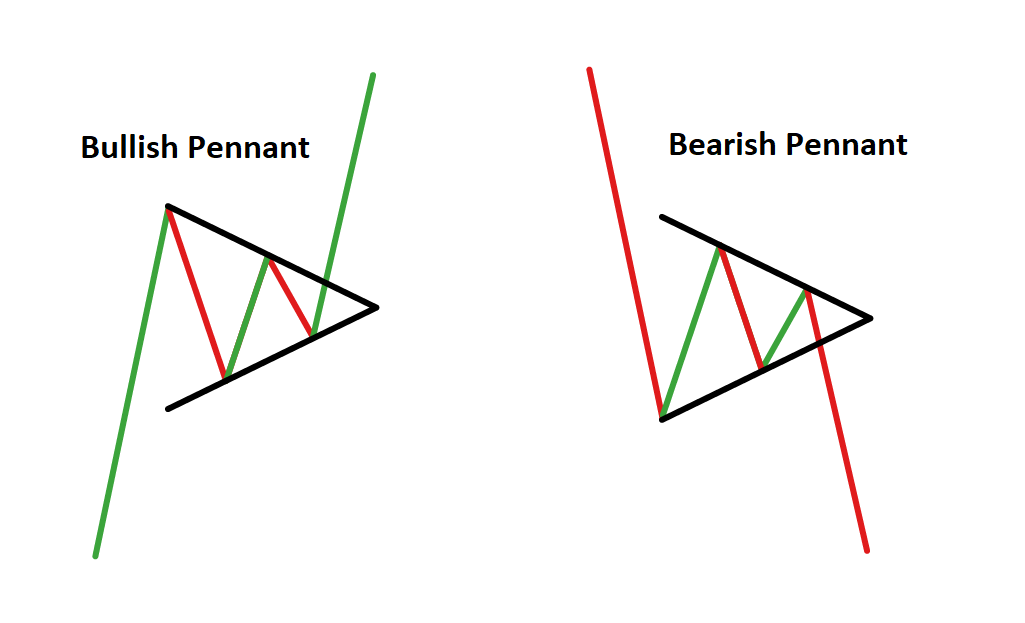 Head and Shoulders Continuation Pattern: Is pattern mein, market mein ek "head" aur "shoulders" jaise peaks aur dips hoti hain, jo ek specific trend ke andar aati hain. Yeh pattern usually trend reversal ko indicate karta hai, lekin kabhi-kabhi yeh bhi continuation pattern ban sakta hai, jab market wapas apne previous trend mein move karti hai. Symmetrical Triangle: Symmetrical triangle ek pattern hota hai jo market mein consolidation phase ke baad aata hai. Is pattern mein prices ek triangle ke andar move karte hain, lekin jab yeh pattern complete hota hai, to market usually apne previous trend mein move karta hai.Yeh patterns traders ko market ki future movement ko samajhne mein madadgar hote hain. Traders in patterns ka istemal karke entry aur exit points decide karte hain, aur risk management ko improve karne mein bhi madad milti hai. Lekin yaad rahe ke forex market mein koi bhi pattern 100% confirm nahi hota, isliye proper risk management ka bhi khayal rakhna zaroori hai.
-
<a href="https://www.instaforex.org/ru/?x=ruforum">InstaForex</a> -
Hussain12Senior Member
- Jan 2022
- 190
- 444
- 300
- 469 USD
Describe about Continuation Pattern in ForexForex me Continuation Pattern ek technical analysis tool hai jo price charts par dikhe patterns ke madhyam se existing price trend ke continuation ko suggest karta hai. In patterns ko traders use karte hain taki woh market ke current trend ke direction me hone wale price movements ko anticipate kar saken. Ye patterns ya to bullish (price upar jane ki tendency) ya bearish (price niche jane ki tendency) hote hain, aur traders inhe trend continuation ke liye samjhkar trading decisions lete hain. Niche kuch common Forex continuation patterns hain: Flag Pattern: Flag pattern ek continuation pattern hota hai jo normally ek strong price trend ke baad aata hai. Isme price ka ek sharp move hota hai, jise flagpole kehte hain, aur uske baad ek rectangular consolidation hoti hai, jo flag ke roop me dikhti hai. Traders flag pattern ke baad initial trend ke direction me hone wale breakout ko dekhte hain. Bullish Flag: Bullish flag ek uptrend ke dauran banta hai aur aksar ek upward breakout ke baad hota hai. Bearish Flag: Bearish flag ek downtrend ke dauran banta hai aur aksar ek downward breakout ke baad hota hai. Pennant Pattern: Pennant pattern flag pattern ki tarah hota hai, lekin yeh ek chota symmetrical triangle-shaped consolidation hai. Yeh bhi ek strong price move ke baad aata hai aur suggest karta hai ki previous trend breakout ke baad continue ho sakta hai. Bullish Pennant: Bullish pennant uptrend ke dauran banta hai aur ek potential upward breakout ko indicate karta hai. Bearish Pennant: Bearish pennant downtrend ke dauran banta hai aur ek potential downward breakout ko suggest karta hai. Ascending Triangle: Ascending triangle ek bullish continuation pattern hota hai jisme ek flat resistance level aur ek rising support trendline hoti hai. Traders is triangle se upward breakout ki taraf ki ummeed rakhte hain, jo uptrend ke continuation ko signal karta hai. Descending Triangle: Descending triangle ek bearish continuation pattern hota hai jisme ek flat support level aur ek declining resistance trendline hoti hai. Traders is triangle se downward breakout ki taraf ki ummeed rakhte hain, jo downtrend ke continuation ko indicate karta hai. Symmetrical Triangle: Symmetrical triangle ek neutral continuation pattern hota hai jisme do converging trendlines ek symmetrical triangle shape banate hain. Isse ye suggest hota hai ki dono dishaon me breakout ho sakta hai, previous trend ke continuation ke sath. Cup and Handle: Cup and handle pattern ek bullish continuation pattern hota hai. Isme price ka shape ek teacup jaisa hota hai jisme ek rounded bottom (cup) ke baad ek smaller consolidation (handle) hota hai. Traders handle se hone wale breakout ke baad long positions me enter karte hain. Ye continuation patterns Forex traders ke liye valuable tools hote hain jo unhe informed trading decisions lene me madad karte hain. Lekin dhyan rahe ki koi bhi pattern ya indicator 100% sahi nahi hota hai, isliye traders ko risk management strategies, stop-loss orders, aur dusre technical analysis tools ka bhi istemal karna chahiye taki unke trading results behtar ho sake. Sath hi, Forex trading me market conditions, economic events, aur geopolitical factors ka bhi dhyan rakhna mahatvapurn hai.

اب آن لائن
Working...
تبصرہ
Расширенный режим Обычный режим