Neckline Candlestick Pattren in Forex Trading .
-
Pips_StudentsSenior Member

- Nov 2020
- 5898
- 76
- 5642
- 4 001 USD
-
<a href="https://www.instaforex.org/ru/?x=ruforum">InstaForex</a> -
Pips_StudentsSenior Member
- Nov 2020
- 5898
- 76
- 5642
- 4 001 USD
Neckline Candlestick Pattern: Candlestick patterns, ek trading technique hain jo traders aur investors istemal karte hain. Ye patterns price charts par dikhaye jate hain aur market ke future movement ko predict karne mein madadgar sabit ho sakte hain. Neckline candlestick pattern ek specific type ka candlestick pattern hota hai jo kisi larger trend ke part ke roop mein dikhta hai. Ye pattern typically double top ya double bottom formations ke sath juda hota hai. Ismein do candlesticks hote hain, jo ek support ya resistance level ko represent karte hain. Neckline Candlestick Pattern Kaise Kaam Karta Hai: Neckline candlestick pattern kaam kuch is tarah se karta hai: 1. Double Top Formation: Agar yeh pattern double top formation ke sath aata hai, to pehle candlestick price mein ek peak ya high point ko darust karta hai. Dusra candlestick ise repeat karta hai, lekin yeh peak pehle wale se kam hota hai. Isse ek resistance level ya "neckline" ban jata hai. 2. Double Bottom Formation: Agar yeh pattern double bottom formation ke sath aata hai, to pehle candlestick price mein ek low point ko darust karta hai. Dusra candlestick ise repeat karta hai, lekin yeh low point pehle wale se zyada hota hai. Isse ek support level ya "neckline" ban jata hai. Trading Main Neckline Candlestick Pattern Istemal Karna: Traders is pattern ko market analysis mein istemal kar sakte hain. Agar neckline candlestick pattern double top ke sath aata hai, to yeh bearish signal ho sakta hai, aur traders sell positions le sakte hain. Agar yeh pattern double bottom ke sath aata hai, to yeh bullish signal ho sakta hai, aur traders buy positions le sakte hain. Har trading technique ki tarah, neckline candlestick pattern bhi mazbootiyaat aur ehtiyaat ke sath istemal karna zaroori hai. Hamesha risk management aur stop-loss orders ka istemal karein taaki trading losses se bacha ja sake. Conclusion: In conclusion, neckline candlestick pattern ek mahatvapurna trading tool ho sakta hai, lekin traders ko iska istemal samajhdari se karna chahiye aur market analysis ke sath-sath dusre technical indicators ka bhi sahara lena chahiye. -
SnoSenior Member
- Sep 2020
- 1861
- 16
- 265
- 592 USD
InstaSpot: کسی بھی EPS اور بینک سے منافع واپس لیں، اور EPS اور cryptocurrencies کے تبادلے پر 7% تک کمائیں۔
Forex Trading & Neckline Candlestick pattern. Forex Trading mein Candlestick Patterns ka istemal aam hai aur is mein Neckline Candlestick Pattern bhi shamil hai. Is article mein hum Neckline Candlestick Pattern ke bare mein Roman Urdu mein tafseel se batayenge. Neckline Candlestick Pattern Anylesis. Neckline Candlestick Pattern ek technical analysis tool hai jo price action ke sath sath trend reversal ke bare mein bata ta hai. Ye pattern Bullish aur Bearish dono trend ke liye kaam karta hai. Is pattern mein do Candlesticks hotey hain, ek Bullish aur ek Bearish. Bullish Candlestick ka size chota hota hai aur woh Bearish Candlestick se pehley banta hai. Isi tarah Bearish Candlestick ka size bara hota hai aur woh Bullish Candlestick se pehley banta hai. Neckline Candlestick Pattern Wotks. Is pattern ka istemal trend reversal ke liye hota hai. Agar price action Bullish trend se Bearish trend mein jata hai to Neckline Candlestick Pattern ka istemal kiya jata hai. Agar Bullish Candlestick aur Bearish Candlestick ke beech ka gap bara hai to yeh trend reversal ka signal hai. Agar Bullish trend mein gap bara hai to yeh Bearish trend ka signal hai aur agar Bearish trend mein gap bara hai to yeh Bullish trend ka signal hai. Neckline Candlestick Pattern ka istemal karne ke liye aap ko price action ko observe karna hoga aur phir is pattern ke signals ko samajhna hoga. Manage Risk. Neckline Candlestick Pattern Forex Trading mein trend reversal ke liye ek important technical analysis tool hai. Is pattern ka istemal karne ke liye aap ko price action ko observe karna hoga aur phir is pattern ke signals ko samajhna hoga. Agar aap is pattern ko theek se samajh lein to aap Forex Trading mein successful ho saktey hain. -
Km2006Senior Member
- Mar 2022
- 1260
- 72
- 152
- 1 117 USD
Neckline Candlestick Pattern in Forex Trading Assalam O Alaikum Dear Forex traders forex trading ky analysis ky liye sub se ziyada use hony waly chart ko Neckline candlestick chart pattern kaha jata hai jo bahot easy hai aor japan se is ka aghaz huwa or is me apko bhi ab tk samjh a gya ho ga ke ye pattern kitna important hai is ko istemal krna is ky bahot sary faidy hain. Apko forex trading chart py jub bhi head and shoulder pattern bnta nazar aye aor usky head ky opposite side py below side jo straight line bnti hai usko neck line kaha jata hai aor yeh zaroori nhi hai ky horizontal he ho wo thori teri bhi ho skti hai apko candlestick chart ko understand krna ana chahiye candlestick chart ma bajot sari information hoti hain aik single candle bhi market ma apko kafi sari information provide kr skti hai apko market ky bary ma hidden secrets ka ilm hina chye tb he ao achy professional trader bn skty ho Understanding of Neckline Candlestick Pattern in Forex Trading Dear friends and Forex members neckline ko samjny k liye sb se phly iski definition ko jan,na zaroori hai is se hum ko asani ho jye ge is ko samjhny ke liye. Neckline aik h level hota ha support or resistance ka jo ap head and shoulders pattern per dekh sakty han jo traders use krty han in order to determine strategic areas to place orders. Jab price neckline se oper ja rhi hoti hai or us ke bad us me reversal trend ni hota us ma continues rehta ha usy in neck line kaha jata ha. Importance of Neckline Candlestick Pattern in Forex Trading Dear Friends market Mein jitni bhi candlesticks hoti hai yeh apko bahot achy tareeky se market ki next movement ko indicate kar rahi hoti hai is liye apko chahiye ki aap in ko properly learn Karen Taky ap market ko asani ke sath samajhne ki situation Mein a jaen jab tak ap in ko achi Tarah Nahin samajh lete ap kabhi bhi achi trading nahin kar sakty is liye neckline ki importance Se Koi Banda Inkar nahin kar sakta. -
Asim14Senior Member
- Sep 2023
- 794
- 25
- 185
- 326 USD
Neckline Candlestick Pattren in Forex Trading . Neckline Candlestick Pattern Forex trading mein ek aam candlestick pattern hai jo technical analysis mein istemal hota hai. Ye pattern primarily reversal signals provide karta hai, yaani ke market direction mein aik possible change ko indicate karta hai. Neckline Candlestick Pattern ka aam taur par doosre technical indicators aur price action patterns ke saath istemal hota hai. Neckline Candlestick Pattern ka basic structure aksar ek bearish (downward) trend ke beech hota hai, aur ye pattern doosre bearish candlestick patterns ke saath mil kar ek reversal pattern banata hai. Is pattern mein usually teen candlesticks hote hain:- Pehla Candlestick: Ye pattern typically ek bearish candlestick ke saath shuru hota hai, jo indicate karta hai ke market mein selling pressure hai.
- Dusra Candlestick: Dusra candlestick, jo ek bullish (upward) candlestick hota hai, pehle candlestick ke nichle hisse mein close karta hai. Ye bullish candlestick, market mein buying pressure ko darust karti hai.
- Teesra Candlestick: Teesra candlestick dobara bearish hota hai aur pehle candlestick ke close level ke neeche close hota hai. Isi ko Neckline Candlestick Pattern kehte hain. Is candlestick ka close pehle candlestick ke close level ke neeche hota hai, ye bearish reversal ko suggest karta hai aur traders ko market direction ke possible change ki taraf ishara karta hai.
-
IkramrashidMember
- Sep 2023
- 35
- 1
InstaSpot: کسی بھی EPS اور بینک سے منافع واپس لیں، اور EPS اور cryptocurrencies کے تبادلے پر 7% تک کمائیں۔
Neck area Candle Pattren in Forex Exchanging . Neck area Candle Pattren in Forex Exchanging . Neck area Candle Example Forex exchanging mein ek aam candle design hai jo specialized investigation mein istemal hota hai. DESGIN: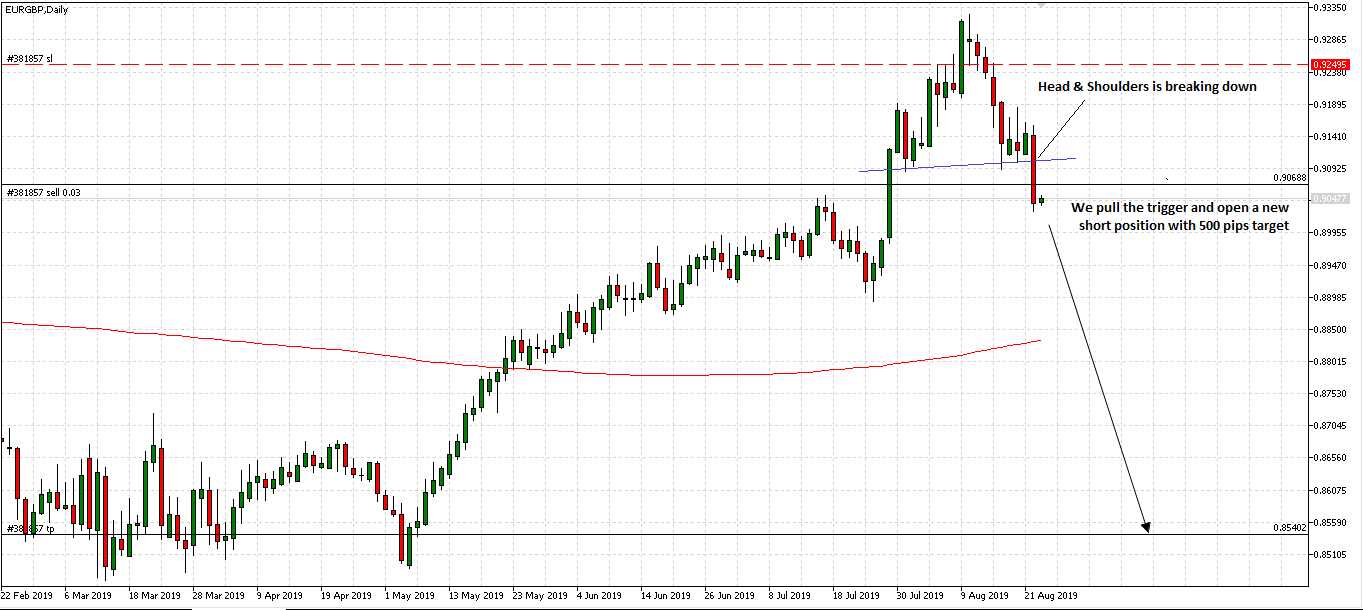 Ye design principally inversion signals give karta hai, yaani ke market course mein aik conceivable change ko demonstrate karta hai. Neck area Candle Example ka aam taur standard doosre specialized markers aur cost activity designs ke saath istemal hota hai.Neck area Candle Example ka essential design aksar ek negative (descending) pattern ke beech hota hai, aur ye design doosre negative candle designs ke saath mil kar ek inversion design banata hai. Is design mein generally high schooler candles hote hain:
  Pehla Candle: Ye design ordinarily ek negative candle ke saath shuru hota hai, jo show karta hai ke market mein selling pressure hai Dusra Candle: Dusra candle, jo ek bullish (up) candle hota hai, pehle candle ke nichle hisse mein close karta hai. Ye bullish candle, market mein purchasing pressure ko darust karti hai. Teesra Candle: Teesra candle dobara negative hota hai aur pehle candle ke close level ke neeche close hota hai. Isi ko Neck area Candle Example kehte hain. Is candle ka close pehle candle ke close level ke neeche hota hai, ye negative inversion ko recommend karta hai aur dealers ko market course ke conceivable change ki taraf ishara karta hai. EXAMPLE: Neck area Candle Example, ek negative pattern ke baad bullish inversion ka sign deta hai, aur dealers isko market examination mein istemal karte hain taki woh potential passage aur leave focuses ka pata lagakar exchanging choices le saken. Lekin yaad rahe ke kisi bhi design ko exchanging mein istemal karne se pehle, aapko doosre specialized pointers aur market investigation apparatuses ka bhi istemal karna chahiye, aur risk the executives ka khayal rakhna zaroori hai.Yad rahe ke market mein kisi bhi design ke 100 percent sharpen ka koi ensure nahi hota, isliye hamesha risk the board aur stop-misfortune orders ka istemal karna zaroori hai. Exchanging mein safalta hasil karne ke liye aapko acchi tarah se study aur practice karni chahiye.
-
Trading_EmpireMember
- Sep 2023
- 40
- 1
- 39
Neckline Candle Chart Pattern: Neckline Candlestick Pattern or Neck area Candle Example, ek negative pattern ke baad bullish inversion ka sign deta hai, aur dealers isko market investigation mein istemal karte hain taki woh potential section aur leave focuses ka pata lagakar exchanging choices le saken. Lekin yaad rahe ke kisi bhi design ko exchanging mein istemal karne se pehle, aapko doosre specialized pointers aur market investigation instruments ka bhi istemal karna chahiye, aur risk the executives ka khayal rakhna zaroori hai market mein kisi bhi design ke 100 percent sharpen ka koi ensure nahi hota, isliye hamesha risk the board aur stop-misfortune orders ka istemal karna zaroori hai. Exchanging mein safalta hasil karne ke liye aapko acchi tarah se study aur practice karni chahiye.candlestick dobara negative hota hai aur pehle candle ke close level ke neeche close hota hai. Isi ko Neck area Candle Example kehte hain. Is candle ka close pehle candle ke close level ke neeche hota hai, ye negative inversion ko recommend karta hai aur dealers ko market heading ke conceivable change ki taraf ishara karta hai.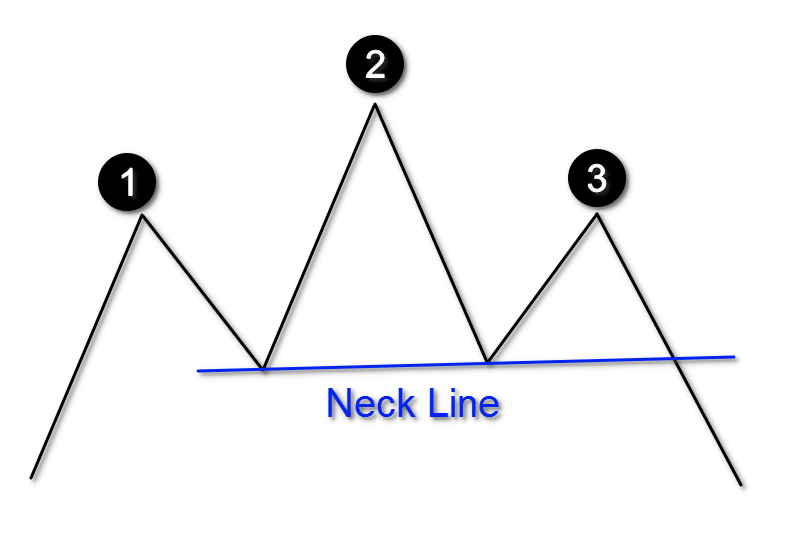 Candle Example Forex exchanging mein ek aam candle design hai jo specialized examination mein istemal hota hai. Ye design fundamentally inversion signals give karta hai, yaani ke market course mein aik conceivable change ko show karta hai. Neck area Candle Example ka aam taur standard doosre specialized pointers aur cost activity designs ke saath istemal hota hai.Neckline Candle Example ka essential construction aksar ek negative (descending) pattern ke beech hota hai, aur ye design doosre negative candle designs ke saath mil kar ek inversion design banata hai.Is design mein generally adolescent candles hote hain ye design normally ek negative candle ke saath shuru hota hai, jo demonstrate karta hai ke market mein selling pressure hai.Dusra candle, jo ek bullish (up) candle hota hai, pehle candle ke nichle hisse mein close karta hai. Ye bullish candle, market mein purchasing pressure ko darust karti hai. Candles Pattern Ki Formation: Candle Pattern or Example Forex Exchanging mein pattern inversion ke liye ek significant specialized device hai. Is design ka istemal karne ke liye aap ko cost activity ko notice karna hoga aur phir is design ke signals ko samajhna hoga. Agar aap is design ko theek se samajh lein to aap Forex Exchanging mein fruitful ho saktey hain.Agar Bullish Candle aur Negative Candle ke beech ka hole bara hai to yeh pattern inversion ka signal hai. Agar Bullish pattern mein hole bara hai to yeh Negative pattern ka signal hai aur agar Negative pattern mein hole bara hai to yeh Bullish pattern ka signal hai.Is design mein do Candles hotey hain, ek Bullish aur ek Negative. Bullish Candle ka size chota hota hai aur woh Negative Candle se pehley banta hai. Isi tarah Negative Candle ka size bara hota hai aur woh Bullish Candle se pehley banta hai.Is design ka istemal pattern inversion ke liye hota hai. Agar cost activity Bullish pattern se Negative pattern mein jata hai to Neck area Candle Example ka istemal kiya jata hai.
 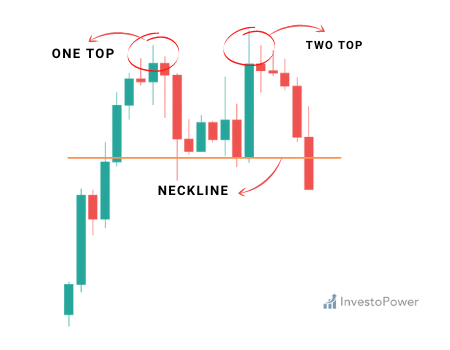 Design ek specialized investigation apparatus hai jo cost activity ke sath pattern inversion ke uncovered mein bata ta hai. Ye design Bullish aur Negative dono pattern ke liye kaam karta hai.Har exchanging method ki tarah, neck area candle design bhi mazbootiyaat aur ehtiyaat ke sath istemal karna zaroori hai. Hamesha risk the board aur stop-misfortune orders ka istemal karein taaki exchanging misfortunes se bacha ja purpose neck area candle design ek exchanging apparatus ho sakta hai, lekin dealers ko iska istemal samajhdari se karna chahiye aur market investigation ke sath dusre specialized pointers ka bhi sahara lena chahiye.Traders is design ko market examination mein istemal kar sakte hain. Agar neck area candle design twofold top ke sath aata hai, to yeh negative sign ho sakta hai, aur merchants sell positions le sakte hain. Agar yeh design twofold base ke sath aata hai, to yeh bullish sign ho sakta hai, aur brokers purchase positions le sakte hain. Candles Chart Trading: Neck area candle design ek explicit sort ka candle design hota hai jo kisi bigger pattern ke part ke roop mein dikhta hai. Ye design normally twofold top ya twofold base developments ke sath juda hota hai. Ismein do candles hote hain, jo ek support ya obstruction level ko address karte hain.Neckline candle design kaam kuch is tarah se karta hai design twofold top development ke sath aata hai, to pehle candle cost mein ek top ya high point ko darust karta hai. Dusra candle ise rehash karta hai, lekin yeh top pehle rib se kam hota hai. Isse ek opposition level ya "neck area" boycott jata hai. Agar yeh design twofold base arrangement ke sath aata hai, to pehle candle cost mein ek depressed spot ko darust karta hai. Dusra candle ise rehash karta hai, lekin yeh depressed spot pehle rib se zyada hota hai. Isse ek support level ya "neck area" boycott jata hai.
 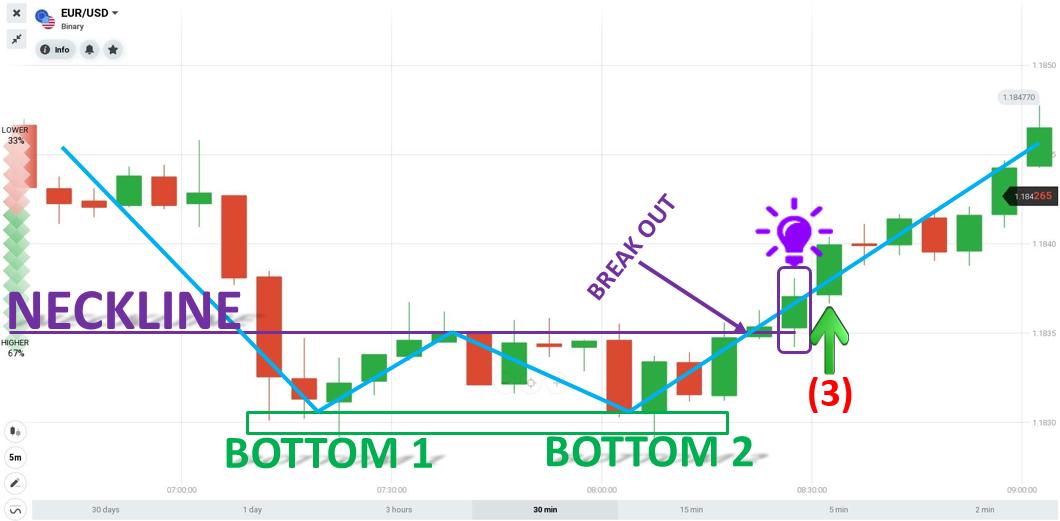 v Neckline candle design exchanging mein aam istemaal sharpen wala aik specialized device hai. Yeh aik aham cost development ke baad banta hai, khaas karke poke cost downtrend mein hai. Yeh design adolescent candles se banta hai aur iski pehchan lambi dark ya red candle se hoti hai, jiske baad ek choti candle aati hai jo pehle wali candle se nichli taraf hole banati hai, aur phir ek lambi white ya green candle aati hai jo choti candle ki high se upar close karti hai. Is design ko iski tashkeel saaf karne wali choti candle ke neck area ki wajah se iska naam mila hai.Neck Line design ki tashkeel downtrend mein inversion aur potential bullish development ki soorat mein ishara deti hai. Yeh iska zahiri matlab hai ke selling pressure samapt ho chuki hai aur purchasers ko control milne laga hai. Is design ki tashkeel ko merchants aur purchasers ke beech ki ladhayi ki tarah bhi dekh sakte hai, jahan pehle venders rule karte hai phir purchasers unhe hara dete hai.
-
Aqib216Member
- Sep 2023
- 34
- 1
- 29
Neck area Light Graph Example: Neck area Candle Example or Neck region Light Model, ek negative example ke baad bullish reversal ka sign deta hai, aur sellers isko market examination mein istemal karte hain taki woh potential segment aur leave centers ka pata lagakar trading decisions le saken. Lekin yaad rahe ke kisi bhi plan ko trading mein istemal karne se pehle, aapko doosre specific pointers aur market examination instruments ka bhi istemal karna chahiye, aur risk the chiefs ka khayal rakhna zaroori hai market mein kisi bhi plan ke 100% hone ka koi guarantee nahi hota, isliye hamesha risk the board aur stop-incident orders ka istemal karna zaroori hai. Trading mein safalta hasil karne ke liye aapko acchi tarah se study aur practice karni chahiye.candlestick dobara negative hota hai aur pehle light ke close level ke neeche close hota hai. Isi ko Neck region Light Model kehte hain. Is light ka close pehle flame ke close level ke neeche hota hai, ye negative reversal ko suggest karta hai aur sellers ko market heading ke possible change ki taraf ishara karta hai.Light Model Forex trading mein ek aam candle plan hai jo specific assessment mein istemal hota hai. Ye plan generally reversal signals give karta hai, yaani ke market course mein aik possible change ko show karta hai. Neck region Flame Model ka aam taur standard doosre specific pointers aur cost movement plans ke saath istemal hota hai.Neckline Candle Model ka fundamental development aksar ek negative (slipping) design ke beech hota hai, aur ye plan doosre negative candle plans ke saath mil kar ek reversal plan banata hai.Is plan mein for the most part juvenile candles hote hain ye plan ordinarily ek negative light ke saath shuru hota hai, jo show karta hai ke market mein selling pressure hai.Dusra candle, jo ek bullish (up) candle hota hai, pehle candle ke nichle hisse mein close karta hai. Ye bullish candle, market mein buying pressure ko darust karti hai. Candles Example Ki Arrangement: Light Example or Model Forex Trading mein design reversal ke liye ek huge specific gadget hai. Is plan ka istemal karne ke liye aap ko cost action ko notice karna hoga aur phir is plan ke signals ko samajhna hoga. Agar aap is plan ko theek se samajh lein to aap Forex Trading mein productive ho saktey hain.Agar Bullish Flame aur Negative Light ke beech ka opening bara hai to yeh design reversal ka signal hai. Agar Bullish example mein opening bara hai to yeh Negative example ka signal hai aur agar Negative example mein opening bara hai to yeh Bullish example ka signal hai.Is plan mein do Candles hotey hain, ek Bullish aur ek Negative. Bullish Light ka size chota hota hai aur woh Negative Flame se pehley banta hai. Isi tarah Negative Candle ka size bara hota hai aur woh Bullish Flame se pehley banta hai.Is plan ka istemal design reversal ke liye hota hai. Agar cost action Bullish example se Negative example mein jata hai to Neck region Flame Model ka istemal kiya jata hai.
Plan ek particular examination mechanical assembly hai jo cost movement ke sath design reversal ke revealed mein bata ta hai. Ye plan Bullish aur Negative dono design ke liye kaam karta hai.Har trading strategy ki tarah, neck region candle plan bhi mazbootiyaat aur ehtiyaat ke sath istemal karna zaroori hai. Hamesha risk the board aur stop-adversity orders ka istemal karein taaki trading disasters se bacha ja reason neck region candle plan ek trading contraption ho sakta hai, lekin vendors ko iska istemal samajhdari se karna chahiye aur market examination ke sath dusre particular pointers ka bhi sahara lena chahiye.Traders is plan ko market assessment mein istemal kar sakte hain. Agar neck region candle configuration twofold top ke sath aata hai, to yeh negative sign ho sakta hai, aur vendors sell positions le sakte hain. Agar yeh configuration twofold base ke sath aata hai, to yeh bullish sign ho sakta hai, aur specialists buy positions le sakte hain. Candles Outline Exchanging: Neck region light plan ek express sort ka candle plan hota hai jo kisi greater example ke part ke roop mein dikhta hai. Ye configuration typically twofold top ya twofold base advancements ke sath juda hota hai. Ismein do candles hote hain, jo ek support ya block level ko address karte hain.Neckline candle plan kaam kuch is tarah se karta hai configuration twofold top advancement ke sath aata hai, to pehle flame cost mein ek top ya high point ko darust karta hai. Dusra flame ise repeat karta hai, lekin yeh top pehle rib se kam hota hai. Isse ek resistance level ya "neck region" blacklist jata hai. Agar yeh configuration twofold base game plan ke sath aata hai, to pehle flame cost mein ek discouraged spot ko darust karta hai. Dusra flame ise reiterate karta hai, lekin yeh discouraged spot pehle rib se zyada hota hai. Isse ek support level ya "neck region" blacklist jata hai. Neck area flame configuration trading mein aam istemaal hone wala aik specific gadget hai. Yeh aik aham cost advancement ke baad banta hai, khaas karke jab cost downtrend mein hai. Yeh plan young adult candles se banta hai aur iski pehchan lambi dim ya red candle se hoti hai, jiske baad ek choti flame aati hai jo pehle wali light se nichli taraf opening banati hai, aur phir ek lambi white ya green candle aati hai jo choti candle ki high se upar close karti hai. Is plan ko iski tashkeel saaf karne wali choti light ke neck region ki wajah se iska naam mila hai.Neck Line plan ki tashkeel downtrend mein reversal aur potential bullish advancement ki soorat mein ishara deti hai. Yeh iska zahiri matlab hai ke selling pressure samapt ho chuki hai aur buyers ko control milne laga hai. Is plan ki tashkeel ko vendors aur buyers ke beech ki ladhayi ki tarah bhi dekh sakte hai, jahan pehle merchants rule karte hai phir buyers unhe hara dete hai.
-
Shahid17Member
- Feb 2023
- 60
- 47
- 38
- 15 USD
InstaSpot: کسی بھی EPS اور بینک سے منافع واپس لیں، اور EPS اور cryptocurrencies کے تبادلے پر 7% تک کمائیں۔
Neck area Candle Example in Forex Exchanging Assalam O Alaikum Dear Forex brokers forex exchanging ky examination ky liye sub se ziyada use hony waly diagram ko Neck area candle graph design kaha jata hai jo bahot simple hai aor japan se is ka aghaz huwa or is me apko bhi stomach muscle tk samjh a gya ho ga ke ye design kitna significant hai is ko istemal krna is ky bahot sary faidy hain. Apko forex exchanging graph py jub bhi head and shoulder design bnta nazar affirmative aor usky head ky inverse side py beneath side jo straight line bnti hai usko neck line kaha jata hai aor yeh zaroori nhi hai ky even he ho wo thori teri bhi ho skti hai apko candle outline ko comprehend krna ana chahiye candle diagram mama bajot sari data hoti hain aik single light bhi market mama apko kafi sari data give kr skti hai apko market ky bary mama stowed away privileged insights ka ilm hina chye tb he ao throbbing proficient merchant bn skty ho Neck area Candle Example Anylesis. Neck area Candle Example ek specialized investigation apparatus hai jo cost activity ke sath pattern inversion ke uncovered mein bata ta hai. Ye design Bullish aur Negative dono pattern ke liye kaam karta hai. Significance of Neck area Candle Example in Forex Exchanging Dear Companions market Mein jitni bhi candles hoti hai yeh apko bahot pain-filled tareeky se market ki next development ko demonstrate kar rahi hoti hai is liye apko chahiye ki aap in ko appropriately learn Karen Taky ap market ko asani ke sath samajhne ki circumstance Mein a jaen hit tak ap in ko achi Tarah Nahin samajh lete ap kabhi bhi achi exchanging nahin kar sakty is liye neck area ki significance Se Koi Banda Inkar nahin kar sakta. End: All in all, neck area candle design ek mahatvapurna exchanging apparatus ho sakta hai, lekin brokers ko iska istemal samajhdari se karna chahiye aur market examination ke sath dusre specialized pointers ka bhi sahara lena chahiye. -
Fatima12Senior Member
- Feb 2024
- 213
- 43
- 75 USD
Neckline Candlestick Pattern in Forex Trading:
Neckline Candlestick Pattern Kya Hai?
Neckline candlestick pattern ek bearish reversal pattern hai jo forex trading mein dekha jata hai. Ye pattern usually bullish trend ke doran develop hota hai aur bearish trend ka indication deta hai.
Neckline Candlestick Pattern Ki Tashkhees:- Ye pattern ek uptrend ke doran develop hota hai.
- Pehle, market mein ek bullish trend hota hai.
- Phir, ek bearish candle develop hoti hai jo pehle ke bullish candles ke upar close hoti hai, lekin iski body small hoti hai aur iske shadows zyada hote hain.
- Doosri candle (confirmatory candle) ek bearish candle hoti hai jo pehli candle ke neeche close hoti hai aur iski body pehli candle ki body se zyada hoti hai.
- Doosri candle ke close ke neeche jo support level hota hai, use neckline kehte hain.
Neckline Candlestick Pattern Ka Istemal:
Neckline candlestick pattern ko traders reversal signals ke liye istemal karte hain. Jab ye pattern develop hota hai, traders expect karte hain ke market ka trend change hone wala hai aur bearish trend shuru hone wala hai.
Traders is pattern ke confirm hone ka wait karte hain jab doosri candle close ke neeche support level (neckline) ko break karti hai. Iske baad, wo short positions enter karte hain ya existing long positions ko close karte hain.
Conclusion:
Neckline candlestick pattern ek bearish reversal pattern hai jo traders ko market trends aur reversals ke baray mein maloomat faraham karta hai. Is pattern ko samajhna traders ke liye zaroori hai taake wo sahi waqt par trading decisions le sakein aur market mein successful trading kar sakein.
-
5ZainabSenior Member
- Feb 2024
- 142
- 18
- 12
- 24 USD
Heading: Neckline Candlestick Pattern Forex Trading Mein
Neckline Candlestick Pattern forex trading mein ek mahatvapurna technical analysis pattern hai jo traders ko trend reversals aur market ke potential directions ke baare mein suchit karta hai. Chaliye dekhte hain ki Neckline Candlestick Pattern kya hota hai aur uska istemal kaise kiya jaata hai.
Neckline Candlestick Pattern Kya Hai?
Neckline Candlestick Pattern ek chart pattern hai jismein ek line ya level ko connect kiya jata hai jo price movement ke barabar hota hai. Yeh pattern generally head and shoulders ya double top/bottom patterns ke saath dekha jaata hai aur reversal indications provide karta hai.
Kaise Pehchanein Neckline Candlestick Pattern:- Head and Shoulders Pattern: Neckline Candlestick Pattern commonly head and shoulders pattern ke saath dekha jaata hai. Ismein price action ek "head" aur do "shoulders" form karta hai, aur neckline inke beech connect hota hai.
- Double Top/Bottom Pattern: Agar double top pattern ya double bottom pattern mein neckline connect kiya jaata hai, toh woh bhi Neckline Candlestick Pattern ban sakta hai. Ismein price action ek level ko do baar touch karta hai aur phir reversal hota hai.
Kaise Istemal Karein Neckline Candlestick Pattern:- Confirmation ke liye dekhein: Neckline Candlestick Pattern ko confirm karne ke liye, traders ko additional indicators aur price action ko dekhna chahiye. Agar neckline ke breakout ke saath hi volume bhi increase hota hai, toh yeh pattern kaafi strong hota hai.
- Entry aur Exit Points ke Liye Use Karein: Neckline Candlestick Pattern ko entry aur exit points tay karte waqt istemal kiya ja sakta hai. Agar neckline ko breakout hua, toh traders long positions le sakte hain (agar bullish pattern hai) ya short positions le sakte hain (agar bearish pattern hai).
- Stop Loss Aur Target Levels Ke Liye Istemal Karein: Neckline Candlestick Pattern ko stop loss aur target levels tay karte waqt bhi istemal kiya ja sakta hai. Stop loss ko thik neckline ke neeche rakha ja sakta hai (long positions ke liye) ya neckline ke upar (short positions ke liye).
Nateeja:
Neckline Candlestick Pattern forex trading mein ek ahem tool hai jo traders ko trend reversals aur potential market directions ke baare mein suchit karta hai. Iske istemal se traders apne trading strategies ko improve kar sakte hain aur market ke movements ko sahi se analyze karke trading decisions le sakte hain. Isliye, har trader ko Neckline Candlestick Pattern ke bare mein gahra gyaan hona chahiye taki wo market ke saath kadam se kadam mila sake aur safalta ki aur agrasar ho sake.
-
Rizwan786@Senior Member
- Apr 2023
- 493
- 9
- 27
- 136 USD
InstaSpot: کسی بھی EPS اور بینک سے منافع واپس لیں، اور EPS اور cryptocurrencies کے تبادلے پر 7% تک کمائیں۔
"Neckline Candlestick Pattern" kisi standard technical analysis term nahi hai, lekin aap shayad "Neckline" aur "Candlestick Pattern" do alag-alag concepts ko ek saath istemal kar rahe hain.
Neckline
Neckline, technical analysis mein ek aham concept hai jo chart patterns, jaise ke Head and Shoulders ya Inverse Head and Shoulders, mein istemal hota hai. Neckline ek line hoti hai jo chart pattern ke hisaab se draw ki jati hai aur typically Head and Shoulders pattern mein shoulders ko connect karti hai. Yeh line bullish ya bearish reversal ko indicate karti hai, aur jab price is line ko break karta hai, toh yeh ek potential trend reversal signal ho sakta hai.
Candlestick patterns, trading charts par price action ko represent karte hain aur traders ko market sentiment aur potential price movements ke baare mein information provide karte hain. Har candlestick ek specific period ki price movement ko darust karta hai. For example, Doji, Hammer, Shooting Star, aur Engulfing jaise common candlestick patterns hain.
Traders candlestick patterns ka istemal karke market ke trend changes aur entry/exit points ka faisla karte hain.
Agar "Neckline Candlestick Pattern" ke baare mein mazeed tafseel chahiye, toh ek specific example ya context provide karen taake main aap ko mazeed samjha sakun ke is term ka kya matlab hai aur kis tarah se istemal hota hai.
Candlestick Pattern
Candlestick patterns trading charts par price action ko represent karte hain. Har candlestick ek specific period ki price movement ko darust karta hai. Candlestick patterns traders ko market sentiment aur potential price movements ke baare mein information provide karte hain. Kuch common candlestick patterns mein Doji, Hammer, Shooting Star, aur Engulfing shamil hain.
More
Agar aap "Neckline Candlestick Pattern" ke baare mein aur tafseel se batana chahte hain, toh aap mazeed context faraham kar sakte hain taake main aap ki madad kar sakun.
-
Basit5Senior Member
- Mar 2024
- 125
- 5
- 5
Neckline Candlestick Pattren in Forex Trading?
**Neckline Candlestick Pattern in Forex Trading: Roman Urdu**
Neckline candlestick pattern forex trading mein ek ahem technical analysis tool hai jo traders ko potential trend reversals aur price action ko samajhne mein madad deta hai. Chaliye is mudday ko Roman Urdu mein tafseel se samajhte hain, mukhtalif headings ke zariye.
**1. Neckline Candlestick Pattern Ki Tareef**
Neckline candlestick pattern ek reversal pattern hai jo market charts par nazar aata hai. Ismein ek specific price level ko represent karne wali straight line hoti hai jo ek trend reversal ko indicate karti hai.
**2. Pehchan (Identification)**
Neckline pattern ko pehchanne ke liye, traders ko multiple candlesticks ki formation ko dekhna hota hai. Jab price ek specific level ko dobara touch karta hai aur uske baad reversal ki indication hoti hai, toh woh neckline pattern create hota hai.
**3. Bullish Neckline Pattern**
Bullish neckline pattern mein, price pehle downtrend mein hota hai aur phir ek specific level ko break karke upar move karta hai. Jab price phir se usi level ko test karta hai aur iske baad upar move karta hai, toh yeh ek bullish reversal ki indication hoti hai.
**4. Bearish Neckline Pattern**
Bearish neckline pattern mein, price pehle uptrend mein hota hai aur phir ek specific level ko break karke neeche move karta hai. Jab price phir se usi level ko test karta hai aur iske baad neeche move karta hai, toh yeh ek bearish reversal ki indication hoti hai.
**5. Confirmation Ki Zaroorat**
Neckline pattern ki validity ko confirm karne ke liye, traders ko doosre technical indicators aur price action ko bhi dekhna hota hai. Confirmatory signals milne par hi traders apne positions lena shuru karte hain.
**6. Trading Strategies**
Neckline pattern ko confirm karne ke baad, traders apni trading strategies ko implement karte hain. Ismein include hota hai entry aur exit points tay karna, stop-loss orders lagana, aur risk management ka dhyan rakhna.
**7. Risk Management**
Neckline pattern ke istemal mein, risk management ka ahem kirdar hota hai. Traders ko apne positions ke size ko control karna aur stop-loss orders lagana zaroori hota hai taake nuqsanat ko minimize kiya ja sake.
**8. Tafteesh Aur Analysis**
Neckline pattern ko tafteesh karne ke baad, traders market ke current sentiment aur potential trend reversals ko samajh sakte hain. Isse unki trading decisions aur performance ko enhance karne mein madad milti hai.
**Akhri Alfaaz**
Neckline candlestick pattern forex trading mein trend reversals aur price action ko detect karne mein madadgar hai. Iski samajh aur istemal se traders apni trading strategies ko improve kar sakte hain aur market ke movements ko behtar taur par anticipate kar sakte hain.
-
PantsSenior Member
- Jun 2024
- 2463
- 5
- 28
- 560 USD
**Neckline Candlestick Pattern in Forex Trading**
**Neckline Candlestick Pattern:**
Neckline candlestick pattern ek technical analysis pattern hai jo price chart par support aur resistance levels ko identify karne mein madad karta hai. Yeh pattern primarily "Head and Shoulders" aur "Inverse Head and Shoulders" patterns se related hota hai, jahan neckline ek critical level hoti hai jo pattern ka confirmation point hota hai.
**Characteristics of Neckline Pattern:**
1. **Formation of Head and Shoulders:**
- **Head and Shoulders Pattern:** Yeh ek bearish reversal pattern hai jo price chart par three peaks banata hai—ek head aur do shoulders. Neckline is pattern ke support level hoti hai jo head aur shoulders ke low points ko join karti hai.
- **Inverse Head and Shoulders Pattern:** Yeh bullish reversal pattern hai jahan three troughs form hoti hain—ek head aur do shoulders. Neckline is pattern ke resistance level hoti hai jo head aur shoulders ke high points ko join karti hai.
2. **Neckline Identification:**
- **Head and Shoulders:** Neckline ko identify karne ke liye, head aur shoulders ke lows ko connect karte hain. Yeh level price ke reverse hone ka signal data hai jab neckline ko break kiya jata hai.
- **Inverse Head and Shoulders:** Neckline ko identify karne ke liye, head aur shoulders ke heights ko connect karte hain. Yeh level price ke upward move ka signal data hai jab neckline ko break kiya jata hai.
3. **Pattern Confirmation:**
- **Breakout:** Pattern tab complete hota hai aur confirmation milta hai jab price neckline ko break karti hai. Head and Shoulders ke case mein, neckline ka breakdown bearish signal hota hai, jabki Inverse Head and Shoulders ke case mein, neckline ka breakout bullish signal hota hai.
- **Volume:** Volume analysis bhi important hota hai. Generally, pattern ke breakout ke time volume increase hota hai, jo confirmation ko strong banata hai.
**Trading the Neckline Pattern:**
1. **Entry Points:**
- **Bearish Head and Shoulders:** Entry point generally neckline ke breakdown ke baad hota hai. Jab price neckline ko niche break karti hai, toh traders short position enter kar sakte hain.
- **Bullish Inverse Head and Shoulders:** Entry point neckline ke breakout ke baad hota hai. Jab price neckline ko upar break karti hai, toh traders long position enter kar sakte hain.
2. **Stop-Loss:**
- **Head and Shoulders:** Stop-loss ko neckline ke upar, head ke high ke thoda upar place kiya jata hai.
- **Inverse Head and Shoulders:** Stop-loss ko neckline ke niche, head ke low ke thoda niche place kiya jata hai.
3. **Take-Profit:**
- **Head and Shoulders:** Profit target ko neckline se pattern height ko subtract karke set kiya jata hai.
- **Inverse Head and Shoulders:** Profit target ko neckline se pattern height ko add karke set kiya jata hai.
**Example:**
Agar EUR/USD pair par Head and Shoulders pattern develop ho raha hai aur neckline 1.2000 level par hai. Jab price neckline ko break karti hai aur 1.1950 par close hoti hai, toh yeh bearish signal hota hai. Traders short position enter kar sakte hain aur stop-loss ko 1.2050 par set kar sakte hain.
**Conclusion:**
Neckline candlestick pattern forex trading mein critical role play karta hai, especially Head and Shoulders aur Inverse Head and Shoulders patterns ke context mein. Yeh pattern price reversal aur trend changes ko identify karne mein madad karta hai. Proper identification aur confirmation ke sath, traders effective trading decisions le sakte hain aur profitable trades capture kar sakte hain.
-
<a href="https://www.instaforex.org/ru/?x=ruforum">InstaForex</a> -
HealthSenior Member
- Mar 2024
- 1987
- 70
- 72
- 597 USD
InstaSpot: کسی بھی EPS اور بینک سے منافع واپس لیں، اور EPS اور cryptocurrencies کے تبادلے پر 7% تک کمائیں۔
### Neckline Candlestick Pattern in Forex Trading
Forex trading mein candlestick patterns ka istemal market trends aur potential reversals ko samajhne ke liye hota hai. In patterns mein se aik "Neckline" candlestick pattern hai jo traders ko market ki direction aur price movements predict karne mein madad karta hai. Aaj hum Neckline candlestick pattern ke baare mein detail se janenge aur dekhenge ke isko Forex trading mein kaise effectively use kiya jaye.
**Neckline Candlestick Pattern Kya Hai?**
Neckline candlestick pattern ek reversal pattern hai jo generally double top aur double bottom formations ke sath dekha jata hai. Ye pattern trend reversal ke signals provide karta hai. Double top pattern mein, price ek high banati hai, phir niche girti hai aur phir se usi high ko test karti hai lekin break nahi karti, jabke double bottom pattern mein price ek low banati hai, phir se upar jati hai aur phir se usi low ko test karti hai lekin break nahi karti.
**Neckline Pattern Ki Pehchaan:**
1. **Double Top Formation**: Is formation mein, price ek high banati hai, phir niche girti hai aur phir se usi high ko test karti hai. Agar price second high ke baad niche girti hai aur neckline (jo ke support level hoti hai) ko break karti hai, to ye bearish signal hota hai.
2. **Double Bottom Formation**: Is formation mein, price ek low banati hai, phir se upar jati hai aur phir se usi low ko test karti hai. Agar price second low ke baad upar jati hai aur neckline (jo ke resistance level hoti hai) ko break karti hai, to ye bullish signal hota hai.
**Neckline Pattern Ka Use Kaise Karein?**
1. **Entry Points**: Double top pattern mein, entry point neckline ke break hone ke baad consider kiya jata hai. Similarly, double bottom pattern mein, entry point neckline ke break hone ke baad consider kiya jata hai.
2. **Stop-Loss Aur Take-Profit**: Trading ke dauran risk management zaroori hai. Stop-loss ko neckline ke thoda upar ya niche set kar sakte hain, aur take-profit levels ko previous highs ya lows ke mutabiq plan kar sakte hain.
3. **Confirmation Signals**: Neckline pattern ki effectiveness ko enhance karne ke liye, additional technical indicators jaise MACD, RSI, ya volume analysis ka istemal karein. Ye indicators pattern ke signals ko confirm karne mein madad karte hain.
**Challenges and Considerations:**
Neckline pattern ki accuracy market conditions aur volatility pe depend karti hai. Ye pattern kabhi kabhi false signals bhi generate kar sakta hai. Isliye, market analysis aur risk management ko trading strategies ke sath integrate karna zaroori hai.
Agar aap Forex trading mein naye hain, to Neckline candlestick pattern ko samajhna aur practice karna aapki trading strategy ko behtar bana sakta hai. Market ki direction aur trends ko accurately predict karne ke liye, is pattern ko technical analysis aur disciplined trading practices ke sath use karein.
اب آن لائن
Working...
تبصرہ
Расширенный режим Обычный режим