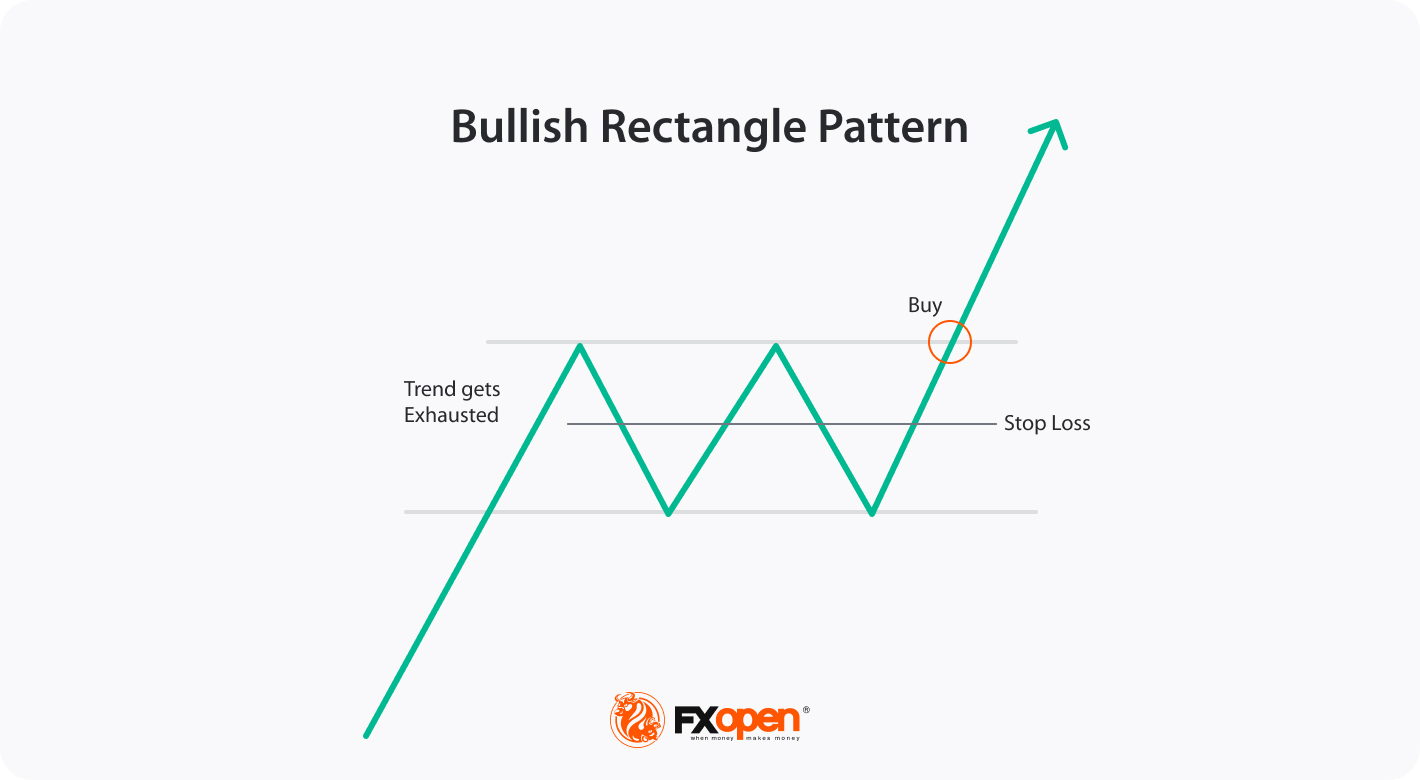
Bullish Rectangle Pattern!
Yeh ek chart pattern hai jo traders ko uptrend ki continuation ka andaza lagane mein madad karta hai.
Bullish Rectangle Pattern ek rectangular shape mein dikhai deta hai, jisme:
- Ek horizontal support level hota hai (lower level)
- Ek horizontal resistance level hota hai (upper level)
- Price iske beech mein range mein dikhai deti hai
Is pattern ki ahmiyat yeh hai ki yeh traders ko uptrend ki continuation ka andaza lagane mein madad karta hai. Agar price iske support level se bounce karta hai, toh yeh ek bullish signal hota hai.
Bullish Rectangle Pattern ki kuch common characteristics hain:
- Ek clear support aur resistance level
- Price iske beech mein range mein dikhai deti hai
- Volume iske saath-saath increase hota hai
Traders is pattern ko apne trades ko set karne ke liye use kar sakte hain. Agar price support level se bounce karta hai, toh traders long position le sakte hain. Lekin, yeh zaroori hai ki aap is pattern ko other technical analysis tools ke saath use karein. Isse aapki trading strategy aur bhi strong hogi!
Aur bhi jankari chaahie?Bullish Rectangle Pattern! Yeh ek chart pattern hai jo traders ko uptrend ki continuation ka andaza lagane mein madad karta hai.
Bullish Rectangle Pattern ek rectangular shape mein dikhai deta hai, jisme:
- Ek horizontal support level hota hai (lower level)
- Ek horizontal resistance level hota hai (upper level)
- Price iske beech mein range mein dikhai deti hai
Is pattern ki ahmiyat yeh hai ki yeh traders ko uptrend ki continuation ka andaza lagane mein madad karta hai. Agar price iske support level se bounce karta hai, toh yeh ek bullish signal hota hai.
Bullish Rectangle Pattern ki kuch common characteristics hain:
- Ek clear support aur resistance level
- Price iske beech mein range mein dikhai deti hai
- Volume iske saath-saath increase hota hai
Traders is pattern ko apne trades ko set karne ke liye use kar sakte hain. Agar price support level se bounce karta hai, toh traders long position le sakte hain. Lekin, yeh zaroori hai ki aap is pattern ko other technical analysis tools ke saath use karein. Isse aapki trading strategy aur bhi strong hogi!
identification bullish rectangle candle stick pattern
Rectangle chart patterns forex market mein market hallat ko wazah karte hey mesal Kay Tor par har aik chart patterns ko price aik taraf lay ker jate hey forex market time Kay Sath price ke limit andar ke taraf chalte hey forex chart par rectangle noma shape bante hey Forex market mein price ka pattern 2highs say Mel kar banta hey resistance zone par forex market mein price Kay 2 touches hotay Hein or support zone par price Kay 2 touches hotay Hein.

تبصرہ
Расширенный режим Обычный режим