Rickshaw Man Candlestick Pattern in details
-
haniahaseebJunior Member

- May 2023
- 22
- 1
- 4
-
<a href="https://www.instaforex.org/ru/?x=ruforum">InstaForex</a> -
haniahaseebJunior Member
- May 2023
- 22
- 1
- 4
The Rickshaw Man candlestick pattern is a technical analysis tool, but is useful for understanding price movement in stocks, forex, or other financial markets. The pattern represents a certain type of candlestick whereas the market represents uncertainty or indecision. Rickshaw Man Candlestick Pattern Ka Appearance (Surat-e-Haal): Rickshaw Man Candlestick Pattern A Long Candle Hoti Hai Jiska Body Bohot Nani Hoti Hai Aur Uski Upper Aur Lower Shadows (Choti C Lines) Long Hoti Hai. This pattern appears to represent indecisiveness in the market, where neither buyers nor sellers have a clear direction for the trend. Rickshaw Man Candlestick Pattern Ka Matlab (Significance): The Rickshaw Man candlestick pattern presents a sensitive trading situaion. Jab ye pattern market mein ata hai, to ye dikhata hai ke market mein kurtnara aur sellers k dermian tafrikat (differences) hai aur kisi ek party ka clear control nahi hai. Isse traders ko sambane mein mad millati hai ke bazaar mein kis tarah ka trend hai. Rickshaw Man Candlestick Pattern Aur Trading Strategies (Trading Ke Tareeqay): Rickshaw Man Candlestick Pattern Trading Strategies I use to help traders identify uncertainty and reversal points. If the pattern is followed by an uptrend, it can be a bearish reversal, whereas if it is a downtrend, it can be a sign of a bullish reversal.Traders use these patterns along with other technical indicators and patterns to help them make trading decisions. Rickshaw Man Candlestick Pattern Ka Istemal Karne Ke Fawaid (Benefits of Using Rickshaw Man Pattern):[/COLOR] Understanding indecision: Rickshaw man pattern traders ko bazaar meh hone wale Indecision ko understanding mein madgar hota hai. Isse unko pata chalta hai ke bazaar mein kis disha mein jaana zyada behtar ho sakta hai.Reversal Points Key Patch: Is Pattern Ka Istemal Reversal Points Ko Pechaane Mein Bhi Hota Hai. If the pattern follows a trend, then it signals a possible reversal, which traders may consider important.Risk Management: Traders can better manage their trades by using the Rickshaw Man candlestick pattern. It is better to know when and how to enter and exitt -
LuqmanHakeemSenior Member
- Aug 2023
- 163
- 1
Rickshaw Man Candlestick Pattern ek technical analysis tool hai jo candlestick charts par dikhne wala ek specific pattern hai. Iska primary aim price trend ko samajhna aur reversal points ka pata lagana hota hai. Is pattern ko details mein samjhte hain: **Rickshaw Man Pattern Key Components:** 1. **Ek Lambi Upper Shadow:** Is pattern mein candle ki upper shadow yaani ke price ke high tak wali line lambi hoti hai, jo batati hai ke price ek certain point tak up gaya tha. 2. **Ek Lambi Lower Shadow:** Candle ki lower shadow bhi lambi hoti hai, isse ye pata chalta hai ke price ek certain point tak neeche gaya tha. 3. **Choti Body:** Candle ki body choti hoti hai aur upper aur lower shadow ke beech mein hoti hai. Body ki length ke beech mein price ka kuch significant movement nahi hota. **Rickshaw Man Pattern Ka Interpretation:** Rickshaw Man Candlestick Pattern ek indecision ya confusion ko darust karta hai market mein. Is pattern ke appearance ke baad, traders samajhte hain ke market mein buyers aur sellers ke beech mein ek barabar ki ladaai hai aur price mein kisi bhi directional movement ka strong indication nahi hota. Is pattern ko dekhte hue traders market mein caution barat te hain aur existing positions ko review karte hain. Yeh pattern often reversals ke prediction mein help karta hai, lekin ek single candle pattern hone ke nate, iski confirmation dusri technical indicators ya patterns ki zaroorat hoti hai. Ek Rickshaw Man Candlestick Pattern, agar ek bullish trend ke baad aata hai toh ye bearish reversal ke indication ke roop mein dekha jata hai aur agar ye ek bearish trend ke baad aata hai toh ye bullish reversal ke indication ke roop mein dekha jata hai. Lekin yaad rahe, Rickshaw Man Pattern ek tool hai, aur trading decisions lene se pehle dusre factors aur indicators ka bhi vichar karna zaroori hai. Risk management ka bhi khyal rakhna bahut important hota hai trading mein. -
Alimoula5Senior Member
- Mar 2024
- 261
- 42
- 53
- 95 USD
Rickshaw Man Candlestick Pattern in details
rickshawman-confirmed-bullish-rr2-stopped-retested-stock-cnc-1h-20190117T193000.png.webp
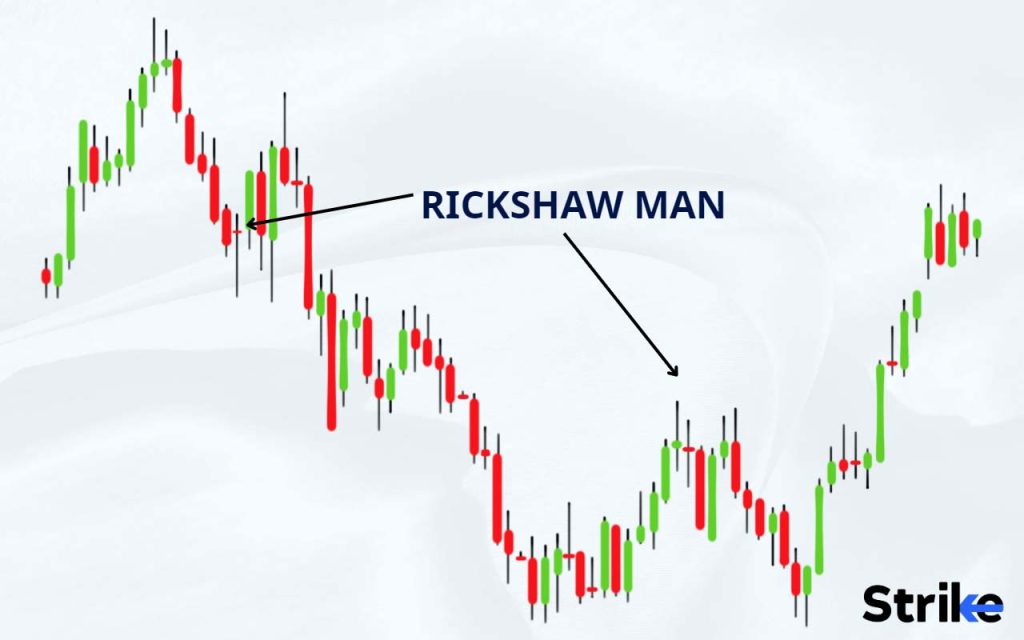
Rickshaw Man Candlestick Pattern" forex trading mein ek specific candlestick pattern hai jo ke price action analysis mein istemal hota hai.
Ye pattern ek single candlestick se bana hota hai aur market ke trend reversal ya trend continuation ko darust karta hai.
Rickshaw Man Candlestick Pattern mein, ek lamba wick (shadow) hota hai upper aur lower sides par, jabki candlestick ki body bohot chhoti hoti hai.
Is pattern ko "Rickshaw Man" is liye kaha jata hai kyunki ye candlestick ek rickshaw ya handcart ke kisi insaan ko yaad dilata hai jo ke apne rickshaw mein lambi jagah le raha hota hai.
Yahan Rickshaw Man Candlestick Pattern ka structure hota hai:
Lambi Upper Wick aur Lower Wick:
Candlestick ke dono sides par lambi wicks hoti hain, jo ke price ke extremes ko darshate hain.
Upper wick price ke high ko darshata hai jabki lower wick price ke low ko darshata hai.
Chhoti Body:
Candlestick ki body bohot chhoti hoti hai aur price ke open aur close ke darmiyan hoti hai.
Rickshaw Man Candlestick Pattern typically market mein indecision ya consolidation ko darust karta hai.
Jab ye pattern uptrend ya downtrend ke baad form hota hai, to ye ek reversal signal ho sakta hai. Agar ye pattern sideways market mein form hota hai, to ye trend continuation ka indication ho sakta hai.
Traders is pattern ko samajhne ke liye candlestick charts par focus karte hain aur iski appearance ke baad confirmatory signals ka intezar karte hain.
Confirmatory signals ke saath sahi risk management ka istemal karte hue, traders trading decisions lete hain. -
Basit5Senior Member
- Mar 2024
- 125
- 5
- 5
Rickshaw Man Candlestick Pattern in details?
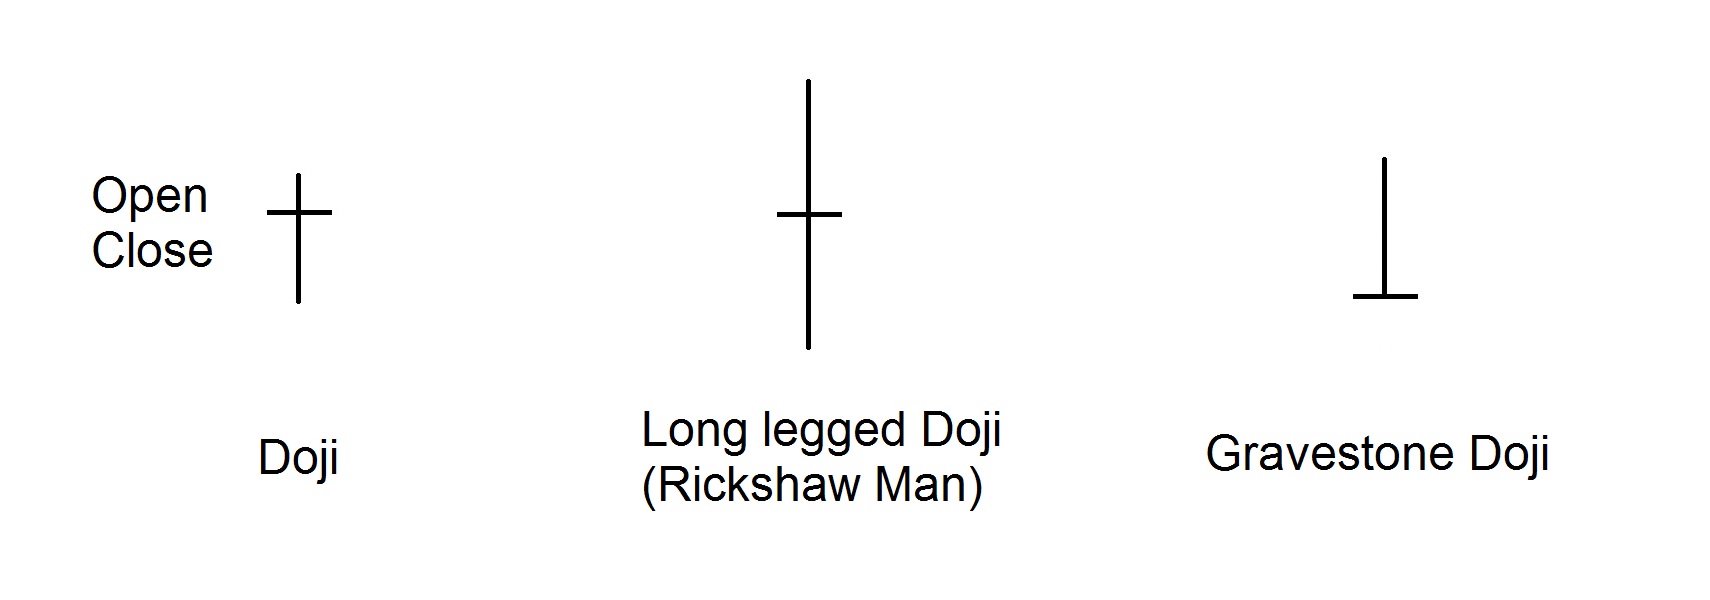
The Rickshaw Man candlestick pattern is a technical analysis pattern that appears in Japanese candlestick charting. Its name derives from its resemblance to a rickshaw or a tractor moving along the ground. Understanding the Rickshaw Man candlestick pattern involves recognizing its unique elements and principles.
**1. Natural Shape:**
The basic shape of the Rickshaw Man candlestick pattern resembles a long stick with both ends cut off.
**2. Thickness:**
The candle in this pattern is usually thick, and both ends are often equal.
**3. Wick:**
The wick of the Rickshaw Man candlestick is generally long and strong.
**4. Near Location:**
This pattern is used to interpret market sentiment after a prevailing trend. If a Rickshaw Man candlestick appears after an uptrend, it indicates that the market's strength has diminished, and a potential selling opportunity is present.
**5. Significance:**
The Rickshaw Man candlestick pattern is employed to gauge trend reversals. If this pattern appears after an uptrend, it may signal an impending end to the current trend and anticipate a bearish reversal.
**6. Example:**
For instance, if a Rickshaw Man candlestick was short towards the upside, it suggests indecision in the market, possibly signaling a trend reversal.
Understanding the Rickshaw Man candlestick pattern aids traders in identifying potential shifts in market sentiment and making informed trading decisions.
Understanding the Rickshaw Man candlestick pattern aids traders in identifying potential shifts in market sentiment and making informed trading decisions.
pattern appears after an uptrend, it may signal an impending end to the current trend and anticipate a bearish reversal.
**6. Example:**
For instance, if a Rickshaw Man candlestick was short towards the upside, it suggests indecision in the market, possibly signaling a trend reversal.
Understanding the Rickshaw Man candlestick pattern aids traders in identifying potential shifts in market sentiment and making informed trading decisions.
-
12ImanSenior Member
- Oct 2022
- 967
- 354
- 771
- 1 268 USD
Rickshaw Man Candlestick Pattern in details kai hy
"Rickshaw Man" ek specific type ka candlestick pattern hai jo Japanese candlestick charting technique mein aata hai. Is pattern ko dekh kar traders market sentiment aur price action ka analysis karte hain. Chaliye is pattern ke characteristics aur interpretation ko samajhte hain:
Rickshaw Man Candlestick Pattern:- Appearance: Rickshaw Man ek single candlestick hoti hai jo doosre candlesticks se alag hoti hai. Is candlestick ka body chhota hota hai aur shadows (upper aur lower wicks) bhi bahut chhoti hoti hain. Is wajah se is candlestick ko "Rickshaw Man" ya "Spinning Top" kehte hain.
- Characteristics:
- Rickshaw Man candlestick ka body chhota hota hai aur upper aur lower shadows ke length bhi short hoti hai.
- Is candlestick mein open aur close prices ke darmiyan ka difference kam hota hai.
- Is pattern mein neither buyers nor sellers ka dominance hota hai aur market mein indecision ka mood dikhai deta hai.
- Interpretation:
- Rickshaw Man candlestick pattern market mein indecision aur equilibrium ko darust karta hai. Is pattern ko dekh kar traders expect karte hain ke market mein koi clear trend nahi hai.
- Agar Rickshaw Man pattern ek uptrend ke baad dikhai de raha hai, to ye indicate karta hai ke uptrend weaken ho raha hai aur market mein reversal hone ki sambhavna hai.
- Agar Rickshaw Man pattern ek downtrend ke baad dikhai de raha hai, to ye indicate karta hai ke downtrend weaken ho raha hai aur market mein reversal hone ki sambhavna hai.
Conclusion:
Rickshaw Man candlestick pattern ek market mein indecision ko darust karta hai aur traders ko potential trend reversals ki indication deta hai. Lekin, is pattern ko confirm karne ke liye doosre technical indicators aur price action analysis ka istemal kiya jana chahiye. Aur hamesha dhyan mein rakhein ke har ek trading decision ko carefully analyze karna zaroori hai aur risk management ko hamesha priority dena chahiye.
-
Rehan50Senior Member
- Mar 2024
- 1955
- 148
- 450
- 518 USD
Candlestick patterns are essential tools in technical analysis, providing insights into market sentiment and potential price movements. Among these patterns, the Rickshaw Man stands out for its unique characteristics and potential implications for traders. In this article, we delve into the Rickshaw Man candlestick pattern, exploring its definition, formation, interpretation, and practical application in trading strategies.
1. Introduction to Candlestick Patterns: Candlestick patterns originated in Japan centuries ago and have become widely popular among traders worldwide. These patterns consist of one or more candlesticks that represent price movements over a specific time frame, typically within a trading session or period.
2. Understanding the Rickshaw Man Candlestick Pattern: The Rickshaw Man is a single candlestick pattern characterized by a small body and long upper and lower shadows. The body of the candlestick is usually small, indicating minimal price movement between the open and close. However, the presence of long upper and lower shadows suggests significant price fluctuations throughout the trading session.
3. Formation of the Rickshaw Man Pattern: The formation of the Rickshaw Man pattern occurs when the open and close prices are relatively close to each other, resulting in a small body. Meanwhile, the upper and lower shadows extend far beyond the body, indicating that prices moved significantly higher and lower during the session before retracing to the close.
4. Interpretation of the Rickshaw Man Pattern: The interpretation of the Rickshaw Man pattern depends on its context within the prevailing market conditions. In an uptrend, the appearance of a Rickshaw Man candlestick near a support level may signal potential bullish exhaustion and a reversal in price direction. Conversely, in a downtrend, a Rickshaw Man candlestick near a resistance level could indicate bearish exhaustion and a possible reversal to the upside.
5. Importance of Volume Confirmation: While the Rickshaw Man pattern provides valuable insights into price action, traders should seek confirmation from other technical indicators, such as volume, to validate their analysis. A surge in trading volume accompanying the formation of a Rickshaw Man candlestick strengthens the pattern's significance and increases the likelihood of its predictive accuracy.
6. Practical Application in Trading Strategies: Traders can incorporate the Rickshaw Man pattern into various trading strategies, including trend reversal and continuation setups. For example, a trader may look for a Rickshaw Man candlestick forming at key support or resistance levels in conjunction with other technical indicators, such as moving averages or oscillators, to enter or exit trades with higher probability.
7. Risk Management and Limitations: While the Rickshaw Man pattern can provide valuable insights into market dynamics, traders should exercise caution and implement proper risk management strategies. Like any technical indicator, the Rickshaw Man pattern is not foolproof and may produce false signals, especially in volatile or choppy market conditions. Therefore, it is essential to use the pattern in conjunction with other forms of analysis and to manage risk by setting stop-loss orders and position sizing appropriately.
In conclusion, the Rickshaw Man candlestick pattern offers traders a valuable tool for analyzing market sentiment and identifying potential trend reversals or continuations. By understanding its formation, interpretation, and practical application in trading strategies, traders can incorporate this pattern into their decision-making process to enhance trading performance and achieve more consistent results in the financial markets. -
Km2006Senior Member
- Mar 2022
- 1260
- 72
- 152
- 1 117 USD
Rickshaw Man Candlestick Pattern
Assalam o Alekum Dear Friends and Fellows Rickshaw Man Candlestick Pattern ek ahem technical analysis tool hy jo stock market me price movement aur trend ko samajhny me helpful hota hy. Ye pattern traders aur investors ke liye ahem hy kyunki iske zariye market me hony waly possible changes ko anticipate kiya ja sakta hy. Is article me hum Rickshaw Man Candlestick Pattern ke baray me tafseel se baat karenge aur iske maqsad aur istemal ko explore Karen ge.Rickshaw Man Candlestick Pattern ek behtareen technical analysis tool hy jo market me hony waly trend reversals ya changes ko anticipate karny me helpful hota hy. Is pattern ko samajhna aur istemal karna traders ke liye ahem hy, lekin hamesha dhyan rahy ke market analysis ke doosry aspects aur indicators ko bhi consider karein. Trading market me risk ke saath juda hota hy, isliye prudent trading strategies ka istemal karna zaroori hy. Traders ko market me hony waly changes aur opportunities ko samajhny ke liye lagatar seekhna aur update rehna chahiye
Identification of Rickshaw Man Candlestick Pattern
Rickshaw Man Candlestick Pattern ek candlestick pattern hy jo market me ek specific condition ko represent karta hy. Is pattern me ek lambi candle hoti hy jiska opening price aur closing price ek dosre ke bohat qareeb hoti hein. Isi wajah se is pattern ko "Rickshaw Man" kehte hein, kyun ke iski shakal ek rickshaw driver ki kursi par baithay insaan ki tarah hoti hy jiska sir aur paon lambay hotay hein.
Trading with Rickshaw Man Candlestick Pattern
Rickshaw Man Candlestick Pattern ko samajh kar traders apni trading strategies banaty hein. Is pattern ki tafseelat se traders ko ye idea milta hy ke market me indecision hy aur trend ki taraf koi strong indication nahi hy. Lekin, yaad rahy ke is pattern ka asal maqsad ye hota hy ke traders ko caution deny ka, aur unhein ye dikhane ka ke market me abhi kisi bhi specific direction ki taraf kisi strong indication nahi hy. Is pattern ko samajhny ke liye, traders ko doosre technical analysis tools jaise ke moving averages, RSI, aur volume analysis ka bhi sahara lena chahiye. Rickshaw Man Pattern ki tafseelat ke sath-sath, market ke overall health aur sentiment ko bhi samajhna zaroori hy.
-
Arsau124Member
- Mar 2024
- 58
- 16 USD
Rickshaw Man Candlestick Pattern
Assalam o Alekum Dear Friends and Fellows Rickshaw Man Candlestick Pattern ek ahem technical analysis tool hy jo stock market me price movement aur trend ko samajhny me helpful hota hy. Ye pattern traders aur investors ke liye ahem hy kyunki iske zariye market me hony waly possible changes ko anticipate kiya ja sakta hy. Is article me hum Rickshaw Man Candlestick Pattern ke baray me tafseel se baat karenge aur iske maqsad aur istemal ko explore Karen ge.Rickshaw Man Candlestick Pattern ek behtareen technical analysis tool hy jo market me hony waly trend reversals ya changes ko anticipate karny me helpful hota hy. Is pattern ko samajhna aur istemal karna traders ke liye ahem hy, lekin hamesha dhyan rahy ke market analysis ke doosry aspects aur indicators ko bhi consider karein. Trading market me risk ke saath juda hota hy, isliye prudent trading strategies ka istemal karna zaroori hy. Traders ko market me hony waly changes aur opportunities ko samajhny ke liye lagatar seekhna aur update rehna.
:max_bytes(150000):strip_icc():format(webp)/dotdash_INV-final-Rickshaw-Man-May-2021-01-64a19d3f61874c29b46e8b3def66db1f.jpg)
Identification of Rickshaw Man Candlestick Pattern
Rickshaw Man Candlestick Pattern ek candlestick pattern hy jo market me ek specific condition ko represent karta hy. Is pattern me ek lambi candle hoti hy jiska opening price aur closing price ek dosre ke bohat qareeb hoti hein. Isi wajah se is pattern ko "Rickshaw Man" kehte hein, kyun ke iski shakal ek rickshaw driver ki kursi par baithay insaan ki tarah hoti hy jiska sir aur paon lambay hotay hein.
Trading with Rickshaw Man Candlestick Pattern
Rickshaw Man Candlestick Pattern ko samajh kar traders apni trading strategies banaty hein. Is pattern ki tafseelat se traders ko ye idea milta hy ke market me indecision hy aur trend ki taraf koi strong indication nahi hy. Lekin, yaad rahy ke is pattern ka asal maqsad ye hota hy ke traders ko caution deny ka, aur unhein ye dikhane ka ke market me abhi kisi bhi specific direction ki taraf kisi strong indication nahi hy. Is pattern ko samajhny ke liye, traders ko doosre technical analysis tools jaise ke moving averages, RSI, aur volume analysis ka bhi sahara lena chahiye. Rickshaw Man Pattern ki tafseelat ke sath-sath, market ke overall health aur sentiment ko bhi samajhna zaroori hy. -
RashidshahzadaSenior Member
- Jul 2020
- 5693
- 218
- 4456
- 745 USD
RICKSHAW MAN CANDLESTICK PATTERN DEFINITION
Rickshaw man long legged doji candlestick ki ek type hai Jahan body candle ke bich mein ya Uske bilkul Kareeb paya jata hai ek candlestick high low open and close price ko dikhata hai candles stick par long Shadow creating Karte Hain yah market Mein shares Ki Jaaneb Se and indecision ko show Karte Hain Riksha mankandal us time hoti hai Jab Bulls and bears ek hi period Ke dauran different times mein security ki price ko control Karte Hain yah. period Ke liye ek wide trading range banata hai Rickshaw Man ki taraf se numaya volatility ke bavjud clear direction ki movement ki taraf signals nahin karta and price us ke opening price ke bilkul Kareeb close Ho Jaati Hain
RICKSHAW MAN OF EXAMPLE
Kuchh situation mein pattern consolidation ki.period Ki represent kar sakta hai Jo Pichhle Trends ke continuation ka mashvara De sakta hai dusri situation mein Pattern Bulleih se run up ke end per indecision ki ki maloomat karta hai lekin bahut se mamalat mein traders traders Kisi bhi position ko US time tak rokana Chahenge jab Tak ke Koi chart pattern ya price ka Trends Samne na a Jaaye
UNDERSTANDING RICKSHAW MAN
Jab analysts Rickshaw Man Ko dusre technical analysis ke sath Milkar istemal Kiya jata hai to unke reliable signal Hasil karne ke liye zyada imakan Hota Hai Agar price overal Taur per Upar ke trends mein hai lekin usne recent pull back ka analysis Kiya Hai Ek Bar Jab price pattern and indicators per Badhana start kar deti Hain to signals ki confirmation ki Jaati Hai shooting star ka context and formation se different hai shooting star ka upri Shadow long Hota Hai first right Taraf us time Hota Hai Jab Kami ke bad price Badhana start hoti hai Rickshaw man candlestick ne decision na karne ka Ishara Diya and price Upar jaane se pahle two sessions ke Ek Taraf Chalti Hai
-
Haider1214Senior Member
- Feb 2024
- 208
- 79
- 18
- 44 USD
Rickshaw Man Candlestick Pattern
Rickshaw Man candlestick pattern ek single candlestick pattern hai jo market mein equity aur forex trading mein dekha ja sakta hai. Ye pattern kisi bhi trend ke dauran dikhta hai aur usually market ke indecision ko darust karta hai. Niche Rickshaw Man candlestick pattern ke key points diye gaye hain:
Appearance (ظاہریت):- Rickshaw Man candlestick pattern ek chhoti si candle hoti hai jiska body bahut chhoti hoti hai.
- Is candle mein upper aur lower shadows lambi hoti hain, jo ki kisi bhi taraf jyada extend nahi hoti hain. Is wajah se iska naam "Rickshaw Man" hai, jo ek traditional rickshaw ki shape ya seat par base hota hai aur lambi handles ko darust karta hai.
Context (سیاق و سباق):- Rickshaw Man pattern typically trend ke dauran dikhta hai aur market mein indecision ya confusion ko darust karta hai.
- Ye pattern dekhne par traders ko samajh aata hai ke market mein buyers aur sellers ke darmiyan kisi bhi taraf ki koi clear dominance nahi hai.
Market Sentiment (بازار کی جذبات):- Rickshaw Man pattern market sentiment ko represent karta hai, jahan traders ke darmiyan uncertainty hai.
- Ye pattern dekh kar traders cautious ho jaate hain aur kisi bhi direction mein aggressive moves se bachte hain.
Confirmation (توثیق):- Rickshaw Man pattern ko confirm karne ke liye, traders doosri confirmatory signals ka bhi intezaar karte hain.
- Agar Rickshaw Man pattern ke baad ek strong bullish ya bearish candle follow hoti hai, toh ye pattern ki validity ko confirm karta hai.
Rickshaw Man candlestick pattern dekhne par traders ko market mein indecision ya consolidation ke baare mein maloomat mil jati hai. Ye pattern traders ko alert rakhta hai aur market ki uncertainty ko darust karta hai. Lekin, sirf ek candlestick pattern par rely karke trading decisions na lein, balki aur confirmatory signals ka bhi dhyan rakhein.
-
mu410Senior Member
- Feb 2022
- 425
- 187
- 20
- 214 USD
Rickshaw Man Candlestick Pattern: Aik Mukhtasir Introduction
Rickshaw Man candlestick pattern ek technical analysis mein istemal hone wala important pattern hai. Is article mein, hum Rickshaw Man candlestick pattern ki wazahat karenge, uske fawaid aur nuksan par ghor karenge, aur iske istemal ke tareeqon par bhi baat karenge.
Introduction to Rickshaw Man Candlestick Pattern
Rickshaw Man candlestick pattern ek single candlestick pattern hai jo market mein indecision ya equilibrium ko darust karta hai. Ye pattern usually trend reversal ya trend continuation ko indicate karta hai, lekin confirm karne ke liye additional analysis ki zarurat hoti hai.
Rickshaw Man Candlestick Pattern ki Characteristics- Chhoti Body: Rickshaw Man candle ki body chhoti hoti hai, jo indicate karta hai ki opening aur closing price mein zyada farq nahi hai.
- Lambi Upper aur Lower Shadow: Is pattern mein upper aur lower shadow ya wick dono lambi hoti hain, jo candle ko ek rickshaw ke manzarein se milta hai.
- Equilibrium: Rickshaw Man candle market mein indecision ya equilibrium ko darust karta hai.
- Indecision Signal: Rickshaw Man candle market mein indecision ko indicate karta hai, jo traders ko alert karta hai aur unhe cautious banata hai.
- Trend Reversal ya Continuation: Is pattern ke dekhne se traders ko trend reversal ya trend continuation ka pata lag sakta hai.
- Stop Loss Placement: Rickshaw Man candle ko dekh kar traders apne stop loss levels ko determine kar sakte hain.
- False Signals: Kabhi-kabhi Rickshaw Man candle false signals bhi de sakta hai, matlab ke indecision actual trend reversal ya continuation se alag ho sakta hai.
- Confirmation Ki Zarurat: Is pattern ko confirm karne ke liye dusre technical indicators ka istemal karna zaruri hota hai.
- Trend Analysis: Rickshaw Man candle ko dekhte hue traders market trend ka analysis kar sakte hain aur potential reversals ya continuations ko anticipate kar sakte hain.
- Entry Point Determination: Is pattern ka istemal karke traders entry points determine kar sakte hain aur trading strategies ko refine kar sakte hain.
- Risk Management: Rickshaw Man candle ko dekh kar traders apne risk management strategies ko improve kar sakte hain aur stop loss levels ko set kar sakte hain.
Rickshaw Man candlestick pattern ek important tool hai technical analysis mein jo market sentiment aur price action ka insight provide karta hai. Is pattern ko samajh kar, traders apne trading decisions ko improve kar sakte hain aur market trends ko better anticipate kar sakte hain. Lekin, is pattern ko istemal karte waqt, always confirmatory indicators ka istemal karna zaruri hai aur risk management ko bhi dhyan mein rakhna chahiye.
-
Sumi2193Senior Member
- Mar 2024
- 570
- 27
- 21
- 169 USD
Rickshaw man candlestick pattern
Explain Rickshaw man candlestick pattern in details:
As salam o alaikum dosto,Rickshaw man candlestick is waqt hoti hy jab bear or bull ik hi muddat ky doran mukhtalif auqaat main security ki qeemat ko control karty hain. Rickshaw man candlestick ik single candlestick hy jesy single bhi trade kiya ja sakta hy. Japanese candlestick ko is wajah sy trading ky doran analysis main zyada pasand kiya jata hy, kyu ky ye candlestick single candlestick hony ky bawajood bhi ik pattern tashkeel deti hy. Jab bhi ye single candlesticks prices k top ya bottom main payi jati hy, to us waqt ye trend reversal ka kam karti hy. Single candlestick main doji candles or small real body wali candles akely ya dusry candlestick ky sath prices main leading indicator ka kaam karti hy. Rickshaw man candlestick prices ky top ya bottom main trend reversal pattern ka kam karti hy, jab ki yahi candle sideways market main neutral candlestick tasawar ki jati hy.
Trading with rickshaw man candlestick pattern:
Hello dear friends, Rickshaw Man Candlestick Pattern ISI Tarah Sy excessive cost region ya Boly stand ky terrible bany pr zyada tr ye candlestick bearing stand inversion ka varg Karti Hy Riksha man candlestick ki time span Jitna zyada Hoga utna iski dependability Bhi zyada Hogi stop misfortune candlestick ky Lower side per market Main passage ky mutabik set Karen.Rickshaw Man Candlestick Pattern ye bounce ap sab khairiyat sy Honge or apna best conflict kr rahy Hongy Jab ap is main work karty hain to apko Koshish Karna hoti hy ki ap is main Mani the board and Rose guideline ky sath kam Karen Jo individuals achi procedures ky sath kam karty hain.Rickshaw Man Candlestick Pattern single candlestick pr moshtamil ik bearish trend reversal candlestick pattern hy, jo currency pairs or commodities ky price chart main sirf resistance level pr banta hy.
-
Babarazam786Senior Member
- May 2023
- 258
- 4
- 129
- 90 USD
What is Rickshaw Man Candlestick Pattern.
Assalam o Alekum Dear Friends and Fellows Rickshaw Man Candlestick Pattern ek ahem technical analysis tool hy jo stock market me price movement aur trend ko samajhny me helpful hota hy. Ye pattern traders aur investors ke liye ahem hy kyunki iske zariye market me hony waly possible changes ko anticipate kiya ja sakta hy. Is article me hum Rickshaw Man Candlestick Pattern ke baray me tafseel se baat karenge aur iske maqsad aur istemal ko explore Karen ge.Rickshaw Man Candlestick Pattern ek behtareen technical analysis tool hy jo market me hony waly trend reversals ya changes ko anticipate karny me helpful hota hy. Is pattern ko samajhna aur istemal karna traders ke liye ahem hy, lekin hamesha dhyan rahy ke market analysis ke doosry aspects aur indicators ko bhi consider karein. Trading market me risk ke saath juda hota hy, isliye prudent trading strategies ka istemal karna zaroori hy. Traders ko market me hony waly changes aur opportunities ko samajhny ke liye lagatar seekhna aur update rehna chahiye.
Analysis of Rickshaw Man Candlestick Pattern.
Rickshaw Man Candlestick Pattern ek candlestick pattern hy jo market me ek specific condition ko represent karta hy. Is pattern me ek lambi candle hoti hy jiska opening price aur closing price ek dosre ke bohat qareeb hoti hein. Isi wajah se is pattern ko "Rickshaw Man" kehte hein, kyun ke iski shakal ek rickshaw driver ki kursi par baithay insaan ki tarah hoti hy jiska sir aur paon lambay hotay hein.
Trading with Rickshaw Man Candlestick Pattern.
Rickshaw Man Candlestick Pattern ko samajh kar traders apni trading strategies banaty hein. Is pattern ki tafseelat se traders ko ye idea milta hy ke market me indecision hy aur trend ki taraf koi strong indication nahi hy. Lekin, yaad rahy ke is pattern ka asal maqsad ye hota hy ke traders ko caution deny ka, aur unhein ye dikhane ka ke market me abhi kisi bhi specific direction ki taraf kisi strong indication nahi hy. Is pattern ko samajhny ke liye, traders ko doosre technical analysis tools jaise ke moving averages, RSI, aur volume analysis ka bhi sahara lena chahiye. Rickshaw Man Pattern ki tafseelat ke sath-sath, market ke overall health aur sentiment ko bhi samajhna zaroori hy.
-
<a href="https://www.instaforex.org/ru/?x=ruforum">InstaForex</a> -
HooramSenior Member
- Feb 2024
- 2719
- 449
- 1023
- 1 815 USD
Rickshaw Man Candlestick Pattern: Ek Tafseeli Jaiza
Candlestick patterns are an essential tool for traders in the financial markets, providing valuable insights into market sentiment and potential price movements. One such pattern that traders often look for is the "Rickshaw Man," which can indicate a potential reversal or continuation of a trend. In this article, we'll delve into the intricacies of the Rickshaw Man candlestick pattern in the context of financial trading.
1. Rickshaw Man Candlestick Pattern Ki Tareef
Rickshaw Man candlestick pattern ek single candlestick se milta hai jo kisi muddat ke trend ke badalne ya jari rakhne ki alamat ho sakta hai. Is pattern ko dekh kar traders market ke mizaj aur future ke qadam ko samajhte hain. Rickshaw Man candlestick pattern mein, candle ki body kafi choti hoti hai aur uski upper aur lower wicks (shadows) lambi hoti hain, jisse ek rickshaw ya hand-drawn cart ki shakal yaad dilai jati hai. Is pattern ka zikar pehli martaba Steve Nison ke kitab "Japanese Candlestick Charting Techniques" mein kiya gaya tha.
2. Rickshaw Man Pattern Ki Pechan Kaise Ki Jati Hai
Rickshaw Man pattern ko pehchan'ne ke liye traders ko kuch ahem nuktay par tawajjo deni hoti hai:- Candle ki body choti hoti hai aur upper aur lower wicks lambi hoti hain.
- Candle ke opening aur closing price barabar ya qareeb barabar hoti hai.
- Is pattern ke sath volume ki bhi tawajjo di jati hai, jahan zyada volume ki mojoodgi reversal ki pushti karti hai.
3. Rickshaw Man Pattern Ka Tafseeli Mutalaa
Rickshaw Man pattern ka tafseeli mutalaa karne ke liye, traders ko market ke context aur dusri technical indicators ki bhi tawajjo deni hoti hai. Agar Rickshaw Man candle ek uptrend ke baad aata hai, to yeh ek bearish reversal ki alamat ho sakti hai, jabke agar yeh downtrend ke baad aata hai, to yeh ek bullish reversal ki alamat ho sakti hai. Iske ilawa, volume ki confirmation bhi zaroori hoti hai taake yeh pattern sahi sabit ho.
4. Rickshaw Man Pattern Ka Istemal Aur Strategy
Rickshaw Man pattern ka istemal karne ke liye, traders ko is pattern ko dusri technical analysis tools ke sath milakar istemal karna chahiye. Yeh pattern sirf akela hi decision nahi lena chahiye, balki dusri confirmatory signals ke sath dekha jana chahiye. Kuch traders is pattern ko support aur resistance levels ke sath dekhte hain, jabke doosre Fibonacci retracement levels ke sath bhi iska istemal hota hai.
5. Rickshaw Man Pattern Aur Risk Management
Har trading strategy ki tarah, Rickshaw Man pattern ka bhi sahi risk management ke sath istemal zaroori hai. Traders ko apne stop-loss orders ko set karna chahiye taake agar trade ulta ho, to nuksan kam ho. Iske ilawa, position size ka bhi dhyan rakhna zaroori hai taake har ek trade ke liye maqool risk ho.
Ikhtitami Alfaz
Rickshaw Man candlestick pattern ek ahem technical analysis tool hai jo traders ko market ke mizaj aur price movements ke bare mein maloomati faraham karta hai. Is pattern ko samajhna aur sahi tareeqay se istemal karna, traders ke liye ahem hai taake woh mukhtalif trading scenarios mein kamiyabi hasil kar sakein. Magar yaad rahe ke har ek trading strategy ki tarah, is pattern ka bhi istemal sahi samajh aur tajurba ke sath karna chahiye.
اب آن لائن
Working...
تبصرہ
Расширенный режим Обычный режим