CMF indicator ki details
-
UpdatedSenior Member

- Apr 2023
- 933
- 80
-
<a href="https://www.instaforex.org/ru/?x=ruforum">InstaForex</a> -
UpdatedSenior Member
- Apr 2023
- 933
- 80
CMF INDICATOR IN TRADINGIntroduction CMF jis ko "Chaikin Money Flow," aik trading indicator hai jo market me paise ke flow ko measure karta hai. Ye indicator traders ke liye valuable hai kyunki isse market ke price aur volume ke beech ke relation ko samjha ja sakta hai. CMF indicator ko samjhne ke liye, iske formula aur uske istemal ko detail me explore karenge. CMF Indicator Ka Formula: CMF indicator ko calculate karne ke liye, aapko niche diye gaye steps follow karne honge: Din bhar ke average price: Sabse pehle, aapko har din ke average price ko calculate karna hoga. Iske liye, high aur low prices ko add karke 2 se divide karenge. Formula: (High + Low) / 2 Money Flow (MF): Ab, aapko har din ke average price ko us din ke volume ke saath multiply karenge. Agar price upar gaya (yani high price), to MF positive hoga. Agar price neeche gaya (yani low price), to MF negative hoga. Formula: Average Price x Volume CMF Value: Is step me, aap MF ko accumulate karenge. Isse CMF value milta hai. CMF positive ya negative ho sakta hai. Agar CMF positive hai, to iska matlab hai ki market me paise aa rahe hain. Agar CMF negative hai, to iska matlab hai ki market se paise nikal rahe hain. Guidelines for traders CMF indicator ka istemal market me paise ke flow ko samajhne aur trading decisions lene ke liye hota hai. Yahan kuch important points hain CMF indicator ke istemal ke bare me: Money Flow Interpretation: CMF indicator positive ya negative value deta hai. Positive CMF value bullish sentiment ko darust karta hai, jabki negative CMF value bearish sentiment ko darust karta hai. Traders isse market ke direction ko samajhne me madadgar ho sakte hain. Divergence Ke Liye: CMF indicator ko price action ke saath compare kiya ja sakta hai. Agar price upar ja raha hai lekin CMF downar ja raha hai (ya ulta), to isse divergence signal milta hai. Ye divergence reversal ke possible indication ho sakte hain. Volume Confirmation: CMF indicator volume ke sath milakar use karna trading me mahatvapurn hai. Agar CMF indicator positive hai aur volume bhi badh raha hai, to ye strong buying signal ho sakta hai, aur traders long positions le sakte hain. Vaise hi, negative CMF aur decreasing volume bearish sentiment ko confirm kar sakte hain. Overbought aur Oversold Levels: CMF indicator ko overbought (jab market overextended hota hai) aur oversold (jab market weak hota hai) levels ke sath use kiya ja sakta hai. Agar CMF bahut bada ho, to ye overbought market ko darust kar sakta hai, aur traders caution me reh sakte hain. Risk Management: CMF indicator ko risk management ke liye bhi istemal kiya ja sakta hai. Agar CMF negative hai aur volume kam hai, to ye ek indication ho sakta hai ki market weak hai aur traders apne positions ko protect karne me concentrate karenge. Summary CMF indicator trading me aik powerful tool hai jo market ke paise ke flow ko samjhne aur trading decisions lene me madadgar ho sakta hai. Isse market sentiment, divergence, volume confirmation, aur risk management ka pata lagaya ja sakta hai. Lekin yaad rahe, CMF indicator ek tool hai, aur iska istemal dusre indicators aur analysis ke saath kiya jana chahiye trading ke faislon ko darust karne ke liye. Trading me hamesha cautious approach rakhna important hai. -
Riaz HussainSenior Member
- Mar 2020
- 723
- 790
- 1128
- 980 USD
InstaSpot: کسی بھی EPS اور بینک سے منافع واپس لیں، اور EPS اور cryptocurrencies کے تبادلے پر 7% تک کمائیں۔
CMF indicator : CMF (Chaikin Money Flow) indicator forex trading mein ek volume-based technical indicator hai. Ye indicator price aur volume ke combination ko analyze karta hai aur trend ke strength aur reversals ko identify karta hai. Is indicator ki calculation volume aur price ke base par hoti hai. CMF indicator ko 1980s mein Marc Chaikin ne banaya. Ye indicator volume aur price action ko combine karke market ki buying/selling pressure ko measure karta hai. Isse traders market sentiment aur smart money ka pata lagakar trading decisions lete hain. Trade with CMF indicator : CMF indicator ke sath trade karne ke liye aap ye steps follow kar sakte hain: 1. Trend identification: CMF indicator se trend ko identify karein. Positive CMF values uptrend aur negative CMF values downtrend indicate karte hain. 2. Confirmation: CMF indicator ke readings ko dusre indicators aur price action ke sath confirm karein. Isse aapko trade ki validity aur strength ka pata chalega. 3. Entry point: CMF indicator ki readings ke hisab se entry point determine karein. Positive CMF values ke sath long position aur negative CMF values ke sath short position le sakte hain. 4. Risk management: Stop loss aur take profit levels set karein, jisse aap risk ko manage kar sakein. CMF indicator ke readings ko use karke aap stop loss aur take profit levels ko adjust kar sakte hain. 5. Exit strategy: CMF indicator ki readings ke hisab se exit point determine karein. Jab CMF values opposite direction mein move karte hain ya trend change hota hai, toh exit karein. CMF indicator ke sath trade karte waqt hamesha market conditions aur risk tolerance ko consider karein. Iske alawa, demo account par practice karke aur trading strategies ko test karke apne trading skills ko improve karein. Characteristics of CMF indicator : CMF indicator ki kuch khas characteristics hain: 1. Volume-based: CMF indicator volume data ka istemal karta hai, jisse market ki liquidity aur buying/selling pressure ka pata lagaya ja sakta hai. 2. Trend identification: CMF indicator trend ke strength aur reversals ko identify karta hai. Positive CMF values uptrend aur negative CMF values downtrend indicate karte hain. 3. Money flow: CMF indicator money flow ko measure karta hai, jisse market mein smart money ka pata lagaya ja sakta hai. Positive CMF values indicate buying pressure aur negative CMF values indicate selling pressure. 4. Divergence detection: CMF indicator divergence ko detect karne mein madad karta hai. Agar price aur CMF indicator ke readings opposite directions mein move kar rahe hain, toh ye divergence signal ho sakta hai. 5. Overbought/oversold conditions: CMF indicator overbought aur oversold conditions ko bhi identify kar sakta hai. Jab CMF values bahut high ya low ho jate hain, toh ye market ke extreme levels ko indicate karte hain. Ye characteristics CMF indicator ko ek powerful tool banate hain, jisse traders trend analysis aur market sentiment ka pata lagakar trading decisions le sakte hain. -
MaharRehan89Senior Member
- Sep 2020
- 3656
- 3509
- 3840
- 1 163 USD
Introduction Assalaam.o.alikum dear forex member umeed karta hun k ap theek hun gay or achy tariqy sy apna kaam kar rhy hun gay dear jaisa k ap janty hain k Forex trading ek aise market hai jahan traders currencies ko buy aur sell karte hain. Yeh market volatile hota hai aur traders ko tijarat karne ke liye taqatwar tools ki zarurat hoti hai. CMF indicator (Chaikin Money Flow) ek aisa technical indicator hai jo traders ko market mein hone wale paise ki taqat ka andaza lagane mein madadgar hota hai. Is mein hum CMF indicator ki tafseelat tafseel se parhenge. 1.CMF Indicator Formation of CMF Indicator Dear member CMF indicator market volume aur price action ko mila kar calculate hota hai. Iska maqsad yeh hai ke traders ko samajh mein aaye ke market mein paisa kis tarah se aa raha hai. CMF indicator positive aur negative values mein aata hai, jo market mein paise ki flow ko darust darust numaya karta hai. 2.CMF Indicator Calculation of CMF Indicator Dear member CMF indicator ko calculate karne ke liye, aapko do cheezein chahiye: #.Daily price range (daily high aur daily low) #.Daily volume (daily trading volume) #.CMF ki calculation ke liye, neeche di gayi formula istemal hoti hai #.Yahan par Close, High, Low aur Volume current day ke hote hain. 3.Interpreting CMF Indicator. Dear member CMF indicator ko interpret karne ke liye, aap in points par ghor karen: CMF Positive: Jab CMF indicator positive hota hai, to iska matlab hai ke buying pressure zyada hai aur market mein paisa aa raha hai. CMF Negative: Agar CMF indicator negative hai, to iska matlab hai ke selling pressure zyada hai aur market se paisa nikal raha hai. CMF Zero Line: CMF indicator jab zero line par hota hai to yeh darust darust balance ko darust karta hai. 4.Trading Strategy with CMF Indicator Dear member CMF indicator ko trading strategy mein istemal karne ke liye, traders isay trend confirm karne ke liye aur divergences ya reversals ko pehchanne ke liye istemal karte hain. CMF indicator aksar dusre technical indicators ke sath istemal hota hai jaise ke moving averages ya relative strength index (RSI). 5.Key Points About CMF Indicator) Dear member CMF indicator ek useful tool hai market analysis mein. Isay short-term aur long-term trading mein istemal kiya ja sakta hai. CMF indicator ke signals ko dusre technical indicators aur price action ke sath istemal karna behtar hota hai. 6.Importance of CMF Indicator. CMF indicator market mein hone wale paise ki taqat ko samajhne mein madadgar hota hai. Traders isay apni trading strategies mein shamil kar ke behtareen faislay aur entry/exit points tayyar kar sakte hain. Summary Dear member Forex trading mein CMF indicator ek powerful tool hai jo traders ko market mein hone wale paise ki flow ko samajhne mein madadgar hota hai. Isay sahi tarah se samajh kar aur dusre technical indicators ke sath istemal kar ke traders behtar trading decisions le sakte hain. CMF indicator trading mein ek ahmiyat rakhta hai aur isay istemal kar ke traders apni trading skills ko behtar bana sakte hain. -
Asim5Senior Member
- Aug 2023
- 830
- 33
- 173
- 320 USD
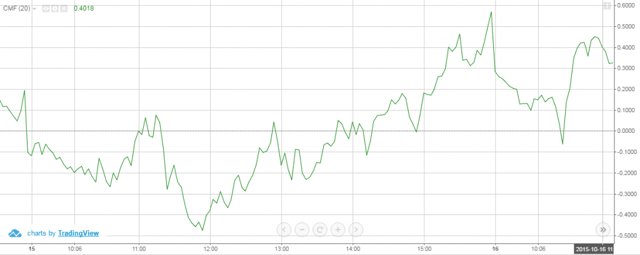
CMF indicator ki details CMF (Chaikin Money Flow) ek technical indicator hai jo stock market mein trading aur investment ke liye istemal hota hai. Ye indicator price aur volume ke based par market ki strength aur direction ko measure karta hai. CMF indicator ek momentum oscillator hai, aur iska use traders aur investors market trends aur potential reversals ko identify karne ke liye karte hain. CMF indicator ke important points:- Calculation: CMF indicator ka calculation price aur volume data ka combination hota hai. Niche diye gaye formula se CMF nikala jata hai: [COLOR=var(--tw-prose-bold)]CMF = (21-period EMA of Money Flow Multiplier) / (21-period EMA of Volume)[/COLOR]
- Money Flow Multiplier = [(Close - Low) - (High - Close)] / (High - Low)
- Money Flow = Money Flow Multiplier * Volume
- Interpretation:
- Positive CMF: Jab CMF positive hota hai, yani indicator line 0 ke upar hoti hai, to yeh ek bullish signal hota hai. Iska matlab hai ki buying pressure market mein strong hai.
- Negative CMF: Jab CMF negative hota hai, yani indicator line 0 ke niche hoti hai, to yeh ek bearish signal hota hai. Iska matlab hai ki selling pressure market mein strong hai.
- CMF ka magnitude bhi important hota hai. Jitna jyada magnitude, utna jyada buying ya selling pressure indicate karta hai.
- Divergence: CMF indicator ka use divergence ko identify karne ke liye bhi kiya jata hai. Agar CMF indicator ke readings price movement ke opposite direction mein ja rahe hain, to isse divergence kehte hain, aur yeh potential trend reversal ko indicate kar sakti hai.
- Overbought aur Oversold levels: CMF indicator overbought aur oversold levels ko bhi darust karne mein madadgar ho sakta hai. Overbought levels par selling ki sambhavna hoti hai, jabki oversold levels par buying ki sambhavna hoti hai.
-
Azaz5Senior Member
- Aug 2021
- 778
- 537
- 1196
- 1 569 USD
InstaSpot: کسی بھی EPS اور بینک سے منافع واپس لیں، اور EPS اور cryptocurrencies کے تبادلے پر 7% تک کمائیں۔
CMF, or Chaikin Money Flow, is a technical indicator used in technical analysis to evaluate the flow of money into or out of a security or financial instrument over a specified period. It was developed by Marc Chaikin and is based on the idea that price movements alone do not provide a complete picture of a security's strength or weakness; you also need to consider the volume of trading. Here are the key details of the CMF indicator: Calculation: CMF is calculated using price and volume data. The formula for CMF is as follows: CMF = (Sum of Money Flow Volume for n periods) / (Sum of Volume for n periods) Money Flow Volume (MFV) for a single period is calculated as [(Close - Low) - (High - Close)] / (High - Low) * Volume. "n" typically represents the number of periods you want to consider, often 21 periods are used. Interpretation: CMF values above zero indicate that money is flowing into the security, suggesting buying pressure. CMF values below zero indicate that money is flowing out of the security, suggesting selling pressure. The magnitude of the CMF value is also significant. A larger positive or negative CMF value indicates stronger buying or selling pressure, respectively. Overbought and Oversold Conditions: CMF is often used to identify overbought and oversold conditions. If the CMF is extremely high (well above zero), it may suggest that the security is overbought and could be due for a price correction. Conversely, if it is extremely low (well below zero), it may suggest that the security is oversold and could be due for a price rebound. Divergences: Traders also look for divergences between CMF and the price of the security. For example, if the price is making higher highs while the CMF is making lower highs, it could be a bearish divergence, indicating potential weakness in the uptrend. Signal Line: Some traders use a signal line (often a moving average of CMF values) to generate buy and sell signals. When the CMF crosses above the signal line, it can be considered a bullish signal, and when it crosses below, it can be considered a bearish signal. Timeframe: The choice of timeframe (e.g., daily, weekly, or intraday) for CMF analysis depends on the trader's investment horizon and trading strategy. Keep in mind that like all technical indicators, CMF has its strengths and weaknesses, and it should be used in conjunction with other forms of analysis to make informed trading or investment decisions. Additionally, it's essential to backtest and practice using the CMF indicator before relying on it in live trading. -
5shan12Junior Member
- Sep 2023
- 9
- 1
CMF (Chaikin Money Flow) ek technical indicator hai jo market ke momentum aur money flow ko measure karne ke liye istemal hota hai. Yeh indicator Marc Chaikin dwara develop kiya gaya tha aur iska main uddeshya yeh hota hai ki traders ko stock price movements ke sath sath volume ke changes ko bhi dekhein. CMF indicator ka istemal primarily stocks aur equity markets me kiya jata hai. CMF indicator ki key details aur components ye hoti hain: Money Flow Multiplier (MFM): Is indicator ka calculation MFM ke sath shuru hota hai. MFM ko calculate karne ke liye, aapko ek trading session ke "typical price" ko nikalna hota hai, jo ki (High + Low + Close) / 3 hota hai. Fir, MFM calculate kiya jata hai, jo formula se nikala ja sakta hai: [(Typical Price - Low) - (High - Typical Price)] / (High - Low). Money Flow Volume (MFV): MFM ko trading volume ke sath multiply karke MFV calculate kiya jata hai. Formula MFV ka hota hai: MFV = MFM * Volume. CMF Line: Ab, Money Flow Volume (MFV) ka cumulative total nikala jata hai. Yani, aap ek period ke MFV ko current period ke MFV ke sath add karte jaate hain. Is cumulative total ko fir trading range ke cumulative total se divide kiya jata hai. Isse CMF Line milta hai. CMF Line ko typically -1 se +1 tak ka range me represent kiya jata hai. Interpretation: CMF Line ka interpretation kuch is tarah se hota hai: Positive CMF Line: Agar CMF Line positive hai, to iska matlab hai ki buying pressure zyada hai aur market me money flow upar ki or hai. Yeh bullish signal ho sakta hai. Negative CMF Line: Agar CMF Line negative hai, to iska matlab hai ki selling pressure zyada hai aur market me money flow niche ki or hai. Yeh bearish signal ho sakta hai. Zero CMF Line: CMF Line ke zero ke aas-pass hona bhi ek indicator ho sakta hai, lekin isse clear signal milna mushkil hota hai. CMF indicator traders ke liye ek tool hai jisse woh market ke trend aur reversal points ka analysis kar sakte hain. Lekin, jaise ki kisi bhi technical indicator ke sath hota hai, iska istemal bina doosre technical aur fundamental analysis ke kiya jana chahiye. Market me trading karne se pehle, aapko is indicator ko acche se samajhna aur test karna chahiye. -
SkydiversSenior Member
- Mar 2023
- 1151
- 239
- 367
- 476 USD
Chaikin Money Flow (CMF) indicator ek momentum oscillator hai jo market mein buying aur selling pressure ko measure karta hai. Is indicator ko Marc Chaikin ne develop kiya tha, jo market mein money flow ko analyze karne ke liye ek effective tool hai. CMF ka main concept ye hai ke price aur volume ka combination market ke direction aur strength ka analysis karne mein madad karta hai. CMF indicator ko zero line ke around plot kiya jata hai, jahan positive values indicate karti hain ke market mein buying pressure hai, jab ke negative values selling pressure ko dikhati hain. Ye indicator traders ko is baat ka signal deta hai ke market mein kis taraf ka pressure zyada hai, aur ye kis taraf move kar sakta hai.

CMF Indicator ki Interpretation
CMF indicator ka main purpose market mein money flow aur pressure ko identify karna hota hai. Ye indicator traders ko ye signal deta hai ke market mein buying ya selling pressure zyada hai. Iski interpretation ka tareeqa kuch yun hai:- Positive CMF Value: Jab CMF value positive hoti hai, iska matlab ye hota hai ke market mein buying pressure hai. Ye indicate karta hai ke price close ho raha hai apne high ke qareeb, aur market mein strength hai. Ye bullish signal hota hai, jo ye dikhata hai ke price upward move karne ke chances zyada hain.
- Negative CMF Value: Jab CMF value negative hoti hai, iska matlab hota hai ke market mein selling pressure hai. Ye indicate karta hai ke price close ho raha hai apne low ke qareeb, aur market mein weakness hai. Ye bearish signal hota hai, jo ye dikhata hai ke price downward move karne ke chances zyada hain.
- Zero Line Cross: Zero line ka cross karna bohot important signal hota hai. Jab CMF value zero line ko cross karte hue negative se positive hoti hai, to ye ek bullish signal hota hai. Iska matlab hai ke market mein ab buying pressure zyada ho gaya hai. Aur jab CMF zero line ko cross karte hue positive se negative hoti hai, to ye ek bearish signal hota hai, jo dikhata hai ke market mein selling pressure zyada ho gaya hai.
CMF indicator ko trading charts mein as an oscillator plot kiya jata hai, jo zero line ke around fluctuate karta hai. Ye indicator trading platform ke niche plot hota hai, aur iski movement ko closely observe karte hue traders apne decisions lete hain.
Is indicator ki lines kabhi upar jati hain aur kabhi niche, jo market mein price aur volume ke relationship ko reflect karti hain. Agar CMF ki line consistently zero se upar hai, to ye market ke strong uptrend ko dikhata hai. Agar ye consistently zero se niche hai, to ye market ke strong downtrend ko indicate karta hai.
CMF Indicator ke Advantages
CMF indicator trading mein kaafi effective aur useful tool hai, aur iske kuch major advantages hain:- Volume aur Price ka Combination: CMF indicator volume aur price ka combination use karta hai jo market ke real pressure ko samajhne mein madad deta hai. Ye traders ko price action ke sath volume ka analysis karne mein help karta hai.
- Trend Confirmation: CMF indicator trend confirmation mein kaafi useful hota hai. Ye indicator existing trend ke sath consistency dikhata hai, aur jab market mein trend reversal aane wala hota hai, to CMF ke values usko indicate kar deti hain.
- Divergence Signals: CMF indicator divergence signals bhi provide karta hai, jo market ke potential reversals ko identify karne mein madadgar hote hain. Jab price aur CMF indicator opposite directions mein move karte hain, to ye divergence market ke sentiment mein change ko reflect karta hai.
- Overbought/ Oversold Conditions: Though CMF indicator directly overbought/oversold conditions ko identify nahi karta, lekin iski extreme positive ya negative values indirectly ye conditions dikhati hain. Jab CMF bohot zyada positive ho, to market overbought ho sakta hai, aur jab CMF bohot zyada negative ho, to market oversold ho sakta hai.
CMF indicator ko trade karte waqt kuch khas strategies ka istimal kiya jata hai jo traders ko profitable decisions lene mein madad deti hain.
1. CMF Zero Line Cross Strategy
Zero line cross strategy kaafi straightforward aur effective hai. Is strategy mein, traders CMF ki zero line ko closely monitor karte hain. Jab CMF zero line ko upar cross kare aur positive ho, to ye ek buying signal hota hai. Aur jab CMF zero line ko niche cross kare aur negative ho, to ye ek selling signal hota hai.
Example: Agar aapka CMF indicator negative tha lekin ab zero line ko cross kar ke positive ho gaya hai, to aap isko ek buying opportunity ke tor par le sakte hain. Is strategy ke sath aap apni positions ko timely adjust kar sakte hain.
2. CMF Divergence Strategy
CMF divergence strategy market ke potential reversals ko identify karne mein kaafi useful hoti hai. Is strategy mein, traders price aur CMF indicator ke darmiyan divergence ko observe karte hain.
Bullish Divergence: Ye tab hoti hai jab price new low banata hai lekin CMF higher low bana raha hota hai. Ye ek bullish signal hai aur indicate karta hai ke price uptrend mein move karne wala hai.
Bearish Divergence: Ye tab hoti hai jab price new high banata hai lekin CMF lower high bana raha hota hai. Ye ek bearish signal hai aur indicate karta hai ke price downtrend mein move karne wala hai.
Example: Agar price ne ek new low bana diya hai lekin CMF ne higher low bana kar divergence show kiya hai, to aap ye samajh sakte hain ke market mein ab reversal aane ke chances hain aur aap buying position consider kar sakte hain.
3. CMF Trend Confirmation Strategy
CMF indicator ko trend confirmation ke liye bhi use kiya ja sakta hai. Jab market ek uptrend ya downtrend mein hota hai, to CMF ke values us trend ko confirm karte hain.
Uptrend: Agar market uptrend mein hai aur CMF consistently positive hai, to ye trend confirmation hota hai aur aapko apni buying positions ko hold karna chahiye.
Downtrend: Agar market downtrend mein hai aur CMF consistently negative hai, to ye trend confirmation hota hai aur aapko apni selling positions ko hold karna chahiye.
Example: Agar market uptrend mein hai aur aapka CMF indicator consistently positive readings show kar raha hai, to aap apni buying positions ko hold kar sakte hain jab tak CMF negative na ho jaye.
CMF Indicator ki Limitations
Har trading indicator ki tarah, CMF indicator mein bhi kuch limitations hain jo traders ko samajhni chahiye.- False Signals: CMF indicator kabhi kabhi false signals bhi generate kar sakta hai, khas tor par jab market choppy ho ya kisi clear trend mein na ho. Is liye, is indicator ko akele rely karne se bachna chahiye aur doosre indicators ke sath isko use karna chahiye.
- Lagging Nature: CMF indicator kaafi hattak ek lagging indicator hai, kyunki ye past data par mabni hota hai. Is wajah se, ye market ke real-time changes ko jaldi reflect nahi kar pata.
- Overbought/ Oversold Levels: CMF indicator directly overbought/oversold levels ko indicate nahi karta. Is liye, agar aap overbought/oversold conditions ko identify karna chahte hain, to doosre indicators ka istimal karna chahiye.
- Dependence on Volume: CMF indicator ka calculation volume par mabni hoti hai. Agar kisi market mein volume inconsistent ho ya low ho, to CMF ke signals itne reliable nahi hote.
Chaikin Money Flow (CMF) indicator ek powerful tool hai jo market mein money flow aur pressure ko analyze karne mein traders ko madad deta hai. Iska combination of price aur volume ke sath isko ek unique indicator banata hai jo market ke sentiment ko samajhne mein helpful hota hai. CMF indicator ko trading mein mukhtalif strategies ke sath use kiya ja sakta hai, jaise ke zero line cross, divergence analysis, aur trend confirmation. Lekin har indicator ki tarah, CMF ke bhi kuch limitations hain jinko samajhna zaroori hai.
Trading mein success ke liye, hamesha multiple indicators ka combination use karna chahiye aur apni trading strategies ko diversify karna chahiye. CMF indicator ke sath agar aap doosre indicators jaise ke RSI, MACD, ya Moving Averages ka use karein, to aap apni trading decisions ko aur bhi enhance kar sakte hain. Trading mein discipline, patience, aur risk management bohot zaroori hota hai, aur CMF indicator aapko is journey mein ek valuable support provide kar sakta hai.
Believe in yourself and your abilities. When you fight for your dreams, you can achieve anything.
-
JawadbSenior Member
- Jan 2024
- 306
- 3
- 11
- 3 USD
InstaSpot: کسی بھی EPS اور بینک سے منافع واپس لیں، اور EPS اور cryptocurrencies کے تبادلے پر 7% تک کمائیں۔
Topic : CMF Indicator ki Details
CMF Indicator Kya Hai?
Chaikin Money Flow (CMF) ek technical indicator hai jo forex aur stock market mein market momentum aur strength ko measure karta hai. Yeh indicator Marc Chaikin ne develop kiya tha aur yeh traders ko market ke trend aur potential reversals ke baare mein guide karta hai. CMF ka istimaal price aur volume data ke zariye hota hai aur yeh bataata hai ke market mein buying ya selling pressure zyada hai.
CMF Indicator Ka Calculation:
CMF ko calculate karne ke liye Accumulation/Distribution (A/D) line ka use kiya jata hai. Is mein price aur volume ko combine karke ek value nikaali jati hai jo positive ya negative ho sakti hai. Agar CMF ka value positive ho, to iska matlab hai ke buying pressure zyada hai. Aur agar yeh value negative ho, to iska matlab selling pressure zyada hai.
Formula kuch is tarah hai:
CMF=Sum(MoneyFlowVolume×Period)Sum(Volume×Period)C MF = \frac{Sum (Money Flow Volume \times Period)}{Sum (Volume \times Period)}CMF=Sum(Volume×Period)Sum(MoneyFlowVolume× Period)
Yeh calculation 21-day period ke liye hoti hai, lekin traders isay apni trading strategy ke mutabiq modify kar sakte hain.
CMF Indicator Ko Kaise Interpret Karein?
CMF indicator ko interpret karne ke liye traders positive aur negative values ka analysis karte hain. Agar CMF 0 se upar ho, to yeh bullish signal hai, jo market mein buying interest ko show karta hai. Agar yeh 0 se neeche ho, to yeh bearish signal hai, jo selling interest ko dikhata hai.
Agar CMF indicator lagataar positive ho aur phir negative territory mein chala jaye, to yeh ek potential trend reversal ka signal ho sakta hai. Isliye traders isay apni buying ya selling decisions ke liye use karte hain.
CMF Indicator Ka Practical Istemaal:
CMF indicator ka istimaal trading strategy mein bohot faidemand ho sakta hai. Yeh indicator traders ko market ke trend ke mutabiq apni position adjust karne mein madad deta hai. Agar market bullish ho aur CMF positive territory mein ho, to traders buying opportunities dekh sakte hain. Waisa hi, bearish market mein jab CMF negative ho, to selling opportunities ka dekhna zaroori hai.
CMF Ki Limitations:
CMF indicator mein kuch limitations bhi hain. Yeh indicator hamesha accurate nahi hota aur kabhi kabhi false signals bhi de sakta hai. Isliye yeh zaroori hai ke CMF ko dusre indicators ke sath use kiya jaye taake better trading decisions liye ja sakein.
Conclusion:
CMF indicator ek valuable tool hai jo traders ko market momentum aur strength ko samajhne mein madad deta hai. Yeh buying aur selling signals ko identify karne mein madadgar hota hai, lekin isay apne trading strategy ke mutabiq dusre indicators ke sath combine karna chahiye. Is tarah, traders apne forex aur stock market trades ko zyada effectively manage kar sakte hain.
-
mabdulrehmanSenior Member
- Jul 2024
- 980
- 3
- 9
- 19 USD
CMF Indicator Kya Hai?
Chaikin Money Flow (CMF) indicator ek technical analysis tool hai jo market ke volume aur price movement ko dekh kar momentum ko measure karta hai. Yeh indicator traders ko yeh samajhne mein madad karta hai ke market mein paisa andar aa raha hai ya bahar ja raha hai. Yeh baat market ke trend aur potential reversal points ko identify karne mein help kar sakti hai.
CMF Ka Calculation Formula
CMF indicator ko calculate karne ka formula kuch is tarah se hota hai:
CMF = (Sum of Money Flow Multiplier x Volume over a specified period) / (Sum of Volume over the same period)
Money Flow Multiplier ko nikaalne ka formula yeh hai:
Money Flow Multiplier = [(Close - Low) - (High - Close)] / (High - Low)
Is calculation ka maksad yeh hota hai ke price action aur volume ko ek saath dekh kar market ke mood ka pata lagaya ja sake.
CMF Indicator Ko Kaise Use Kiya Jaata Hai?- Bullish Signal: Jab CMF ki value zero se zyada hoti hai, toh yeh indicate karta hai ke market mein buying pressure zyada hai. Iska matlab yeh hota hai ke price upar jaane ki potential rakhta hai.
- Bearish Signal: Agar CMF ki value zero se kam hoti hai, toh yeh selling pressure ko indicate karta hai. Iska matlab price neeche girne ki potential rakhta hai.
- Divergence: CMF aur price ke darmiyan divergence ko bhi dekhna zaroori hai. Agar price upar ja raha hai lekin CMF neeche ja raha hai, toh yeh ek bearish divergence hoti hai, jo potential trend reversal ka signal hoti hai. Isi tarah, agar price neeche ja raha hai aur CMF upar ja raha hai, toh yeh bullish divergence hoti hai.
CMF indicator ko alag alag timeframes par apply kiya ja sakta hai, lekin zyadatar traders 21-period CMF ko use karte hain. Yeh period sufficient hota hai taake market ke short-term aur medium-term trends ko samajha ja sake.
CMF Ki Kamiyaan
CMF indicator ki apni kuch limitations bhi hain. Kabhi kabhi yeh false signals bhi de sakta hai, khas tor par low-volume markets mein. Is wajah se isko doosre indicators ke saath mila kar use karna behtar hota hai. CMF ko alag se rely karne se trading decisions galat bhi ho sakte hain.
Conclusion
Chaikin Money Flow (CMF) indicator ek powerful tool hai jo price aur volume ke data ko combine karke market ke trend aur momentum ka pata lagata hai. Yeh indicator traders ko buying aur selling pressure ka analysis karne mein madad karta hai, lekin isko doosre indicators ke saath mila kar use karna chahiye taake zyada accurate trading decisions liye ja sakein. CMF indicator ko samajhna aur uska sahi use karna trading mein ek edge de sakta hai.
-
legoSenior Member
- May 2024
- 196
- 10
- 63 USD
CMF Indicator Kya Hai?
Chaikin Money Flow (CMF) indicator ek technical analysis tool hai jo market ke volume aur price movement ko dekh kar momentum ko measure karta hai. Yeh indicator traders ko yeh samajhne mein madad karta hai ke market mein paisa andar aa raha hai ya bahar ja raha hai. Yeh baat market ke trend aur potential reversal points ko identify karne mein help kar sakti hai.
CMF Ka Calculation Formula
CMF indicator ko calculate karne ka formula kuch is tarah se hota hai:
CMF = (Sum of Money Flow Multiplier x Volume over a specified period) / (Sum of Volume over the same period)
Money Flow Multiplier ko nikaalne ka formula yeh hai:
Money Flow Multiplier = [(Close - Low) - (High - Close)] / (High - Low)
Is calculation ka maksad yeh hota hai ke price action aur volume ko ek saath dekh kar market ke mood ka pata lagaya ja sake.
CMF Indicator Ko Kaise Use Kiya Jaata Hai?- Bullish Signal: Jab CMF ki value zero se zyada hoti hai, toh yeh indicate karta hai ke market mein buying pressure zyada hai. Iska matlab yeh hota hai ke price upar jaane ki potential rakhta hai.
- Bearish Signal: Agar CMF ki value zero se kam hoti hai, toh yeh selling pressure ko indicate karta hai. Iska matlab price neeche girne ki potential rakhta hai.
- Divergence: CMF aur price ke darmiyan divergence ko bhi dekhna zaroori hai. Agar price upar ja raha hai lekin CMF neeche ja raha hai, toh yeh ek bearish divergence hoti hai, jo potential trend reversal ka signal hoti hai. Isi tarah, agar price neeche ja raha hai aur CMF upar ja raha hai, toh yeh bullish divergence hoti hai.
CMF Indicator Ka Timeframe
CMF indicator ko alag alag timeframes par apply kiya ja sakta hai, lekin zyadatar traders 21-period CMF ko use karte hain. Yeh period sufficient hota hai taake market ke short-term aur medium-term trends ko samajha ja sake.
CMF Indicator ki Trading Strategies
CMF indicator ko trade karte waqt kuch khas strategies ka istimal kiya jata hai jo traders ko profitable decisions lene mein madad deti hain.
1. CMF Zero Line Cross Strategy
Zero line cross strategy kaafi straightforward aur effective hai. Is strategy mein, traders CMF ki zero line ko closely monitor karte hain. Jab CMF zero line ko upar cross kare aur positive ho, to ye ek buying signal hota hai. Aur jab CMF zero line ko niche cross kare aur negative ho, to ye ek selling signal hota hai.
Example: Agar aapka CMF indicator negative tha lekin ab zero line ko cross kar ke positive ho gaya hai, to aap isko ek buying opportunity ke tor par le sakte hain. Is strategy ke sath aap apni positions ko timely adjust kar sakte hain.
2. CMF Divergence Strategy
CMF divergence strategy market ke potential reversals ko identify karne mein kaafi useful hoti hai. Is strategy mein, traders price aur CMF indicator ke darmiyan divergence ko observe karte hain.
Bullish Divergence: Ye tab hoti hai jab price new low banata hai lekin CMF higher low bana raha hota hai. Ye ek bullish signal hai aur indicate karta hai ke price uptrend mein move karne wala hai.
Bearish Divergence: Ye tab hoti hai jab price new high banata hai lekin CMF lower high bana raha hota hai. Ye ek bearish signal hai aur indicate karta hai ke price downtrend mein move karne wala hai.
-
wish2Senior Member
- Aug 2024
- 392
- 5
- 2
InstaSpot: کسی بھی EPS اور بینک سے منافع واپس لیں، اور EPS اور cryptocurrencies کے تبادلے پر 7% تک کمائیں۔
**CMF Indicator Ki Details**
Chaikin Money Flow (CMF) indicator aik mashhoor tool hai jo traders ke liye market momentum aur buying aur selling pressure ko samajhne mein madadgar hota hai. Yeh indicator Marc Chaikin ne develop kiya tha aur yeh price aur volume ko analyze karke market ki strength ko measure karta hai. CMF ko asan alfaaz mein yeh samjha ja sakta hai ke yeh humein bataata hai ke market mein paisa aa raha hai ya nikal raha hai.
**CMF Indicator Ka Formula aur Calculation**
CMF indicator ka calculation volume weighted average price (VWAP) par base hota hai. Isko calculate karne ke liye kuch steps follow kiye jate hain:
1. **Money Flow Multiplier:** Yeh multiplier is tarah calculate hota hai:
\[
Money \, Flow \, Multiplier = \frac{(Close - Low) - (High - Close)}{High - Low}
\]
2. **Money Flow Volume:** Yeh multiply kiya jata hai Money Flow Multiplier ko Volume ke sath:
\[
Money \, Flow \, Volume = Money \, Flow \, Multiplier \times Volume
\]
3. **CMF Calculation:** Aik specified period (aksar 21 ya 20 days) ke liye Money Flow Volume ko sum kiya jata hai aur usko total volume se divide kiya jata hai.
**CMF Indicator Ki Interpretation**
CMF indicator ko samajhne ke liye iski values ko dekhna zaroori hai. Agar CMF ka value zero se zyada ho, to iska matlab yeh hota hai ke market mein bullish trend hai, yaani buying pressure zyada hai. Agar CMF zero se neeche ho, to iska matlab bearish trend hai, yaani selling pressure zyada hai.
Traders aksar CMF ko trend reversal ya continuation ke signals ko identify karne ke liye use karte hain. Agar CMF positive se negative ki taraf jaye, to yeh selling signal ho sakta hai, aur agar negative se positive ho, to yeh buying signal ho sakta hai.
**CMF Ko Use Karne Ki Tips**
1. **Combination with Other Indicators:** CMF ko akela use karna hamesha effective nahi hota. Isliye isko dusre indicators ke sath combine karna chahiye, jese ke RSI ya Moving Averages.
2. **Divergences:** Agar price aur CMF ke darmiyan divergence ho, to yeh strong trend reversal ka signal ho sakta hai.
3. **Time Frame Selection:** Aapke trading style ke mutabiq time frame ka election karna zaroori hai. Short term traders ke liye choti time frames, jabke long term traders ke liye badi time frames use karni chahiye.
CMF indicator aik powerful tool hai, magar isko samajhkar aur correct context mein use karna zaroori hai. Iska sahi istemal aapko better trading decisions lene mein madad de sakta hai.
-
shannySenior Member
- Jul 2024
- 913
- 1
- 8
- 34 USD
### CMF Indicator ki Details
Chaikin Money Flow (CMF) indicator, ek popular technical analysis tool hai jo market ki liquidity aur price trends ko analyze karne ke liye use hota hai. Yeh indicator Richard Chaikin ne develop kiya tha, aur iska maqsad hai trading volume aur price action ko combine karke market ke trend ko identify karna.
CMF indicator ki basic concept yeh hai ke woh volume aur price ka combination dekh kar trend ke direction ko samajhne ki koshish karta hai. Yeh indicator ek specific period ke dauran, price aur volume ki relationship ko analyze karta hai aur ek value generate karta hai jo positive ya negative ho sakti hai.
CMF indicator ko use karte waqt, traders yeh dekhte hain ke indicator ki value positive hai ya negative. Agar CMF ki value positive hai, to iska matlab hai ke buying pressure zyada hai aur market bullish hai. Iska reverse bhi hai; agar CMF ki value negative hai, to iska matlab hai ke selling pressure zyada hai aur market bearish hai.
CMF indicator ka calculation price aur volume ko combine kar ke kiya jata hai. Pehle, aapko Accumulation/Distribution Line calculate karni hoti hai, jo price aur volume ke relationship ko reflect karti hai. Phir, yeh Accumulation/Distribution Line ko specific period ke liye average kiya jata hai, jisse CMF value milti hai. Yeh value typically 20-day ya 50-day period ke liye calculate ki jati hai.
Traders CMF indicator ka use karte hain market ki strength aur weakness ko identify karne ke liye. Agar CMF aur price trend ke direction match karte hain, to market trend ko confirm kiya jata hai. Lekin, agar CMF aur price trend ke direction opposite hain, to yeh divergence signal hota hai jo trend reversal ki possibility ko indicate karta hai.
CMF indicator ka use market ke liquidity ko bhi measure karne ke liye kiya jata hai. Agar CMF ki value high hai, to yeh indicate karta hai ke market mein strong buying ya selling activity ho rahi hai, jo market ki liquidity ko impact karta hai.
Summarize karte hue, CMF indicator ek valuable tool hai jo traders ko market ke trend aur liquidity ke baare mein insights provide karta hai. Iska proper use kar ke traders accurate trading decisions le sakte hain aur market movements ko better samajh sakte hain.
-
MR SADDAMSenior Member
- Jun 2024
- 263
- 10
- 30 USD
### CMF Indicator ki Details
Chaikin Money Flow (CMF) indicator, ek popular technical analysis tool hai jo market ki liquidity aur price trends ko analyze karne ke liye use hota hai. Yeh indicator Richard Chaikin ne develop kiya tha, aur iska maqsad hai trading volume aur price action ko combine karke market ke trend ko identify karna.
CMF indicator ki basic concept yeh hai ke woh volume aur price ka combination dekh kar trend ke direction ko samajhne ki koshish karta hai. Yeh indicator ek specific period ke dauran, price aur volume ki relationship ko analyze karta hai aur ek value generate karta hai jo positive ya negative ho sakti hai.
CMF indicator ko use karte waqt, traders yeh dekhte hain ke indicator ki value positive hai ya negative. Agar CMF ki value positive hai, to iska matlab hai ke buying pressure zyada hai aur market bullish hai. Iska reverse bhi hai; agar CMF ki value negative hai, to iska matlab hai ke selling pressure zyada hai aur market bearish hai.
CMF indicator ka calculation price aur volume ko combine kar ke kiya jata hai. Pehle, aapko Accumulation/Distribution Line calculate karni hoti hai, jo price aur volume ke relationship ko reflect karti hai. Phir, yeh Accumulation/Distribution Line ko specific period ke liye average kiya jata hai, jisse CMF value milti hai. Yeh value typically 20-day ya 50-day period ke liye calculate ki jati hai.
Traders CMF indicator ka use karte hain market ki strength aur weakness ko identify karne ke liye. Agar CMF aur price trend ke direction match karte hain, to market trend ko confirm kiya jata hai. Lekin, agar CMF aur price trend ke direction opposite hain, to yeh divergence signal hota hai jo trend reversal ki possibility ko indicate karta hai.
CMF indicator ka use market ke liquidity ko bhi measure karne ke liye kiya jata hai. Agar CMF ki value high hai, to yeh indicate karta hai ke market mein strong buying ya selling activity ho rahi hai, jo market ki liquidity ko impact karta hai.
Summarize karte hue, CMF indicator ek valuable tool hai jo traders ko market ke trend aur liquidity ke baare mein insights provide karta hai. Iska proper use kar ke traders accurate trading decisions le sakte hain aur market movements ko better samajh sakte hain.
-
<a href="https://www.instaforex.org/ru/?x=ruforum">InstaForex</a> -
usmanalikhan9870Senior Member
- May 2024
- 463
- 2
- 24
- 113 USD
InstaSpot: کسی بھی EPS اور بینک سے منافع واپس لیں، اور EPS اور cryptocurrencies کے تبادلے پر 7% تک کمائیں۔
### CMF Indicator ki Details
Chaikin Money Flow (CMF) indicator, ek popular technical analysis tool hai jo market ki liquidity aur price trends ko analyze karne ke liye use hota hai. Yeh indicator Richard Chaikin ne develop kiya tha, aur iska maqsad hai trading volume aur price action ko combine karke market ke trend ko identify karna.
CMF indicator ki basic concept yeh hai ke woh volume aur price ka combination dekh kar trend ke direction ko samajhne ki koshish karta hai. Yeh indicator ek specific period ke dauran, price aur volume ki relationship ko analyze karta hai aur ek value generate karta hai jo positive ya negative ho sakti hai.
CMF indicator ko use karte waqt, traders yeh dekhte hain ke indicator ki value positive hai ya negative. Agar CMF ki value positive hai, to iska matlab hai ke buying pressure zyada hai aur market bullish hai. Iska reverse bhi hai; agar CMF ki value negative hai, to iska matlab hai ke selling pressure zyada hai aur market bearish hai.
CMF indicator ka calculation price aur volume ko combine kar ke kiya jata hai. Pehle, aapko Accumulation/Distribution Line calculate karni hoti hai, jo price aur volume ke relationship ko reflect karti hai. Phir, yeh Accumulation/Distribution Line ko specific period ke liye average kiya jata hai, jisse CMF value milti hai. Yeh value typically 20-day ya 50-day period ke liye calculate ki jati hai.
Traders CMF indicator ka use karte hain market ki strength aur weakness ko identify karne ke liye. Agar CMF aur price trend ke direction match karte hain, to market trend ko confirm kiya jata hai. Lekin, agar CMF aur price trend ke direction opposite hain, to yeh divergence signal hota hai jo trend reversal ki possibility ko indicate karta hai.
CMF indicator ka use market ke liquidity ko bhi measure karne ke liye kiya jata hai. Agar CMF ki value high hai, to yeh indicate karta hai ke market mein strong buying ya selling activity ho rahi hai, jo market ki liquidity ko impact karta hai.
Summarize karte hue, CMF indicator ek valuable tool hai jo traders ko market ke trend aur liquidity ke baare mein insights provide karta hai. Iska proper use kar ke traders accurate trading decisions le sakte hain aur market movements ko better samajh sakte hain.
Working...
تبصرہ
Расширенный режим Обычный режим