What is the bullish kicking candlestick pattern?
-
Khobaib1918Senior Member

- Mar 2023
- 172
- 2
- 15
- 3 USD
-
<a href="https://www.instaforex.org/ru/?x=ruforum">InstaForex</a> -
Khobaib1918Senior Member
- Mar 2023
- 172
- 2
- 15
- 3 USD
OVERVIEW OF THE BULLISH KICKING CANDLESTICK PATTERN : Bullish Kicking candlestick pattern, aik do-candle reversal pattern hai jo aam taur par downtrend ki bottom par hota hai, aur ye ek potentialbullish reversal ki taraf ishara karta hai. Ye pattern aik lambi black (ya red) candle se shuru hota hai, jis ke baad aik lambi white (ya green) candle aati hai jo pehlay din ki close se upar khulti hai. Bullish Kicking pattern bearish se bullish market sentiment ki shifting ki nishani hai aur aksar price mein significant upward move se pehle hota hai. INTERPRETATION OF THE BULLISH KICKING CANDLESTICK PATTERN : Jab Bullish Kicking pattern ki tashreeh ki jati hai, toh traders pehle wale downtrend ki size aur ahmiyat ko dhyan mein rakhte hain. Jitna lamba pehle wala downtrend ho, us reversal signal ki taqat utni hi zyada maani jati hai. Is ke alawa, do candles ki lambai aur rang bhi ahmiyat rakhte hain. Pehli candle reltaively lambi aur bearish honi chahiye, jis se strong selling pressure ka pata chalta hai. Dosri candle, waise hi, lambi aur bullish honi chahiye, jis se sudden surge in buying power ka pata chalta hai. Is ke ilawa, dusri candle pehley din ki close se upar khulti honi chahiye, reversal signal ko confirm karte hue. CONFIRMATION AND VOLUME CONSIDERATIONS : Taake trading ki kamiyabi ke imkanat ko barhane ke liye, traders Bullish Kicking pattern ke base par bullish position mein dakhil hone se pehle mazeed tashdeed ki taraf dekhte hain. Is ke liye candle formation ke doran volume patterns ka tafsili jaaiz karte hain. Ideally, bullish candle ki formation ke doran volume mein noticeable izafa hona chahiye, jis se strong buying interest ka pata chalta hai. Is ke ilawa, traders dosre indicators, jaise moving averages ya oscillators, ki madad se bhi Bullish Kicking pattern dwara diye gaye reversal signal ko taslem karte hain. POTENTIAL TRADING STRATEGIES AND RISK MANAGEMENT : Jab Bullish Kicking pattern pehchan liya jaye aur tasdeeq bhi ho, toh traders ko mumkin bullish reversal se faida uthane ke liye various trading strategies ko apnana chahiye. Aik aisi strategy hai ke third candle ke open par long trade ko enter kiya jaye, Bullish Kicking pattern ke low se neeche stop-loss order lagate hue. Is se traders apna risk kam kar sakte hain aur apne aap ko is surat-e-hal se bacha sakte hain ke reversal asal ho na jaye. Beshak, aggressive traders Bullish Kicking pattern ki tasdeeq ke baad hi long trade mein dakhil hona chunte hain, agli candle ke intezaar ke bina. Lekin, is tareeqe mein risk level zyada hota hai. LIMITATIONS AND CONSIDERATIONS : Jabki Bullish Kicking pattern potential bullish reversals ki sahi samjh se nawaz sakta hai, lekin iski hadood ko samajhna bhi zaroori hai. Jaisa ke sabhi candlestick patterns, Bullish Kicking pattern bhi mukammal nahi hota aur false signals bhi de sakta hai. Is liye traders ko ise dusre technical analysis tools aur indicators ke saath istemal karne ki salahiyat mein barhane ke liye istemal karna chahiye. Is ke ilawa, zaroori hai ke markets dynamic hotay hain aur changing conditions ka samna karte hain. Isliye, sahi risk management aur changing market conditions ke sath adapt ho kar chalna Bullish Kicking pattern ka istemal karke safal trading ke liye ahmiyat rakhta hai. -
Realome98Senior Member
- May 2024
- 1187
- 1
- 149
- 283 USD
Assalamu Alaikum Dosto!Bullish Kicking Pattern
Technical charts ki tajaweez mein, financial marketon ka tafseeli tehqiqat mein, aik wide range of candle patterns hoti hai. Ye reversals, frequencies, volumes, etc. ko indicate kar sakti hain. Bullish kicking pattern aik aisa pattern hai jo ek upward trend reversal ko darust karti hai.
Isay Japanese mein Keri Ashi kehte hain. Iska maqsad puri taajub aur shadeed mukhalif ka tasweer hai. Bullish kick aik bohat taqatwar pattern hai. Pattern banne se pehle ki trend ki kuch ahmiyat nahi hoti.
Ye candlestick types aapko ek upward reversal trend ka paishgoi karne mein madad karengi. Trader ko anaysis ki scale ko haftay, mahinay, ya daily data par customize karna chahiye. Ye us time period par depend karta hai jise usay mutalia karna hai aur ye short term ya long term analysis haihai. tajaweez bhi un investors ke liye munasib hai jo 10 se 30 minute mein dakhilat karna chahte hain. Traders aam taur par is technique ko short-term day tradings mein istemal karte hain.
Behtar taawil ke liye, candlestick pattern ko banane wali candles ke bodies aur shadows ki size ko ahmiyat di jani chahiye. For example, aam taur par aik candle jismein relatively bara body ho, woh significant pressure ko darust karegi. Pressures utni zyada hongi jitne chhote shadows honge. Behtar hai ke aap large candles with small shadows ko observe karein taake aap movement mein rahain aur ulte direction mein na chalein. Akhir mein, har movement ko hamesha significant transaction volumes ke sath hona chahiye.
Candlestick Formation
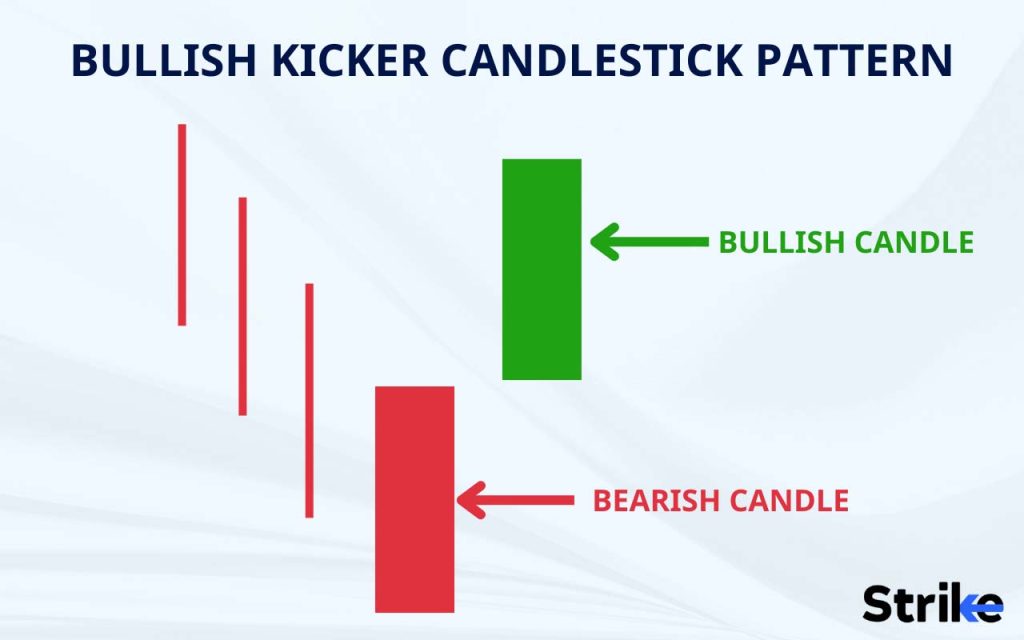
Bullish kicking candlestick pattern prices k downtrend ya lower par high demand ki waja se banta hai, jahan par trend reversal k ziada imkanat hote hen. Pattern main shamil pehli candles bearish hoti hai, issi waja se pattern k leye prices ka pehle se low area ya bearish trend main hona zarori hai. Pattern ki dosri candle aik bullish candle hone ki waja se prices bullish trend reversal ka sabab banti hai. Two days candles ki accuracy single day pattern se behtar hota hai, q k iss main aik candle thori bohut confirmation bhi deti hai. Jab bhi market main buyers prices ko aik khas level tak ooper push karte hen, to yahan par trend reversal k imkanat ziada hote hen, ye trend confirmation aksar kuch pattern se confirm ho jati hai, jiss main bullish kicking pattern bhi shamil hai. Pattern main shamil candles mukhtalif pattern ki yanni bearish aur bullish hoti hen, jiss ki formation darjazzel tarah se hoti hai;- First Candle: Bullish kicking candlestick pattern ki pehli candle aik bearish candle hoti hai, jo k prices ko downtrend ya bearish trend ki akasi karti hai. Ye candle bearish trend ko mazeed nechay ki taraf push karti hai, aur market main low demand ko zahir karti hai. Ye candle aik normal real body wali candle hoti hai.
- Second Candle: Bullish kicking candlestick pattern ki dosri candle aik bullish candle hoti hai. Ye candle pehli candle k top par gap main open hoti hai, aur close bullish real body banane k baad above par hoti hai. Pattern ki dono candles aik dosre k qareeb open hote hen, jab k close aik dosre k opposite direction main close hote hen. Pattern ki dosri candle trend k opposite direction aur pehli candle k upper side par banne ki waja se prices k mojoda trend k khatme ka bahis banti hai.
Explaination
"Bullish kicker" candlestick structure ko aik pehli red marubozu candle ke baad aane wale doosre green marubozu candlestick se banaya jata hai jo aik bullish gap mein khulta hai. "Bullish kicker" candlestick pattern aik lambay downtrend aur bear-controlled market mein aata hai. Ye structure bullish candle hai aur ye strong indication deta hai ke bulls market ko lead kar rahe hain.
Amm taur par, market ki direction zyada ahmiyat nahi rakhti, bilkul aksar dusre candle patterns ke mukable mein. Is tarah, ye pattern bullish ya bearish market mein barabar kaam karta hai. "Bullish kicker" candlestick structure ko do candlesticks bina kisi shadow ke ya phir bohot chhote shadows ke sath banna chahiye. Ye patterns marubozu ke tarah hoti hain.
Bullish kick aik pattern hai jo do Japanese candlesticks se banata hai. Pehli candle bearish marubozu (red) hoti hai, jise ek bullish marubozu (green) follow karta hai jo aik bara bullish gap mein khulta hai. Dusra candle ka open price pehle candle ke open price se ziada hona chahiye.- Khasoosiyat: Bullish kick aksar aik significant decline ke baad banata hai jo ke kai large red Japanese candlesticks ke zariye characterize hota hai.
- Meaning: Bullish kick ek upward trend reversal ko darust karnay wala pattern hai. Iska tasawwur puri taajub aur shadeed mukhalif ka hota hai. Bullish kick bohat taqatwar pattern hai aur iske banne se pehle ki trend ki kuch ahmiyat nahi hoti.
- Invalidation: Bullish kicker invalid ho jata hai agar aglay candlestick bullish nahi hoti ya phir aik naya bullish gap nahi khulta.
- Confirmation Is candlestick pattern ki tasdeeq karne ke liye iske third day par aik structure confirmation ki zarurat hai. Upward trend ko bullish gap, green candlestick, ya next trading day mein prices ki izafah ke zariye tasdeeq kiya jana chahiye. "Bullish kicking" pattern ki tasdeeq trend reversal ko materialize hone ke liye zaroori hai.
Volume
Jaise ke Japanese figures par mabni patterns mein, stock market prices ki taqseem ki prediction ko agle session ke zariye tasdeeq kiya jana chahiye. "Bullish kick" figure ki tasdeeq honay par iski kamzor ho jati hai.
Traders ka khayal hai ke agar high volumes ke sath trading kiya jaye toh price trend ya reversal ka ziada predictability hota hai. For example, agar hamare Japanese candlestick context mein opening price aur closing price ke darmiyan bara farq ke sath large volume ke sath figure banay, toh is candle ki tasdeeq hone ki koi achi imkan hoti hai.
Yeh pattern MT4 aur MT5 trading software se dekha ja sakta hai. Is pattern ko detect karne ke liye aap import ya develop bhi kar sakte hain. "Bullish kicking" pattern har investment horizon ke liye munasib hai, chahe aap bohot chhote time period ki trading kar rahe hain ya phir ziada lambi unit ki. Ye aapke investor profile par depend karta hai. Lambi-term investment ke liye aapko munasib time unit istemal karna behtar hoga - haftay ya mahine. Ulta, chhote time period ke liye aik ghante ya din ki periodicity perfect hogi.
Dosre Patterns k Sath Istemal
Aap hamesha candlestick patterns ki itni bharosa mandi ke bare mein kisi had tak yaqeen kar sakte hain. Taqreeban tamam patterns mein, technical analysis ke doosre patterns ke sath milakar behtar natijay aur success rate hasil karne ka tajaweez hai. Statistics ke mutabiq, bullish kicker 53 percent waqt bullish reversal ke taur par kaam karta hai. Ye kafi haphazard hai, is liye sirf is candlestick pattern ki madad se breakout ki direction ko guess karne ki koshish na karein.
Yahan kuch indicators hain jo traders aksar bullish kicking pattern ke sath istemal karte hain taake market mein reversals ko behtar predict kiya ja sake.- Wedges: Wedge ek symmetrical triangle ke barabar hota hai jo ke upar ki taraf inclined hota hai (ascending wedge ya "rising wedge") ya neeche ki taraf (falling wedge ya "falling wedge"). Inki mawafiqat triangles ki tarah hoti hain, lekin ye puri tarah alag hote hain kyun ke bevel trend ke end mein hota hai aur ismei uske change ki taraf ishara karta hai.
- V-bottom aur V-top: "V" bottom ek downtrend ke end par hota hai. Iska pehla hissa downtrend mein taizi se izafay ko darust karta hai jo aik sell-off (final panic selling) ki taraf le jata hai. Niche hone par, hum ek tez izafay aur buyers ke strong comeback ko dekhte hain. "V" top ulta configuration hai aur ye ek uptrend ke end ko darust karta hai. Rounding bottom ke opposite hai, jo ke asteene mein tabdili ki taraf ishara karta hai. Is liye breakout aam taur par tez hota hai aur isay strong volumes ke sath dekha jata hai.
- Head and Shoulders: Head and shoulders candlestick pattern aik major reversal pattern hai, jo ke chartist circles mein aik mashhoor pattern hai. Iska naam iski khas shakal ke liye hai, jo ke aik head aur do shoulders ko darust karta hai. Ye figure aik lambi upward trend ke baad paida hota hai aur ismein teen mubtadil chhote peaks shamil hote hain, jismein pehla aur teesra aam taur par barabar ke hote hain, jabke doosra relatively ziada hota hai.
Trading
Bullish Kicking candlestick pattern aik taqatwar technical analysis pattern hai jo ek downtrend se uptrend ki taraf mukhtalif hone ki mumkin nishaan deta hai. Yeh pattern investor sentiment mein taqatwar tabdeeli ko darust karta hai, jahan ek bullish candle ek bearish candle ke baad aata hai, jo market direction mein reversal ko zahir karta hai. Bullish Kicking pattern ko market dynamics mein significant tabdeeli ko darust karne ki khaas salahiyat ke liye maqbool samjha jata hai. Jab yeh pattern zahir hota hai, to iska matlab hota hai ke buyers market par qabza kar rahe hain, jo prices mein ek potential upward movement ki taraf le ja sakta hai. Bullish Kicking pattern apni taaqat aur taqatwar fitrat ke liye maqbool hai, jo candlestick analysis mein ek numaya pattern hai.- Confirmation: Traders ko Bullish Kicking pattern ko mazeed bullish movement ke saath confirm karna chahiye, jaise ke continued uptrend, white candles, ya ek gap up.
- Entry Points: Traders Bullish Kicking pattern ko pehchanne ke baad long positions mein dakhil ho sakte hain, ek potential uptrend ki umeed ke saath.
- Risk Management: Breakout point ke neeche stop-loss orders set karna risk ko manage karne mein madadgar ho sakta hai agar pattern ki umeed ke mutabiq price movement na ho.
- Volume Analysis: Breakout ke doran trading volume ka nigrani karna pattern ki taqat ka mazeed tasdeeq faraham kar sakta hai.
- Target Levels: Traders target levels ko pattern ki unchai ya ahem support aur resistance levels ke hisab se set kar sakte hain.
Bullish Kicking candlestick pattern ek downtrend se uptrend ki taraf ek potential trend reversal ka mazboot nishaan hai. Traders is pattern ko entry points ko pehchanne, risk ko manage karne, aur forex market mein potential price movements ka faida uthane ke liye istemal kar sakte hain.
Conclusion
Technical analysis mein kayi indicators hote hain jo aapko sahi rah par le jane mein madad karte hain. Yeh kushaamad hai ke aapko unmein se kuch maloom ho taake aap stock market mein behtar invest kar sakein.
Lekin iske bawajood, aapko asoolon ko janna zaruri hai. Is ke liye, focus karen un technical elements par jo aapko asaan samajhne mein madad karte hain. Aapko khushi hogi maloom karke ke kuch technical setups hain jo 80% qareeb predictability dete hain, jo ek argument hai jo aapko beparwah nahi chhodta.
Lekin unki bunyad par ye hai ke ye investors ke rawaiyon mein insight hasil karte hain. Is tarah, aap apne graphic screens par unke amal ko jasoos kar sakte hain. Ye hai tawajju ke sath un major tools hain jo technical analysis mein asli weapons hote hain. Inmein stock market ke trend ki reliability ya uske khilaf technical signals dete hain.
Kuch aise honge jo aapki screen par aik jhalak mein mushkil se dikhai denge. In chart setups ko samajhne ke liye, aapko is chart par bohot ghante guzarne ki zarurat hogi. Beshak, hum aapko har haftay apne weekends qurbaan karne ko nahi keh rahe hain. Sirf is figure ki exit ko validate karne ke liye ek ya do aur candles ka intezaar karein.
Zyada statistics par bharosa na karein, halaanke ye aapko invest karne mein madad karte hain. Yaad rakhein ke koi perfect chart patterns nahi hote. Ye na koshish karein ke inko draw karne mein puri perfection hasil karein kyun ke aap apni technical analysis mein uncertainty create kar sakte hain. -
ShokeenSenior Member
- Mar 2024
- 2292
- 67
- 103
- 876 USD
**Bullish Kicking Candlestick Pattern Kya Hai?**
Bullish Kicking candlestick pattern ek bullish reversal pattern hai jo market mein potential trend change ko indicate karta hai. Yeh pattern typically ek downtrend ke baad form hota hai aur bullish momentum ke strong entry ka signal deta hai. Is pattern ko samajhna traders ke liye zaroori hai takay market trends ko predict karke profitable trading decisions liye ja sakein.
**Bullish Kicking Pattern Ki Pehchaan:**
Bullish Kicking pattern do candlesticks se mil kar banta hai - ek bearish candlestick (pehla candle) aur ek bullish candlestick (dusra candle). Is pattern ki characteristics include:
1. **Pehla Candle (Bearish Candle)**: Pehla candle ek downtrend ke continuation ko represent karta hai. Yeh candle typically lambi bearish body ke saath close hota hai, jo selling pressure ko indicate karta hai.
2. **Dusra Candle (Bullish Candle)**: Dusra candle pehle candle ke neeche open hota hai lekin bullish sentiment ke saath close hota hai. Is candle ka closing price pehle candle ki body ke upar hota hai, jo ek strong bullish reversal signal hota hai.
**Bullish Kicking Pattern ka Matlab:**
Bullish Kicking pattern ka formation ek strong bullish sentiment ko indicate karta hai. Pehle candle mein bearish trend ke continuation ke baad dusre candle mein sudden bullish reversal ka strong indication hota hai. Yeh pattern typically short-term bullish trend ko start karta hai aur traders ko buying opportunities provide karta hai.
**Bullish Kicking Pattern ke Saath Trading Strategy:**
1. **Pattern Confirmation**: Pehle Bullish Kicking pattern ko identify karen. Ensure karen ke pehle candle ek downtrend ko represent karta hai aur dusre candle strong bullish momentum ke saath close hota hai.
2. **Entry Point**: Bullish Kicking pattern confirm hone ke baad long position enter karen. Entry point dusre candle ke closing price ke upar ya pehle candle ki high ke qareeb set karen.
3. **Stop-Loss Placement**: Risk management ke liye stop-loss level set karna zaroori hai. Stop-loss typically pehle candle ke low ke neeche set kiya jata hai takay unexpected price movements se protection mile.
4. **Target Setting**: Price targets set karen jo potential resistance levels ko consider karte hue realistic hon. Aap previous highs ya Fibonacci retracement levels ko use kar sakte hain target setting ke liye.
5. **Risk-Reward Ratio**: Trading decision lete waqt risk-reward ratio ka analysis zaroor karen. Ensure karen ke potential reward aapke risk se zyada ho.
**Bullish Kicking Pattern ke Advantages:**
- **Clear Bullish Reversal Signal**: Yeh pattern market mein strong bullish sentiment ko clear tarike se indicate karta hai jo profitable trading opportunities create kar sakta hai.
- **Easy Identification**: Is pattern ki clear characteristics ki wajah se iski pehchaan asaan hoti hai.
**Important Tips:**
- **Volume Analysis**: Bullish Kicking pattern ki confirmation ke liye volume analysis zaroor karen. Higher volume dusre candle par pattern ki reliability ko increase karta hai.
- **Market Conditions**: Overall market conditions ko consider karna zaroori hai. Strong trending market mein Bullish Kicking pattern ki reliability zyada hoti hai.
Bullish Kicking candlestick pattern ek powerful tool hai jo market sentiment aur price action ko samajhne mein madad deta hai. Is pattern ka sahi istemal karte hue trading strategies develop karen aur thorough analysis aur risk management ko implement karen takay trading mein success hasil ki ja sake.
-
<a href="https://www.instaforex.org/ru/?x=ruforum">InstaForex</a> -
Sara_ali_traderSenior Member
- Sep 2021
- 1367
- 182
- 660
- 927 USD
what is bullish kicking candlestick pattern
forex market mein bullish kicking candlestick pattern aik kesam ka technical chart pattern hota hey es ke pehchan mein anay wala bullish trend he hota hey jo keh forex market mein bullish reversal signal ko he identify kar sakta hey jo keh forex market kay jazbaat mein achanak say bullish say bearish ke tabdele ko he identify kar sakta hey forex market mein long candlestick es bat ko he identify kar sakte hey keh forex market kay trend mein tabdele anay wale hey or trend bearish say bullish mein tabdel ho jata hey
bullish kicker pattern ke tashkeel
forex market mein bullish kicker pattern os time banta hey jab forex market mein aik long bearish candlestick kay
bad sab say long bullish candlestick bante hey jo keh forex market kay pechlay den ke close price say oper open ho sakte hey yeh forex market kay selling kay strong trend ko identify kar sakta hey laken yeh eality mein pechlay den ke close price say he oper open ho sakte hey yeh es bat ke taraf eshara ho sakta hey keh buying presure kam ho raha hey jes ke price ke wajah say he bullish mein ezafa ho sakta hey bearish say bullish market kay jazbaat mein achanak say he tabdele aate jate hey trader zyada tar es pattern ko mumkana buying kay chance kay sath he identify kar saktay hein
Bullish kicker pattern ke pehchan
forex market kay price kay chart par 2 candlestick ko talash karna chihay jo keh forex market mein bullish kicker pattern ko he identify kar sakte hein pehle candlestick aik long red ya black candlestick hote hey dosree candlestick jo keh pehle candlestick kay foran bad he zahair hote hey yeh forex market mein aik long white or gren candlestick he ho sakte hey jo keh es candlestick pattern ko mokamal tor par he gaihr layte hey nechay de gai tasweer ka analysis kar kay daikh saktay hein
forex market ka trend chalta chalta achanak say bearish say bullish mein tabdel ho jata hey forex market ky trader ko high trading volume or gap mel jata hey jo keh first or 2nd candlestick ke confirmation kay sath melta hey
bullish kicker pattern technical analysis
forex market mein bullish kicker pattern ka estamal kartay hovay pehla step yeh hota hey keh forex market mein technical analysis ka estamal kartay hovay market kay g trend ke pehchan ke jate hey aik long green candestick hote hey jo keh pechlay day say he high ho jate hey
forex market kay trend ka analysis karnay kay ley technical analysis momentum trend or raftar ka he analysis keya ja sakta hey confirmation kay bad trader tesaree candlestick ke long position mein he eter ho sakta hey momentum ko kam karnay kay ly or account ke hefazat karnay kay ley pechle red candlestick kay nechay stop loss set karna chihay
 bhali kay badlay bhali

اب آن لائن
Working...
تبصرہ
Расширенный режим Обычный режим