What is technical analysis
-
aaniSenior Member

- Jun 2021
- 692
- 327
- 1230
- 544 USD
-
<a href="https://www.instaforex.org/ru/?x=ruforum">InstaForex</a> -
aaniSenior Member
- Jun 2021
- 692
- 327
- 1230
- 544 USD
Technical analysis ek stock market analysis ka method hai jisme past price movements, volume data, aur other market indicators ka istemal kiya jata hai to predict future price movements. Is method ka istemal traders aur investors karke market trends, entry/exit points, aur trading strategies ko samajhne mein madad milti hai. Fayday: 1. Price patterns aur indicators ki samajh: Technical analysis traders ko price patterns aur indicators ki madad se market trends aur price movements ko samajhne mein madad karta hai. Isse unhe trading decisions lene mein asani hoti hai. 2. Entry/exit points ka pata lagana: Technical analysis traders ko entry aur exit points ka pata lagane mein madad karta hai. Price movements, support aur resistance levels, aur other indicators ki madad se traders sahi samay par trade kar sakte hain. 3. Risk management: Technical analysis traders ko risk management mein madad karta hai. Stop loss aur target levels ko set karne, position sizing aur risk-reward ratio ko samajhne mein madad milti hai. Nuksan: 1. Subjectivity: Technical analysis ki interpretation subjective hoti hai. Different traders ke liye same chart mein alag-alag signals aur patterns dikhte hain. Isliye, sahi signals ko identify karna challenging ho sakta hai. 2. Historical data par depend karna: Technical analysis past price movements aur historical data par depend karta hai. Market conditions aur factors change ho sakte hain, jisse past data future predictions ke liye accurate na ho. 3. False signals: Technical analysis mein false signals aur whipsaws ka risk hota hai. Kabhi kabhi indicators aur patterns galat signals provide kar sakte hain, jisse traders ko nuksan ho sakta hai. 4. Fundamental analysis ka ignore karna: Technical analysis sirf price data par focus karta hai aur fundamental factors ko ignore kar deta hai. Fundamental analysis market ke underlying factors aur company ke financials ko evaluate karta hai, jo important hote hain long-term investment ke liye.Yeh important hai ki traders aur investors ek holistic approach apnayen, jisme technical analysis ke saath fundamental analysis aur risk management ka bhi istemal kiya jaye. Professional advice aur research par depend karke trading decisions lena bhi zaroori hai.Main Avatar -
Fatima12Senior Member
- Feb 2024
- 213
- 43
- 73 USD
InstaSpot: کسی بھی EPS اور بینک سے منافع واپس لیں، اور EPS اور cryptocurrencies کے تبادلے پر 7% تک کمائیں۔
What is technical analysis
Technical Analysis (Technical Tahlil):
1. Ta'aruf (Introduction):
Technical Analysis ek tajziyaati concept hai jo financial markets, jaise ke stocks, currencies, commodities, aur cryptocurrencies mein istemal hota hai. Iska maqsad past price movements aur trading volumes ke analysis ke zariye future price trends ko predict karna hai.
2. Price Action Par Mabni (Price Action Based):
Technical analysis price action par mabni hoti hai, yaani ke ismein market ke past prices aur trading volumes ko examine kiya jata hai. Isse traders ko market behavior, trends, aur potential trading opportunities ka pata chalta hai.
3. Key Components (Ahem Hissay):- Candlestick Patterns: Price movements ko visualise karne ke liye candlestick patterns ka istemal hota hai.
- Chart Patterns: Market trends ko represent karne ke liye chart patterns, jaise ke head and shoulders, triangles, aur rectangles, ka istemal hota hai.
- Indicators: Technical indicators, jaise ke moving averages, relative strength index (RSI), aur stochastic oscillators, market ki strength aur weakness ko measure karte hain.
4. Trend Analysis (Trend Tahlil):- Technical analysis trends ko identify karta hai, jese ke uptrends, downtrends, aur sideways trends. Isse traders ko market direction ka pata chalta hai.
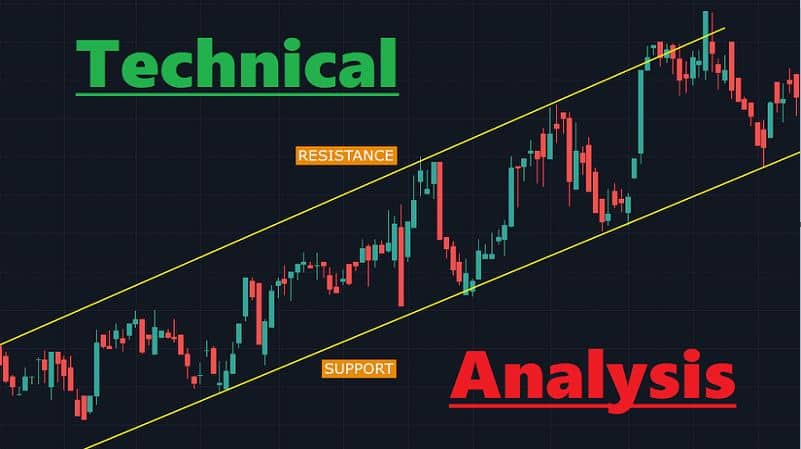
5. Support Aur Resistance Levels (Support Aur Resistance Levels):- Support aur resistance levels technical analysis mein ahem hote hain. Support level par market ko neeche nahi jaane diya jata, jabke resistance level par market ko upar nahi jaane diya jata.
6. Trading Strategies (Tadabeer):- Technical analysis ke zariye traders apne trading strategies ko develop karte hain. Ismein breakout strategies, trend following strategies, aur reversal strategies shamil hote hain.
7. Short-Term Aur Long-Term Analysis (Short-Term Aur Long-Term Tahlil):- Technical analysis short-term aur long-term trends ko analyze karne mein istemal hota hai. Isse traders ko market ki movement ka sahi andaz lagane mein madad milti hai.
8. Limitations (Hadood):- Technical analysis ke istemal mein kuch limitations hain. Market conditions, unexpected events, aur external factors iske effectiveness par asar daal sakte hain.
9. Zakhair (Conclusion):- Technical analysis traders ko market trends samajhne aur future price movements ko predict karne mein madad karta hai. Lekin, isay sahi taur par istemal karne ke liye experience aur market understanding ki zarurat hoti hai.
Note: Ye information sirf ta'arufi maqamat ke liye hai aur actual trading decisions se pehle apne financial advisor se mashwara karna behtar hai. Financial markets mein trading ke saath risk juda hota hai, is liye hamesha ehtiyaat baratna chahiye.
-
Arif5Senior Member
- Jan 2024
- 314
- 29
- 72 USD
What is technical analysis
Technical analysis ek tajziya ka tareeqa hai jo ke maali asbaab mein, jese ke forex trading, mein istemal hota hai taake aane waale qeemat ke hawale se peshgi laga sake. Iske mukhtalif tajziya auzar aur statistics ka istemal hota hai jise historical price data aur trading volume par buni gayi hai. Yeh bunyadi tajziya se mukhtalif hai, jo ke iqtisadi factors aur maali daftaron par mabni hoti hai, jabke takhliqi tajziya chart patterns, takhliqi alaamaat, aur statistics ka istemal karta hai taake trends aur trades ke liye dakhli ya nikali points ka pata lagaya ja sake.
Takhliqi tajziya ke kuch ahem hissay hain:- Price Charts: Technical analysts price charts ka istemal karte hain taake kisi currency pair ya kisi aur maali asbaab ke taqseem hone wale dauran ki historical price movements ko tasweer mein dekh sakein. Aam taur par istemal hone wale charts mein line charts, bar charts, aur candlestick charts shamil hote hain.
- Trends: Trends ko pehchanana takhliqi tajziya ka bunyadi hissa hai. Trends upar (bullish), neeche (bearish), ya saath mein (sideways) ho sakte hain. Takhliqi tajziya yeh manti hai ke trends aksar jaari rehte hain aur inhe pehchan karlyne se trades ke liye faida uthaya ja sakta hai.
- Support aur Resistance Levels: Yeh price levels hote hain jahan kisi currency pair ne aksar upar na jaane (resistance) ya neeche na jaane (support) ka saamna kiya hota hai. Takhliqi tajziya in levels ko istemal karta hai taake dakhli ya nikali points ka pata lagaya ja sake.
- Technical Indicators: Yeh mathematical calculations hote hain jo ke price aur volume data par lagaye jaate hain taake market trends aur momentum ke bare mein mazeed malumat mil sake. Aam taur par istemal hone wale takhliqi indicators mein moving averages, Relative Strength Index (RSI), Moving Average Convergence Divergence (MACD), aur Bollinger Bands shamil hote hain.
- Chart Patterns: Traders aksar price charts par nazar daal kar maqbool patterns ko daryaft karne ki koshish karte hain jo ke trend ki mukhalfat ya is ke jaari rehne ko zahir karte hain. Umeed hai ke in patterns ko pehchaan kar future ki movements ka andaza lagaya ja sakega.
- Volume Analysis: Trading volume yeh bataata hai ke kisi muddat mein kitne shares ya contracts exchange hue hain. Volume mein tabdiliyan traders ko ittefaq ya ikhtilaafat ke signals farahem kar sakti hain, jo ke price movement ki quwwat ko samajhne mein madad karti hain.
Takhliqi tajziya ka bunyadi nazariya yeh hai ke historical price movements aur patterns aksar dohraaye ja sakte hain, aur iss data ko mutala'a karke traders ko future ki qeemat mein hone wale tabdiliyon ka andaza lagaya ja sakta hai. Takhliqi tajziya yeh samajhti hai ke market mein hissa lenewale log aksar aik jaise patterns ko ikhtiyar karte hain, aur in patterns ko istemal karke traders apne faislay ko samajh kar karte hain.
Yeh zaroori hai ke yeh baat yaad rakha jaye ke takhliqi tajziya puri tarah se kaamyabi ka zamin nahi hai, aur alag traders ek hi data ko alag tareeqon se samajh sakte hain. Iske ilawa, bahar se aane wale waqiaat aur khabrein market ko aise tareeqon se asar daal sakti hain jo ke sirf takhliqi tajziya se pehle maloom nahi hoti. Bahut se traders technical aur fundamental tajziya ka mila jul kar istemal karte hain taake forex trading ke tezi se badalte mahaul mein behtareen faislay kar sakein.
-
Arif14Senior Member
- Feb 2024
- 123
- 12
- 26 USD
Technical analysis ko Urdu mein kehte hain. Ye ek tijarat ya stocks mein inaami faide hasil karne ke liye istemal hone wala aik tajziyati approach hai. Technical analysis market ke prices, volumes, aur doosre trading data ko dekhte hue future price movements ko predict karne ki koshish karta hai.Yahan kuch basic terms hain jo technical analysis mein istemal hoti hain:
(Trendlines):
Market ke price movements ko graph par darust taur par darust karnay ke liye istemal hoti hain. Ye traders ko ye samajhne mein madad karti hain ke market upar ya neeche ja rahi hai.
(Support and Resistance):
Ye levels hote hain jahan par market ke price mein major changes hone ki ummid hoti hai. Support level wo hota hai jahan se price gir kar wapis chali jati hai, jabke resistance level wo hota hai jahan se price gir kar upar nahi ja sakti.
(Indicators)
Ye tools hote hain jo trading data ko analyze karne mein madad karte hain. Examples include Moving Averages, Relative Strength Index (RSI), aur Bollinger Bands.
(Candlestick Charts):
Ye ek graphical representation hai jisme har candle ek specific time period ki trading activity ko darust karti hai. Har candle ke upper aur lower ends par lines hoti hain jo high aur low prices ko darust karti hain.
(Volume):
Trading volume bhi ek important factor hai. High trading volume usually indicates strong market interest aur future price movements ko indicate kar sakta hai.Technical analysis ke through traders try karte hain ke future price movements ka andaza lagayein taake wo behter trading decisions le saken. Ye ek art aur science ka mix hai aur traders ki skills aur experience par bhi depend karta hai.
-
sero5Senior Member
- Feb 2024
- 305
- 4
- 20
- 79 USD
InstaSpot: کسی بھی EPS اور بینک سے منافع واپس لیں، اور EPS اور cryptocurrencies کے تبادلے پر 7% تک کمائیں۔
What is technical analysis
Technical Analysis (Tajziyaati Tahlil):
1. Ta'aruf (Introduction):
Technical Analysis ek tajziyaati approach hai jo financial markets, jaise ke stocks, currencies, commodities, aur cryptocurrencies, ke price movements aur trading volumes ka study karta hai. Iska maqsad future price trends ko predict karna hai.
2. Price Action Par Mabni (Price Action Based):
Technical Analysis price action par mabni hoti hai, yaani ke ismein market ke past prices aur volumes ko examine kiya jata hai. Isse traders ko market behavior, trends, aur potential trading opportunities ka pata chalta hai.
3. Key Components (Ahem Hissay):- Candlestick Patterns: Price movements ko visualize karne ke liye candlestick patterns ka istemal hota hai.
- Chart Patterns: Market trends ko represent karne ke liye chart patterns, jaise ke head and shoulders, triangles, aur rectangles, ka istemal hota hai.
- Indicators: Technical indicators, jaise ke moving averages, relative strength index (RSI), aur stochastic oscillators, market ki strength aur weakness ko measure karte hain.
4. Trend Analysis (Trend Tahlil):- Technical Analysis trends ko identify karta hai, jese ke uptrends, downtrends, aur sideways trends. Isse traders ko market direction ka pata chalta hai.
5. Support Aur Resistance Levels (Support Aur Resistance Rekhaayein):- Support aur resistance levels technical analysis mein ahem hote hain. Support level par market ko neeche nahi jaane diya jata, jabke resistance level par market ko upar nahi jaane diya jata.
6. Trading Strategies (Tadabeer):- Technical Analysis ke zariye traders apne trading strategies ko develop karte hain. Ismein breakout strategies, trend following strategies, aur reversal strategies shamil hote hain.
7. Short-Term Aur Long-Term Analysis (Short-Term Aur Long-Term Tahlil):- Technical Analysis short-term aur long-term trends ko analyze karne mein istemal hota hai. Isse traders ko market ki movement ka sahi andaz lagane mein madad milti hai.
8. Limitations (Hadood):- Technical Analysis ke istemal mein kuch limitations hain. Market conditions, unexpected events, aur external factors iske effectiveness par asar daal sakte hain.
9. Zakhair (Conclusion):- Technical Analysis traders ko market trends samajhne aur future price movements ko predict karne mein madad karta hai. Lekin, isay sahi taur par istemal karne ke liye experience aur market understanding ki zarurat hoti hai.
Note: Ye information sirf ta'arufi maqamat ke liye hai aur actual trading decisions se pehle apne financial advisor se mashwara karna behtar hai. Financial markets mein trading ke saath risk juda hota hai, is liye hamesha ehtiyaat baratna chahiye.
-
12ImanSenior Member
- Oct 2022
- 924
- 354
- 771
- 1 220 USD
Technical Analysis
- Muqadma: Technical Analysis ek tijarat ki tajaweez hai jo market trends ko samajhne aur future price movements ko predict karne mein madad deti hai. Yeh primarily historical price aur volume data ka istemal karti hai.
- Asal Maqsad:
- Technical analysis ka asal maqsad market trends, price patterns, aur trading volumes se malumat nikal kar future ke price movements ko forecast karna hai.
- Key Concepts:
- Price Charts: Technical analysis price charts ka istemal karti hai jismein historical prices ko graphical form mein darust kiya jata hai.
- Indicators aur Oscillators: Technical analysts technical indicators aur oscillators ka istemal karte hain jese ke moving averages, RSI, aur MACD.
- Technical Analysis Ki Buniyad:
- Support aur Resistance: Isme support aur resistance levels ki tafseelat par tawajjuh hoti hai, jo ke price movements mein ahem hoti hain.
- Trends Ka Analysis: Traders ko trends ko samajhne aur identify karne ke liye price charts ka istemal karna padta hai.
- Candlestick Patterns:
- Candlestick charts: Technical analysis mein candlestick patterns ka bhi ahem hissa hai, jismein har candlestick ek muddat (timeframe) ki trading activity ko darust karta hai.
- Trading Strategies:
- Moving Averages: Moving averages ka istemal karte huye trends ko confirm karna aur entry/exit points tay karna.
- Breakout aur Trend Lines: Support aur resistance levels, breakout points aur trend lines ke istemal se trading strategies tay ki jati hain.
- Technical Analysis aur Forex:
- Forex Market Mein Istemal: Technical analysis forex market mein ahem role ada karta hai aur traders isay currency pairs ke analysis mein istemal karte hain.
- Short-Term aur Long-Term Analysis: Technical analysis short-term aur long-term trading strategies ko support karta hai.
- Challenges aur Hudood:
- False Signals: Kabhi-kabhi technical analysis false signals bhi de sakti hai.
- Market Conditions: Market conditions aur sudden events ka asar bhi technical analysis par hota hai.
- Conclusion:
- Technical analysis ek tajaweezi tool hai jo traders ko market trends ko samajhne aur future movements ko anticipate karne mein madad karta hai.
- Lekin, hamesha yaad rahe ke koi bhi tijarat mein risk hota hai, isliye hoshiyari aur tajaweez ke sath kaam karna zaroori hai.
-
Raheela5Senior Member
- Dec 2021
- 487
- 466
- 283
- 822 USD
Technical Analysis
1. Mud Introduction:- Technical analysis ek tajaweezi tool hai jo financial markets mein istemal hota hai, taki traders aur investors market trends aur price movements ko samajh sakein.
2. Technical Analysis Ki Bunyad:- Technical analysis ka bunyadi concept ye hai ke market mein historical price aur volume data ko istemal karke future price movements ko predict kiya ja sakta hai.
- Iski mool bunyad hai ke market mein historical patterns aur trends dohraye jate hain.
3. Technical Analysis Ke Tareeqay:- Technical analysis ke kuch ahem tareeqay hain:
- Candlestick Patterns: Candlestick charts ka istemal karke traders price movements ko samajhte hain.
- Chart Patterns: Mukhtalif chart patterns jese ke head and shoulders, triangles, aur flags ka istemal hota hai.
- Technical Indicators: Moving averages, RSI (Relative Strength Index), aur MACD (Moving Average Convergence Divergence) jese indicators ka istemal market strength aur momentum ko measure karne mein hota hai.
- Support aur Resistance Levels: Traders ye dekhte hain ke kis level par price mein changes aa sakti hain.
4. Technical Analysis Ka Istemal:- Traders aur investors technical analysis ka istemal karte hain apne trading decisions ko guide karne ke liye.
- Technical analysis ki madad se wo market trends aur potential reversals ko identify karte hain.
5. Limitations of Technical Analysis:- Technical analysis ke bawajood, market unpredictable hota hai aur kabhi-kabhi historical patterns future movements ko accurately predict nahi kar pate.
- Choppy markets mein, jahan price mein zyada fluctuations hain, technical analysis ka istemal mushkil ho sakta hai.
6. Conclusion:- Technical analysis ek ahem tool hai jo market participants ko market trends aur potential price movements ke bare mein samajhne mein madad karta hai. Lekin, iska istemal sahi taur par karna zaroori hai aur traders ko hamesha market conditions aur doosre factors ko mad-e-nazar rakhte hue apne trading decisions ko confirm karna chahiye.
-
NaheedAliSenior Member
- Feb 2024
- 202
- 87
- 57
- 65 USD
InstaSpot: کسی بھی EPS اور بینک سے منافع واپس لیں، اور EPS اور cryptocurrencies کے تبادلے پر 7% تک کمائیں۔
What is technical analysis
Technical Analysis (Technical Tahlil)
Technical analysis ek method hai jisse istemal kiya jata hai market trends aur price patterns ko analyze karne ke liye, taki future mein stocks, currencies, commodities ya anya financial instruments ki keemat ka andaza lagaya ja sake. Yeh analysis traders aur investors ke liye aik important tool hai jo unhe market movements ka better understanding aur future ke predictions mein madad karta hai.
Technical Analysis Ka Maqsad (Objective of Technical Analysis)
Technical analysis ka maqsad market ke past data ko study karke uske patterns, trends, aur price movements ko samajhna hai, taake traders aur investors future ki possibilities ko predict kar sakein. Iska focus hota hai keemaat ke historical data par, jaise keemaat ke fluctuations, trading volumes, aur market sentiment.
Tools aur Techniques (Tools and Techniques)- Candlestick Patterns: Candlestick patterns ko istemal karke traders market ke behavior ko analyze karte hain. Yeh patterns bullish ya bearish signals provide karte hain, jo keemaat ki trajectory ko samajhne mein madad karte hain.
- Moving Averages: Moving averages ek common technical analysis tool hain jo keemaat ke trends ko samajhne mein madad karte hain. Inka istemal hota hai keemaat ke average price ko over a specific period of time ko determine karne ke liye.
- Support aur Resistance Levels: Technical analysis mein support aur resistance levels ko identify karne ka bada maqam hai. Support levels wo points hote hain jahan se price downward movement mein ruk kar upar ki taraf move kar sakti hai, jabke resistance levels wo points hote hain jahan se price upward movement mein ruk kar neeche ki taraf move kar sakti hai.
- Relative Strength Index (RSI): RSI ek momentum oscillator hai jo keemaat ki overbought ya oversold conditions ko measure karta hai. Yeh traders ko samajhne mein madad karta hai ke kisi financial instrument ki keemat zyada tezi se barh rahi hai ya gir rahi hai.
Advantages aur Disadvantages (Fawaid aur Nuqsanat)
Fawaid:- Technical analysis traders aur investors ko market trends aur price movements ka better understanding deta hai.
- Yeh short-term trading aur intraday trading ke liye mufeed hota hai, kyun ke ismein immediate price movements ko analyze kiya ja sakta hai.
Nuqsanat:- Technical analysis sirf past performance aur keemat ke patterns par mabni hota hai, is liye future ki exact predictions nahi kar sakta.
- Kabhi kabhi yeh tools aur techniques contradictory signals bhi provide kar sakte hain, jo traders ko confuse kar sakte hain.
Conclusion (Ikhtitami Guftagu)
Technical analysis ek powerful tool hai jo traders aur investors ko market ke behavior ko samajhne mein madad karta hai. Lekin, yeh sirf ek piece of puzzle hai aur complete picture ke liye fundamental analysis aur other factors ke sath combine kiya jana chahiye. Is tarah, traders apne investment decisions ko better inform kar sakte hain aur risk ko minimize kar sakte hain.
-
Tari3435Senior Member
- Feb 2024
- 125
- 29
- 119
- 68 USD
What is technical analysis?
Technical analysis is a method of evaluating and predicting price movements in financial markets by analyzing historical price data, trading volume, and other related market statistics. Traders and analysts use technical analysis to make informed decisions about buying or selling financial instruments such as stocks, currencies, commodities, and indices. The core principle of technical analysis is that historical price movements tend to repeat, and certain patterns or trends can be identified to anticipate future price movements.
Key Components of Technical Analysis:- Price Charts:
- Price charts are fundamental to technical analysis. Traders use various types of charts, such as line charts, bar charts, and candlestick charts, to visualize historical price data.
- Technical Indicators:
- Technical indicators are mathematical calculations based on price and volume data. Common indicators include moving averages, relative strength index (RSI), moving average convergence divergence (MACD), and stochastic oscillators.
- Chart Patterns:
- Chart patterns are formations on price charts that indicate potential trend reversals or continuations. Examples include head and shoulders, double tops and bottoms, triangles, and flags.
- Trend Lines:
- Trend lines are lines drawn on charts to connect the highs or lows of an asset's price movements. They help identify the prevailing trend and potential trend reversals.
- Support and Resistance Levels:
- Support and resistance levels are key price levels where the price has historically had difficulty moving above (resistance) or below (support). These levels help traders identify potential turning points in the market.
Principles of Technical Analysis:- History Tends to Repeat:
- Technical analysts believe that historical price movements and patterns are likely to repeat in the future. They use past data to identify trends and make predictions.
- Market Discounts Everything:
- Technical analysis assumes that all relevant information, including market news, economic reports, and investor sentiment, is already reflected in the asset's price.
- Price Moves in Trends:
- One of the fundamental concepts of technical analysis is that prices move in trends. Analysts identify trends as uptrends, downtrends, or sideways (range-bound) trends.
- Volume Confirms Price:
- Technical analysts often use trading volume as a confirming indicator. An increase in volume during a price movement is considered a sign of strength, while low volume might indicate a lack of conviction.
- Trends Continue Until a Reversal is Evident:
- The trend-following principle suggests that a prevailing trend is likely to continue until there is evidence of a reversal. Traders aim to ride trends for profitable trades.
Application of Technical Analysis:- Identifying Entry and Exit Points:
- Traders use technical analysis to determine optimal entry and exit points for their trades based on chart patterns, indicators, and other technical signals.
- Risk Management:
- Technical analysis aids in setting stop-loss orders and determining risk-reward ratios, helping traders manage their risk effectively.
- Timeframe Consideration:
- Traders may use different timeframes for technical analysis, such as short-term charts for day trading or longer-term charts for trend analysis and position trading.
- Confirmation with Fundamental Analysis:
- Some traders use technical analysis in conjunction with fundamental analysis to gain a comprehensive view of the market.
Conclusion: Technical analysis is a valuable tool for traders and investors seeking to understand market trends, identify potential trading opportunities, and make informed decisions based on historical price data. While it has its strengths, it is important to note that technical analysis should be used in conjunction with other forms of analysis, and risk management principles should always be applied
-
<a href="https://www.instaforex.org/ru/?x=ruforum">InstaForex</a> -
Nk12Senior Member
- Feb 2024
- 133
- 32
- 20
- 43 USD
What is technical analysis
Technical analysis ek aisa ilmi nazriya hai jo market trends aur securities ke behavior ko samajhne ke liye istemal hota hai. Iska maqsad market ke future movements ko predict karna hota hai taki investors apne trading aur investment decisions ko behtar taur par le saken.
Tehqiqati Nazriya:
Technical analysis mein, traders aur investors market data ko study karte hain, jise price charts, volume, aur historical data mein record kiya jata hai. Ismein past market behavior ko analyze kiya jata hai taki future ke price movements ko forecast kiya ja sake.
Key Concepts of Technical Analysis:- Price Discounts Everything (Keemat Har Cheez Ko Shamil Karti Hai): Technical analysts maante hain ke market mein mojood tamam maqooliyat aur news pehle se hi prices mein shamil hoti hain. Is liye, current market prices se hi future ke movements ko predict kiya ja sakta hai.
- Price Moves in Trends (Keemat Trend Mein Chalti Hai): Technical analysis ka ek mool siddhant hai ke market prices ek trend mein chalti hain. Yani ke uptrend (tezi), downtrend (girawat), ya sideway trend (consolidation).
- History Tends to Repeat Itself (Tareekh Khud Ko Dohratay Hai): Technical analysts maante hain ke market mein mojood patterns, trend lines, aur indicators ka dohrana mumkin hai, aur isko study kar ke future ke movements ka andaza lagaya ja sakta hai.
Tools and Techniques of Technical Analysis:- Candlestick Charts: Yeh charts prices ko visually darust dikhane ke liye istemal hote hain. Har candlestick ek specific time period ko represent karta hai aur usmein include hote hain opening, closing, high aur low prices.
- Moving Averages: Yeh ek indicator hai jo market ki average price ko specific time frame ke liye calculate karta hai. Isse traders trend ka pata lagane mein madad lete hain.
- Support aur Resistance Levels: Traders support aur resistance levels ko identify kar ke ye samajhne ki koshish karte hain ke kis point par asset ki price mein badalav hone ke chances hain.
- Relative Strength Index (RSI): Yeh ek momentum indicator hai jo asset ke overbought ya oversold hone ki pehchan karta hai. Isse traders market ke reversals ko samajhne mein madad lete hain.
Limitations of Technical Analysis:- Past Performance Guarantee Nahi Karti: Technical analysis ke siddhanto ke mutabiq, past market performance future ko predict karne mein madad karti hai, lekin iska koi guarantee nahi hota.
- Market Influences: Technical analysis market mein mojood external factors aur sudden events ko shamil nahi karti. Is liye, unexpected events ka asar analysis par hota hai.
In summary, technical analysis ek important tool hai jo investors aur traders ko market behavior samajhne mein madad karta hai. Lekin, iska istemal keval ek part of overall investment strategy ke roop mein kiya jana chahiye aur doosre factors ko bhi mad-e-nazar rakha jana chahiye.
اب آن لائن
Working...
تبصرہ
Расширенный режим Обычный режим