Bullish Meeting line Pattern
-
Hamza770Senior Member

- Oct 2019
- 6338
- 1439
- 7630
- 1 409 USD
-
<a href="https://www.instaforex.org/ru/?x=ruforum">InstaForex</a> -
Hamza770Senior Member
- Oct 2019
- 6338
- 1439
- 7630
- 1 409 USD
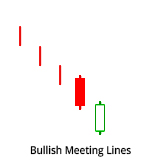
Bullish Meeting Line pattern ek bullish candlestick pattern hai jo price chart par price movement ko represent karta hai. Yeh pattern do candlesticks se bana hota hai.Bullish Meeting Line pattern ka formation kuch steps mein hota hai: 1. Pehli candlestick: Pehli candlestick bearish (downward) movement indicate karti hai, yaani price down ja rahi hoti hai. Is candlestick ki body red (bearish) color ki hoti hai. 2. Dusri candlestick : Dusri candlestick pehli candlestick ki body ke andar open aur close hoti hai. Yeh candlestick bullish (upward) movement indicate karti hai, yaani price up ja rahi hoti hai. Is candlestick ki body green (bullish) color ki hoti hai.Bullish Meeting Line pattern mein dusri candlestick pehli candlestick ki body ke andar open aur close hoti hai, indicating a potential bullish reversal. Is pattern mein pehli candlestick ki bearish momentum ko dusri candlestick ki bullish momentum follow karti hai, suggesting a shift in market sentiment from bearish to bullish.Pattern ki strength aur reliability ko confirm karne ke liye traders dusre technical analysis tools aur indicators ka istemal karte hain. For example, traders trend lines, support/resistance levels, moving averages, aur volume analysis ka istemal kar sakte hain.Bullish Meeting Line pattern bullish reversal signal deta hai, indicating a potential buying opportunity. Lekin, jaise ki har pattern ki tarah, is pattern par rely karne se pehle traders ko aur bhi factors ko consider karna chahiye, jaise ki overall market trend, price action, aur confirmation indicators. Risk management techniques ka istemal bhi zaruri hai to protect against potential losses.Traders ko regular practice, experience, aur continuous learning ke saath hi in candlestick patterns ke interpretation aur utilization mein improve hona chahiye.
-
Afzal1149Member
- Apr 2023
- 57
- 2
- 5
InstaSpot: کسی بھی EPS اور بینک سے منافع واپس لیں، اور EPS اور cryptocurrencies کے تبادلے پر 7% تک کمائیں۔
Bullish Meeting Line Pattern: Blash meeting line pettern aik du mome betty reursal pettern he joe maliati markets ، jaise stock ، farex ، ya kripto currenciyo main mumkanah tezi kee wapsi kee nishandahi karsakta he yah namona zawal ke rojhan ke baad hotaa he aur s se patah chalta he kah reecha (bechne walle) controlling kho rahe henni aur bell (kharidar) raftar hasel karna sharooh kor sakte hain. blash meeting line pettern kas tarh tashkil dia jata he: 1. Pahla candle stick: pahli candle stick aik lambi sarkh (ya mendy) mome betty he ، joe markets main aik mazboot mendy ke jazbat kee nishandahi karti he yah mome betty frocht ke aham dabao ke don kee numaindagi karti he 2. Dusra candle stick: dusri candlestick aik lambi sabze (ya tez raftar) mome betty he joe pichhle don kee sarkh mome betty ke nichlay hasay main ya s ke qareeb khulti he aur numayan toor par unchi satah par band hoti he misali toor par pichhle don kee mome betty kee bulandi ke qareeban s se zahir hotaa he kah kharidaron né mazbuti se qadam uthaya he aur qimat ko badhane main kamiyab rahe hain ، jas se pichhle don ke naqsanat ka aik bada hisah mita dia gaya he Tezi meeting line pettern ke aham anasar yah hain:- Dusri candle stick niche khulti he lekin pahley candle stick ke muqable main unchi band hoti h
- Dusri mome betty main coffee jasm hona chahiy
- Donon candlesticl taqriba aik hay size kee honi chahiyen ، joe markets ke jazbat main mumkanah tabdeeli kee nishandahi karti henni
-
@HassanshahJunior Member
- Aug 2023
- 15
- 1
Bullish meeting line pattern introduction Bullish Meeting Line pattern ek technical analysis term hai jo stock market mein use hoti hai. Ye pattern typically ek uptrend ya bearish trend ke baad aata hai, aur ye ek reversal pattern hota hai, yaani ki price direction mein badalav aane ki possibility hoti hai. Bullish Meeting Line pattern mein do consecutive candlesticks hote hain. Pehla candlestick ek downtrend ke dauraan aata hai, jiska closing price low hota hai. Dusra candlestick bhi downtrend mein aata hai, lekin iska opening price pehle candlestick ke closing price ke paas hota hai aur uska closing price pehle candlestick ke opening price ke paas hota hai. Yani ki, dono candlesticks ke beech mein ek "meeting line" banti hai. Bullish meeting line pattern formation Bullish Meeting Line pattern ek technical analysis term hai jo stock market mein use hoti hai. Ye pattern typically ek uptrend ya bearish trend ke baad aata hai, aur ye ek reversal pattern hota hai, yaani ki price direction mein badalav aane ki possibility hoti hai. Bullish Meeting Line pattern mein do consecutive candlesticks hote hain. Pehla candlestick ek downtrend ke dauraan aata hai, jiska closing price low hota hai. Dusra candlestick bhi downtrend mein aata hai, lekin iska opening price pehle candlestick ke closing price ke paas hota hai aur uska closing price pehle candlestick ke opening price ke paas hota hai. Yani ki, dono candlesticks ke beech mein ek "meeting line" banti hai. Is pattern ko dekhte hue traders ko ye signal milta hai ki downtrend weak ho sakta hai aur possible hai ki uptrend shuru ho. Lekin, is pattern ko confirm karne ke liye aur dusre technical indicators ka bhi istemal kiy Bullish Meeting Line pattern ko samajhne ke liye, aapko candlestick charts ka istemal karna hoga. Yeh pattern do consecutive candlesticks se banta hai. Main aapko step-by-step bata raha hoon, kis tarah se Bullish Meeting Line pattern ban sakta hai: Pehla Candlestick: Downtrend ke dauraan, pehla candlestick aata hai, jiska closing price low hota hai. Dusra Candlestick: Dusra candlestick bhi downtrend mein hota hai, lekin iska opening price pehle candlestick ke closing price ke paas hota hai. Iska closing price pehle candlestick ke opening price ke paas hota hai, ya usse thoda sa upar. Meeting Line: Dono candlesticks ke beech mein ek "meeting line" ban jata hai. Yani ki, dono candlesticks ke closing price aur opening price lagbhag ek jaisa hota hai. How to trade Bullish meeting line pattern Trading the Bullish Meeting Line pattern in the forex market involves identifying and capitalizing on a potential reversal in a downtrend. This pattern consists of two candlesticks: The first candlestick is bearish (red or filled), indicating a downtrend. The second candlestick is bullish (green or hollow) and opens lower than the previous day's close but closes higher, ideally engulfing the previous day's bearish candlestick. Here's a step-by-step guide on how to trade the Bullish Meeting Line pattern: Identify the Pattern: Start by looking for a clear downtrend in the forex pair you're interested in. This pattern is most reliable when it appears after a sustained downtrend. Wait for Confirmation: The key to this pattern is the bullish candlestick engulfing the previous bearish one. Ensure that the second candlestick fully engulfs the first one. Entry Point: You can enter a long (buy) position when the second candlestick closes and the bullish reversal seems confirmed. Some traders prefer to enter at the opening of the next candle to further confirm the bullish sentiment. Set a Stop-Loss: To manage risk, set a stop-loss order just below the low of the second candlestick. This level should represent a price point where the bullish scenario may be invalidated. Take Profit: Determine your take-profit level, which could be a recent resistance level or a Fibonacci retracement level. This is where you plan to exit the trade and take your profit. Risk Management: Ensure your position size is appropriate for your risk tolerance. Never risk more than you can afford to lose in a single trade. Monitor the Trade: Keep an eye on the trade and adjust your stop-loss and take-profit levels as the trade progresses. Consider using trailing stops to lock in profits if the market moves in your favor. Exit the Trade: When the price reaches your predetermined take-profit level or if you see signs of a trend reversal, exit the trade to secure your profits. -
LuqmanHakeemSenior Member
- Aug 2023
- 163
- 1
"Bullish Meeting Line Pattern"Bullish Meeting Line Pattern ek technical analysis pattern hai jo stock market mein istemal hota hai. Is pattern mein do consecutive candlesticks hote hain. Pehla candlestick bearish hota hai, matlab ke price down jata hai, aur dusra candlestick bullish hota hai, matlab ke price up jata hai. Dono candlesticks ki bodies approximately same size hoti hain. Yeh pattern market mein trend reversal ko suggest karta hai aur traders ko ye signal deta hai ke bearish trend se bullish trend mein shift ho sakta hai. -
Sumi2193Senior Member
- Mar 2024
- 570
- 26
- 21
- 120 USD
InstaSpot: کسی بھی EPS اور بینک سے منافع واپس لیں، اور EPS اور cryptocurrencies کے تبادلے پر 7% تک کمائیں۔
Bullish meeting line Candle pattern
Bullish meeting line candle pattern aik aisa candle plan hei, jis me keematen negative example k terrible design meni chnage house ki koshash karti hei. So aik kisam ka reversal pattern hei, jo market pehle se maojood negative example ko bullish Bullish Meeting Line pattern Candlestick mi kwata hei I turn. On the contrari, social events are strong for nahi hei, waja se design ki attestation k leie peranta ko bazaar me igli progress and intezaar karna hota hei. Public relations Line Light Plan bhi intersecting Line Seuneu Plan hiBullish Convergence Line Candlestick pattern ki tarah hei lekin me aik mamoli divergence hei, converging line plan me white wise candles closing point aik hona chaheie, jab k intersecting line fire me second white candle dim candle closing position se high is full bodi k andar band hoti hi This public relations line (two) sham ka istamal hota hei, jis me pehle aik dim bari real wali wali fire hoti hei, jisbko ak sham karti hei. White fire lamp, open bani kik k k close candle dot k k close dot k clear line same k me hogi ie wise (white and white) candlesticks close meeting center line sai hi trading boss gii.
Bullish Meet Line Candlestick Pattern banne se pehle market is a negative example for me hona zarori heiPehle aik, iou're realli boring wali fire honi chaheie (size nahi karta but iou kuch na kuch zaror honi chaheie)Bullish Meet Line Candlestick Patternsecond white fire guaranteed iellow honei bodi wallsecond light ki open position fire light k close position open me hona zarori hei, tab hei general trading model sa profit kazan ho jai gii sai.
Description
Bullish Meeting Line Candlestick Pattern The first candle is the closing point of the second candle hi. Two dais standard candle mushtamil hota hei, jiss mein pehli candle aik long guaranteed bodi wali negative fire hoti hei, jo keematon ko slide karti hei iou plan. Light a real fire, a hoti hei candle, or open a lamp fire.
Trade
The breakout line is a candlestick pattern but it is close to the light of the standard hoti hei closing point. Anni pehli orr dosri is the price of closing the candle, the same as the usual chicken. Bullish win-line plan line to the opposite side or the mein cost of negative standard social event banta plan hei, no example of negative plan reversal hei.Bullish Meeting Line Candlestick pattern aik rough example of reversal plan hei, waja se ie senders k leie ki ki generate signal. the second white light model collectin to confirm the design k leie zarori hei k third fire ka intezar kia jaie...Bullish Meeting Line Candlestick Pattern But the third flame is boring bandi hei, apne pechle design k tasalsul ko zahir karti hei. Stop the challenge. The life plan of the mass of buiers ki small market galur mein ki waja se banti hei, jiss mein market sellers mein ki dabao ka hatma karke costs k base ko bulish example needed badal deti hei. Bullish plan for social events trade standard se pehle aik attestation lamp boring ka hona zarori hei, jok dosri lamp k baad real bodi kei honi chaheie, jiss standard buier market leader ki Entri kar sakte bui chicken
-
WinterSenior Member
- Dec 2023
- 465
- 236
- 185
- 213 USD
Bullish Meeting Line pattern ek bullish reversal candlestick pattern hai jo technical analysis mein istimal hota hai, khas taur par forex trading aur stock market mein. Yeh pattern do candles par mushtamil hota hai aur market ke downtrend ke baad bullish reversal ka signal deta hai.
Bullish Meeting Line Pattern
Bullish Meeting Line pattern ek reversal pattern hai jo downtrend ke doran form hota hai aur ek bullish reversal ko indicate karta hai. Is pattern mein pehli candle bearish hoti hai aur doosri candle bullish hoti hai. Doosri bullish candle ke close hone par, price level pehli bearish candle ke close ke barabar ya uske bohot qareeb hoti hai. Yeh pattern market ke bearish sentiment se bullish sentiment mein change hone ka signal deta hai.
Meeting Line Pattern Ki Structure
Bullish Meeting Line pattern ki structure kuch is tarah hoti hai:- Pehli Bearish Candle: Pehli candle ek lambi bearish candle hoti hai jo downtrend ko continue karti hai. Yeh candle market ke bearish sentiment ko dikhati hai aur sellers ka zyada honay ka indication deti hai.
- Doosri Bullish Candle: Iske baad, ek lambi bullish candle form hoti hai. Yeh bullish candle pehli bearish candle ke low se shuru hoti hai aur pehli bearish candle ke close ke barabar ya uske qareeb close hoti hai. Yeh bullish candle buyers ke pressure mein barhne ka indication deti hai aur ek potential reversal ka signal hoti hai.
Bullish Meeting Line pattern ko identify karna aur uski sahi interpretation karna forex traders ke liye bohot zaroori hai, kyunki yeh pattern ek potential bullish reversal ka strong signal deti hai. Is pattern ki interpretation kuch is tarah se hoti hai:- Downtrend Reversal: Pehli bearish candle market ke bearish sentiment aur downtrend continuation ko dikhati hai. Lekin, doosri bullish candle buyers ke aggressive buying pressure ko dikhati hai. Jab doosri bullish candle pehli bearish candle ke close ke barabar ya qareeb close hoti hai, to yeh signal hota hai ke market ke sellers ke control mein kamzori aayi hai aur buyers ka control barh raha hai. Yeh ek bullish reversal ka signal ho sakta hai.
- Psychological Level: Bullish Meeting Line pattern ka main aspect yeh hai ke doosri bullish candle pehli bearish candle ke close ke qareeb close hoti hai. Yeh ek psychological level hota hai jo market participants ke liye important hota hai. Jab price is level tak wapas aati hai, to yeh dikhata hai ke buyers ne market mein significant buying pressure create kiya hai, jo future mein bullish sentiment ko support kar sakta hai.
- Confirmation of Reversal: Doosri bullish candle ke close hone par, Bullish Meeting Line pattern ka completion hota hai. Yeh pattern downtrend ke baad ek bullish reversal ka confirmation deti hai. Lekin, is confirmation ko aur bhi strengthen karne ke liye additional technical indicators ya chart patterns ka istimal karna chahiye.
Bullish Meeting Line pattern ko different trading strategies mein use kiya ja sakta hai. Yeh pattern market ke bullish reversal ka signal deti hai, isliye traders aksar isko long positions enter karne ke liye use karte hain. Kuch common strategies jisme Bullish Meeting Line pattern use hota hai, unmein trend reversal aur breakout trading strategies shamil hain.- Reversal Trading Strategy: Is strategy mein, traders Bullish Meeting Line pattern ke form hone par long positions enter karte hain. Jab pattern complete ho jata hai aur bullish reversal ka signal milta hai, to traders buy orders place karte hain. Yeh strategy tab use hoti hai jab traders anticipate karte hain ke downtrend khatam ho gaya hai aur market ab upar jaayegi.
- Breakout Trading Strategy: Kabhi kabhi Bullish Meeting Line pattern mein doosri bullish candle ek significant resistance level ke qareeb close hoti hai. Is case mein, traders breakout strategy use kar sakte hain. Jab price resistance level ko break karti hai, to yeh additional bullish confirmation hota hai. Traders is breakout point par buy orders place karte hain aur market ke further upar jaane ka wait karte hain.
Risk Management
Bullish Meeting Line pattern ko trade karte waqt risk management ko madde nazar rakhna bohot zaroori hai. Yeh pattern bullish reversal ka signal deta hai, lekin market unpredictable ho sakti hai. Kuch important risk management techniques ko follow karna chahiye:- Stop-Loss Placement: Stop-loss orders ko use karna trading losses ko limit karne ka ek effective tariqa hai. Stop-loss ko usually Bullish Meeting Line pattern ke low ke neeche place kiya jata hai. Yeh aapko unexpected price movements se protect karta hai aur losses ko minimize karta hai.
- Confirmation Indicators: Bullish Meeting Line pattern ko kabhi bhi akela use nahi karna chahiye. Hamesha doosre confirmation indicators, jaise ke moving averages, RSI , aur MACD , ka istemal karna chahiye. Yeh additional indicators pattern ke signals ko confirm karte hain aur false signals se bachne mein madadgar hote hain.
- Proper Analysis: Market conditions, fundamental news, aur economic events ko madde nazar rakhte hue trading decisions lena chahiye. Yeh factors market sentiment ko bohot jaldi change kar sakte hain aur unexpected price movements ho sakti hain. Isliye proper market analysis aur research karna bohot zaroori hai.
Bullish Meeting Line pattern ek bullish reversal candlestick pattern hai jo forex trading mein downtrend ke baad market ke bullish sentiment mein change hone ka signal deta hai. Yeh pattern do candles par mushtamil hota hai jismein pehli candle bearish hoti hai aur doosri candle bullish hoti hai. Is pattern ko identify karna aur use karna traders ke liye profitable trading opportunities ko recognize karne mein madadgar ho sakta hai. Lekin, hamesha yaad rakhein ke market unpredictable hoti hai, isliye proper risk management aur market analysis ko madde nazar rakhte hue trading decisions lena chahiye taake aap apne capital ko protect kar sakein aur long-term success hasil kar sakein. -
shannySenior Member
- Jul 2024
- 2275
- 14
- 51
- 350 USD
**Bullish Meeting Line Pattern: Ek Tafseeli Jaiza**
Forex trading aur stock market analysis mein patterns ka buhat bara kirdar hota hai. In patterns ko samajhna aur inka sahi istemal karna trader ki success mein madadgar sabit ho sakta hai. Aaj hum Bullish Meeting Line Pattern ke bare mein jaanenge, jo ke reversal patterns mein shamil hota hai.
### Bullish Meeting Line Pattern Kya Hai?
Bullish Meeting Line Pattern ek candlestick pattern hai jo do candles par mushtamil hota hai. Ye pattern tab banta hai jab downtrend ke dauran ek bearish candle ke baad ek bullish candle banay, aur bullish candle ki closing price bilkul ya lagbhag bearish candle ki opening price ke barabar ho. Is pattern ka matlab hai ke market mein buyers ki wapsi ho rahi hai aur market trend reverse hone ke chances hain.
### Pattern Ka Tashkeel
1. **Pehli Candle (Bearish Candle):** Pehli candle ek lambi bearish candle hoti hai jo downtrend ko reflect karti hai. Iska matlab hai ke market mein selling pressure zyada tha.
2. **Dusri Candle (Bullish Candle):** Dusri candle ek bullish candle hoti hai jo pehli candle ki closing ke baad shuru hoti hai aur lagbhag uski opening price par khatam hoti hai. Is candle ka banna ye suggest karta hai ke buying pressure increase ho raha hai.
### Is Pattern Ka Maqsad
Bullish Meeting Line Pattern ek reversal pattern hai, jiska maqsad ye hai ke downtrend ke baad market mein trend reversal hone ke chances hain. Is pattern ko samajhna traders ko ye signal deta hai ke ab market mein buying ka moqa hai.
### Pattern Ki Ahmiyat
Is pattern ki ahmiyat tab hoti hai jab market kisi strong downtrend mein hota hai aur phir Bullish Meeting Line Pattern ka zahoor hota hai. Is pattern ki madad se trader ko ye andaza hota hai ke ab market ke trend mein tabdeeli aa sakti hai aur price barh sakti hai.
### Trading Strategy
1. **Confirmation:** Is pattern ko dekhne ke baad confirmation ke liye doosre indicators aur tools ka istemal karna zaroori hai, jaise ke RSI ya MACD. Isse aapko surety milti hai ke trend sach mein reverse ho raha hai.
2. **Stop Loss:** Is pattern par trade karte waqt stop loss ka istemal zaroori hai, jo ke previous low ya pehli candle ke low par lagaya ja sakta hai.
3. **Target:** Target setting bhi important hai. Aam tor par resistance levels ko target banaya jata hai.
### Conclusion
Bullish Meeting Line Pattern ek ahem reversal pattern hai jo market ke downtrend ke baad buying opportunity ke signal deta hai. Is pattern ko samajhna aur iske according trading decision lena traders ko faida pohncha sakta hai. Har trader ko chahiye ke wo is pattern ke ilawa doosre indicators ko bhi madad mein le, taake better decision-making ho sake aur risk management behtar ho. -
<a href="https://www.instaforex.org/ru/?x=ruforum">InstaForex</a> -
HealthSenior Member
- Mar 2024
- 1987
- 70
- 72
- 597 USD
InstaSpot: کسی بھی EPS اور بینک سے منافع واپس لیں، اور EPS اور cryptocurrencies کے تبادلے پر 7% تک کمائیں۔
**Bullish Meeting Line Pattern Kya Hai?**
Bullish Meeting Line pattern forex aur stock trading mein ek powerful candlestick formation hai jo potential bullish reversals ko indicate karta hai. Yeh pattern price action analysis mein use hota hai aur market ke trend changes ko accurately identify karne mein madad karta hai. Is post mein hum Bullish Meeting Line pattern ki pehchaan, formation aur trading strategy ko detail mein discuss karenge.
**Bullish Meeting Line Pattern Ki Pehchaan:**
Bullish Meeting Line pattern do consecutive candlesticks se mil kar banta hai. Is pattern ka formation market ke bearish trend ke baad hota hai aur yeh bullish reversal ka signal deta hai. Iski khasiyat yeh hoti hai:
1. **Pehli Candle:** Pehli candle ek strong bearish candlestick hoti hai, jiska body large aur close price high aur open price low ke beech ka gap zyada hota hai. Yeh candle market ke bearish pressure aur downward momentum ko indicate karti hai.
2. **Doosri Candle:** Doosri candle ek bullish candlestick hoti hai jo pehli candle ke body ke beech mein close hoti hai. Iski body chhoti hoti hai aur yeh pehli candle ke close price ke aas paas finish hoti hai. Doosri candle ka close price pehli candle ke open price ke aas paas hota hai.
**Formation Aur Interpretation:**
1. **Formation:**
Bullish Meeting Line pattern tab banta hai jab ek strong bearish candle ke baad ek bullish candle market ke bearish trend ko reverse karne ke signal ke sath banti hai. Yeh pattern consolidation aur trend reversal ke potential signals ko indicate karta hai.
2. **Interpretation:**
Is pattern ka formation market ke bearish trend ke baad hota hai aur yeh signal karta hai ke market ke momentum mein change aane wala hai. Jab doosri candle ki body pehli candle ki body ke beech mein close hoti hai, to yeh bullish reversal ka signal hota hai aur market ke uptrend ke shuru hone ke chance ko indicate karta hai.
**Trading Strategy:**
1. **Entry Points:**
Bullish Meeting Line pattern ke entry points ko identify karne ke liye, traders ko confirmation signals ka intezaar karna chahiye. Agar pattern ke baad market bullish engulfing pattern ya higher highs bana rahi hai, to yeh buying opportunity ko indicate karta hai.
2. **Stop Loss Aur Take Profit Levels:**
Stop loss ko pattern ke neeche ke support level ke thoda sa niche set karna chahiye, taake aap unexpected market movements se bach sakein. Take profit levels ko market ke previous resistance levels ke basis par set kiya jata hai.
3. **Volume Confirmation:**
Bullish Meeting Line pattern ke signals ko volume ke sath confirm karna zaroori hai. High volume ke sath pattern ke formation ko validate kiya jata hai, jo trading signals ko strengthen karta hai aur market ki reliability ko increase karta hai.
**Conclusion:**
Bullish Meeting Line pattern forex aur stock trading mein ek valuable tool hai jo market ke potential bullish reversals ko identify karne mein madad karta hai. Is pattern ko sahi tarike se samajh kar aur confirmation indicators ke sath trading decisions ko implement karke, traders market trends aur price movements ko accurately analyze kar sakte hain. Bullish Meeting Line pattern ke faide ko utilize karke, aap apni trading strategy ko enhance kar sakte hain aur market ke opportunities ko effectively capture kar sakte hain.
اب آن لائن
Working...
تبصرہ
Расширенный режим Обычный режим