Discussion about Money Flow index?
-
MamiiSenior Member

- Jul 2023
- 353
- 76
- 552
- 28 USD
-
<a href="https://www.instaforex.org/ru/?x=ruforum">InstaForex</a> -
MamiiSenior Member
- Jul 2023
- 353
- 76
- 552
- 28 USD
Introduction Asalamu alaikum umeed h ky forex ky tmaam members blkol thek hon gy aj hum ap logon ky sath Jo topic share kr rahy Hain wo bhot zarori h ao ky liyh aj hum ap ky sath money flow ky bary Mai discuss kryn gy ky money flow Kiya h aur is ky bary Mai ap logon ky sath discussion kryn gy Jis sy apko bhot zyada faida hoga air ap forex Mai bhot earn kryn gy meaning Cash flow statement aik hai jo aik tijarti alay ka andar aur bahar number to amount to you meat to liye tareekhi qeemat aur hajam to data to card systemHi Terhanhalaat mein madad ka liye kya ja sakta hai. there is a labyrinth, mfi mukhtalif ho sakta hai, jo qeemat ki simt mein tabdeeli ka ishara day sakta hai. but hmmUsay baad mein labed tafseel se dekhen ge. Sab se pehlai, aayiyae dekhte hain to the cash flow indicator to hisaab kaisay lagaya jaye. Description Cash flow index to account we calculate cash flow index in mutadid iqdamaat shaamil hain. khush kismati se, metatrader 4 (mt4) or metatrader5 (m5je baat ki fikar karne ki zaroorat naha hai kana cash flow index ka khud hisab kaisay karen. taham, hisaab mein shaamil maybe I am samajhney se aap ko behtartor par yeh samajhney mein madad miley gi ke isharay aap ko kya dikha raha hai, aur liye mufeed hai agar aap mfi titigajarti hikmat ehtay karah amli. Strategy; Cash flow indicator wisdom e amli banan ke liye mfi takneeki isharay ko dosray isharay ke sath bhi istemaal kya ja sakta hai. ki aik misaal am f aayisignal ko moving average ke sath milana aur cross ko tijarti signal ke tor par istemaal karna hai. aisa karne ke liye, panjire mein isharay kana 'rujhan'Part mein harkat Pazeer ost isharay ko talaash karen. Ishray par press karen aur usay center qeemat to chart par ghaseetnay to bajaye, usay moneyflow indicator signal to newspaper par diagram. -
SaimkhnBanned
- Mar 2021
- 1318
- 25
- 1867
- 696 USD
-
Realome98Senior Member
- May 2024
- 1207
- 1
- 149
- 389 USD
Assalamu Alaikum Dosto!
Money Flow Index (MFI)
Ek strong trading financial markets, jese ke foreign exchange market, ka ek sab se ahem kaam paisa ki redisbursement hai. Stocks, precious metals, aur currency ki khareed/farokht ke zariye paisa person se person tak, company se company tak pohochta hai. Is tarah, ek market economy mein kuch hamwar haasil hoti hai, aur ek mustawar ban jata hai. Paisay ki daakhil ya nikalne ko cash flow kehte hain.
Forex bhi aise cash flows ka bohot complex aur dynamic system hai. Ek taajir jo tajaweez aur indicator readings ke peeche chhupay cash flows dekh sakta hai. Lekin agar koi khaas indicator istemal kare, toh koi bhi in cash flows ko nazar andaz nahi kar sakta. Ye indicator Money Flow Index ke naam se jana jata hai.
Money Flow Index (MFI) ek technical indicator hai jo ke price movement speed ka measure hai, jo ke Relative Strength Index (RSI) ke mutabiq hai. Iska farq RSI se hai ke iske calculations mein volume indicator ko shamil kiya jata hai. Is indicator ka moallif trader Bill Williams hai, unho ne is tool ko apne kitaab "Trading Chaos" mein describe kiya. Is oscillator ko banate waqt, unhone tick volume ko market ki expectations ka aham indicator bataya, jo ke price movement ke sath ta'alluq rakhta hai.
Volume indicator market mein aane wale naye orders ko darust karta hai, jo ke movement ki dar ko badal deta hai. Ya phir, ek aur taur par kaha jaye toh, naye players market mein aate hain aur trades ki tadad badha dete hain, jo ke tick volume mein tabdili dikhata hai. Is tarah, mojood dynamics ki taqat ya kamzori hoti hai.
MFI ka main faida yeh hai ke yeh ek stable instrument hai jo ke asset (jese ke currency ya stock) mein invest hone wale cash flows ki taqat ka durust measure deta hai. Money Flow Index positive aur negative cash flows ko mawafiq karke, ek measure deta hai jo ke price data ke sath mawafiq hokar trend ki taqat maloom karta hai. Jese ke RSI, MFI bhi 0 se 100 ke darmiyan values leta hai aur 14 candles ke istemal se calculate hota hai. Yeh dekhein ke MFI indicator MetaTrader 4 platform par kaise dikhta hai:
Money Flow Indicator Kaise Kaam Karta Hai?
MFI ka kaam market ke positive aur negative cash flows ki readings ko mawafiq karne ka hai. Agar kisi muddat ke liye price index zyada hai, toh yeh ishara karta hai ke funds asset mein daakhil ho rahe hain. Agar kisi muddat ke liye price index kam hai, toh yeh ishara karta hai ke investors funds asset se nikal rahe hain.
Ek asset ki price movement ko track karte hue aur ye dikhate hue ke trading volume badh raha hai ya kam ho raha hai, MFI trend ki taqat ko signal karta hai, jisse trading justified hoti hai, naye trend ka shuru hone ko pehchana ja sakta hai, ya woh waqt jab behtareen hai ke orders place na kiye jaayen. Yeh forex trading mein khaas tor par qeemti hai, kyun ke isse market entries ke liye aala tajaweez banai ja sakti hai.
Money Flow Index ke saath kaam karte waqt, yeh tips madde nazar rakhen:[LIST][*]Divergence ke data ke baren mein. Agar prices barh rahe hain aur Money Flow Index value ghat rahi hai (ya ulta ho), toh ek price reversal mumkin hai;[*]Money Flow Index ke readings 80 ke upar ya 20 ke neeche potential market top ya bottom ko indicate karte hain;[*]MFI har time frame par achhe taur par kaam karta hai - paanch minute se lekar haftay ke charts tak.
Is indicator ko setup karna laconic hai. Iske sirf ek parameter hote hain - period (default mein 14) jiski calculation hoti hai. Jitna chota period ka value hoga, utna hi MFI zyada responsive aur volatile hoga:
Yaad rakhein, zyada sensitivity bhi bohot achi nahi hoti - bohot saare false signals ho sakte hain.
Iske alawa, aap is indicator ke display ka style customize kar sakte hain aur levels set kar sakte hain. Default mein, woh 20% (20% ya is se kam - oversold area) aur 80% (80% ya is se zyada - overbought area) hote hain.
Money Flow Index Indicator Calculation
MFI indicator ka calculation algorithm kaafi complex hai. Isko yaad rakhne ki zarurat nahi hai, lekin is se waqif hona koi buri baat nahi hai taa'ke indicator ke peeche ki logic ka aam idea ho.
MFI calculation ke stages:- Candle ki closing price, minimum aur maximum price ke darmiyan ka arithmetic mean nikalna;
- Money Flow per unit of time calculate karna, average price ko volume se multiply karke positive flow (current average price pehle se zyada hai) ya negative flow (average price pehle se kam hai) se divide karke;
- Money Ratio indicator calculate karna, positive flows ki sum ko negative flows ki sum se divide karke;
- Money Flow Index indicator values ko direct calculate karna. Iske liye 100 ko Money Ratio indicator ki sum aur ek se divide karne ka result subtract karna hai.
Jo values nikalti hain woh 0 se 100 ke darmiyan hoti hain. Lines 20 aur 80 ya 30 aur 70 ko ahem levels samjha jata hai. 80 (70) se 100 ke darmiyan wala area overbought area kehlata hai. 0 aur 20 (30) ke darmiyan wala area oversold area kehlata hai.
Money Flow Index Signals MFI Kaise Read Karein
MFI ke principle se waqif hone ke baad, hum iske trading signals ko study kar sakte hain. Teen mukhya signals hote hain:
- Overbought/Oversold. Jese RSI aur doosre oscillators, Money Flow Index bhi market ke "overheating" ke waqt ko determine karne ke liye perfect hai. Agar MFI 80% level ko paar karta hai, toh yeh ishara karta hai ke market overbought hai. Jab indicator neeche jaane lagta hai aur dobara 80% level ko cross karta hai, lekin iss baar neeche se, toh yeh ek sell signal hai. Aur ulta, jab indicator 20% level ko neeche jaata hai, phir upar badhta hai aur oversold area se bahar nikalta hai, toh yeh ek buy signal hai.
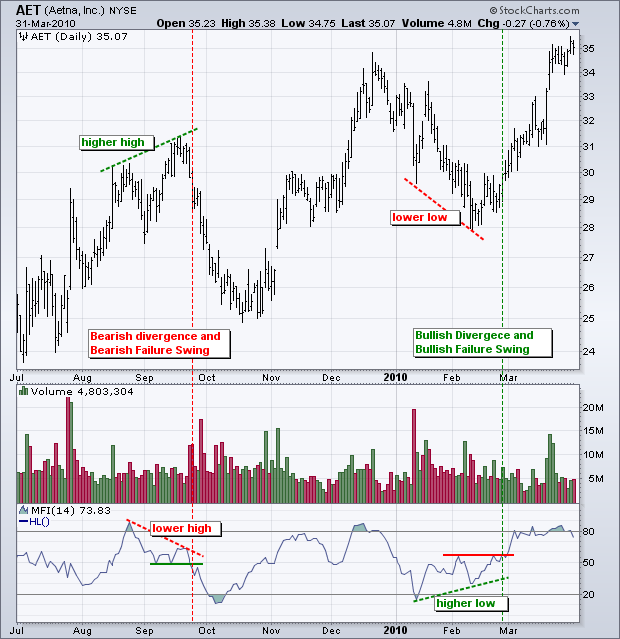
- Divergence. Yeh ek classic aur bohot taqatwar reversal signal hai oscillators ke liye. Divergence - chart par price movement ki direction aur indicator readings mein farq. Aur aise divergence par, aapko bilkul indicator ki taraf tawajjo deni chahiye.
Misaal ke liye, chart par do local minimums (troughs) hain, aur doosra trough pehle se kam hai. Visual taur par, chart par price gir rahi hai, trend neeche ki taraf hai. Lekin indicator chart par, tasweer ulta hai. Wahan bhi do troughs bane hain jo ke price chart ke ke mutabiq hain, lekin doosra indicator ka minimum pehle se zyada hai. Yeh ek bullish divergence hai, jo ke ishara karta hai ke market jald hi reverse hoga aur upar jaayega.
Wahi, lekin ulta (divergence in the highs, aur peaks), bearish divergence hogi, jo ke neeche market ke reversal ko ishara karegi. By the way, agar divergence 2nd extremum (highs, lows) par nahi balki 3rd par (highs, lows), toh signal aur bhi majboot ho jayega. - Central Line ka Cross. Yeh shayad MFI ka sabse asaan trading signal ho. Hum indicator chart par central line (50%) ko add karte hain aur intezaar karte hain ke isse cross ho. Agar MFI ise neeche se cross karta hai, toh yeh ek buy signal hai; upar se neeche jaata hai, toh sell signal hai.
Money Flow Index (MFI) Ki Trading
MFI indicator ke istemal ki principles RSI ke istemal se kuch zyada nahi farq karte. Chaliye inko ek ek karke discuss karte hain.
Jese ke humne pehle bhi kaha hai, 20 aur 80 levels Money Flow indicator ke liye ahem levels hote hain. Jab yeh pair line 80 ko neeche cross karta hai, toh yeh indicator ek signal deta hai ke currency pair ko bechna chahiye. Agar chart line oversold area se bahar nikal jata hai (20 level ko upar cross karta hai), toh humein umeed hai ke price mein izafa hoga.
Yeh signals 100% darust nahi hote aur inhe mazeed filters ki zarurat hoti hai. Aap is indicator ke readings ko check karne ke liye overbought aur oversold areas par calculate hone wale doosre oscillators ka istemal kar sakte hain, jo ke alag tareeqe se calculate hote hain. For example, Stochastic.
MFI indicator ke 50 level ke relative position ne pair ki sentiment ko indicate karta hai. Agar chart ise neeche se cross karta hai, toh yeh ishara karta hai ke pair bearish mood mein hai. Jab indicator line 50 level ko upar cross karti hai, toh yeh darust hai ke market par bulls ka dominion hai.
MFI indicator jo ke cash flow ki intensity ko napta hai, ek umoomi oscillator hai. Iska istemal classical scheme par kaam karne ke liye mumkin hai (divergences ki talash, overbought/oversold areas), lekin yeh doosre tools ke bina kaam karna zyada mufeed nahi hai. Behtar hai ke aap ise doosre indicators ke saath istemal karen takay market mein galat dakhil hone ki tadad ko kam kiya ja sake aur trading ki munafaat ko barhaya ja sake.
-
AbjabbarSenior Member
- Sep 2022
- 637
- 666
- 478
- 336 USD
Forex Market Mein Money Flow Index (MFI){}{}{}
Money Flow Index (MFI) Forex market mein ek technical indicator hai jo price aur volume ka istemal karke overbought aur oversold conditions ko identify karta hai. Yeh indicator typically 14-period ka hota hai aur ek oscillator ke tarah kaam karta hai, jo 0 se 100 ke range mein fluctuate karta hai. MFI ko "volume-weighted RSI" bhi kaha jata hai kyunki yeh Relative Strength Index (RSI) ke similar hai, lekin MFI volume ko bhi consider karta hai.
Forex Market Mein Money Flow Index (MFI) Ki Ehmiyat{}{}{}
Interpretation of MFI- Overbought Condition: When MFI is above 80, it indicates that the asset may be overbought, and a price correction could be expected.
- Oversold Condition: When MFI is below 20, it indicates that the asset may be oversold, and a price increase could be expected.
- Divergence: A divergence between MFI and price can indicate a potential reversal. For example, if prices are rising but MFI is falling, it might indicate weakening buying pressure and a potential reversal to the downside.
Traders use MFI in the Forex market to:- Identify potential reversal points.
- Confirm price trends.
- Generate buy and sell signals based on overbought and oversold conditions.
- Analyze volume in conjunction with price movement to gauge market strength.
- Entry and Exit Points: Traders use MFI to determine optimal entry and exit points. For instance, a trader might consider entering a long position when MFI moves out of the oversold zone (below 20) and a short position when MFI moves out of the overbought zone (above 80).
- Trend Reversals: By identifying divergences between MFI and price, traders can predict potential trend reversals.
- Confirming Other Indicators: MFI can be used in conjunction with other technical indicators like RSI, MACD, or moving averages to confirm signals and enhance trading strategies.
- Volume Analysis: In Forex, where volume data may not be as transparent as in stock markets, MFI provides a useful approximation of volume trends based on price movements.
-
<a href="https://www.instaforex.org/ru/?x=ruforum">InstaForex</a> -
12345678910Senior Member
- May 2024
- 243
- 50
- 35
- 53 USD
### Money Flow Index (MFI) Overview
The Money Flow Index (MFI) is a technical indicator used in financial markets to measure the buying and selling pressure of an asset over a certain period. It is similar to the Relative Strength Index (RSI) but includes volume, making it a volume-weighted RSI.
### Calculation Steps
1. **Typical Price**:
Calculate the typical price for each period:
\[
\text{Typical Price} = \frac{\text{High} + \text{Low} + \text{Close}}{3}
\]
2. **Money Flow**:
Multiply the typical price by the volume for that period:
\[
\text{Money Flow} = \text{Typical Price} \times \text{Volume}
\]
3. **Positive and Negative Money Flow**:
- Positive Money Flow: Sum of money flow on days when the typical price is higher than the previous day's typical price.
- Negative Money Flow: Sum of money flow on days when the typical price is lower than the previous day's typical price.
4. **Money Flow Ratio**:
\[
\text{Money Flow Ratio} = \frac{\text{Positive Money Flow}}{\text{Negative Money Flow}}
\]
5. **Money Flow Index (MFI)**:
\[
\text{MFI} = 100 - \left( \frac{100}{1 + \text{Money Flow Ratio}} \right)
\]
### Interpretation
- **Overbought and Oversold Levels**:
- MFI above 80 typically indicates overbought conditions, suggesting a potential sell opportunity.
- MFI below 20 typically indicates oversold conditions, suggesting a potential buy opportunity.
- **Divergence**:
- **Bullish Divergence**: When the price makes new lows but MFI makes higher lows, it suggests a potential upward reversal.
- **Bearish Divergence**: When the price makes new highs but MFI makes lower highs, it suggests a potential downward reversal.
### Practical Use Cases
1. **Trend Confirmation**:
MFI can confirm the strength of a trend. For instance, during a strong uptrend, the MFI tends to stay above 50. Conversely, in a strong downtrend, the MFI remains below 50.
2. **Trade Signals**:
Traders use MFI to generate buy and sell signals based on overbought and oversold conditions and divergence patterns.
3. **Volume Analysis**:
By incorporating volume, the MFI provides additional insights that price-only indicators like RSI may miss. High volume days with strong price movements indicate stronger buying or selling pressure.
### Example Calculation
Consider a stock with the following data over five days:
| Day | High | Low | Close | Volume |
|-----|------|-----|-------|---------|
| 1 | 10 | 8 | 9 | 100,000 |
| 2 | 12 | 9 | 11 | 150,000 |
| 3 | 11 | 9 | 10 | 120,000 |
| 4 | 14 | 10 | 13 | 200,000 |
| 5 | 13 | 11 | 12 | 180,000 |
1. **Calculate Typical Price**:
- Day 1: \((10 + 8 + 9) / 3 = 9\)
- Day 2: \((12 + 9 + 11) / 3 = 10.67\)
- Day 3: \((11 + 9 + 10) / 3 = 10\)
- Day 4: \((14 + 10 + 13) / 3 = 12.33\)
- Day 5: \((13 + 11 + 12) / 3 = 12\)
2. **Calculate Money Flow**:
- Day 1: \(9 \times 100,000 = 900,000\)
- Day 2: \(10.67 \times 150,000 = 1,600,500\)
- Day 3: \(10 \times 120,000 = 1,200,000\)
- Day 4: \(12.33 \times 200,000 = 2,466,000\)
- Day 5: \(12 \times 180,000 = 2,160,000\)
3. **Determine Positive and Negative Money Flow**:
- Positive Money Flow: Add money flow for days where typical price is higher than previous day: \(1,600,500 + 2,466,000\)
- Negative Money Flow: Add money flow for days where typical price is lower than previous day: \(900,000 + 1,200,000\)
4. **Calculate Money Flow Ratio and MFI**:
\[
\text{Money Flow Ratio} = \frac{4,066,500}{2,100,000} = 1.937
\]
\[
\text{MFI} = 100 - \left( \frac{100}{1 + 1.937} \right) = 65.94
\]
### Limitations
- **False Signals**:
In volatile or low-volume markets, MFI can produce false signals, indicating potential reversals that do not materialize.
- **Lagging Indicator**:
Since MFI relies on historical data, it may lag behind actual market movements, potentially leading to delayed trade signals.
### Conclusion
The Money Flow Index is a versatile tool for traders and analysts, offering insights into market momentum and potential reversal points by combining price and volume data. Its ability to signal overbought and oversold conditions, confirm trends, and detect divergences makes it a valuable component of technical analysis. However, like any indicator, it should be used in conjunction with other tools and analysis techniques to improve trading decisions and reduce the likelihood of false signals.
Working...
تبصرہ
Расширенный режим Обычный режим