Tripple bottom chart patterns kia hn?
-
AyubRanaSenior Member

- Sep 2020
- 1154
- 23
- 537
- 88 USD
-
<a href="https://www.instaforex.org/ru/?x=ruforum">InstaForex</a> -
AyubRanaSenior Member
- Sep 2020
- 1154
- 23
- 537
- 88 USD
Assalam alaikum dear members ! umeed ha ap sb khairiat se hn gy or apki trading achi ja ri ho ge. dear members aj ki post main hum tripple bottom chart pattern ko study karen gy or dekhen gy k isko kesy trade kia jata ha. What is Tripple bottom chart pattern? Dear members tripple bottom chart pattern aik bullish reversal pattern ha. Ye pattern bearish trend k end main bnta ha or es k bad market buy main jati ha. es pattern main market 3 bar aik support zone py touch karti ha jski wja se tripple bottom bnti ha. How it is Formed? dear members bearish trend k end main jb market kafi nechy gir chuki hoti ha to us k bad market aik support area de reject ho k wapis aik resistace ki trf ati ha or wahan se wps reject ho k apni previous support ki trf jati ha. es trha aik muqam py market 2 lows bnati ha or wahan se wapis previous resistance ki trf jati ha or reject ho k previous support ki trf ati ha or estrha 3 bar aik support ko touch krti ha or tripple bottom pattern bnta ha.3rd time apni support se reject ho k market opr ki trf jati ha or bearish trend end ho jata h or market bullish side ki trf jati ha. Neckline: dear member bottom k bnany k bad market opr js resistance se reject hoti ha 2 bar usko neckline kaha jata ha. Breakout of Neckline:dear member tripple bottom chart pattern main trade karny k lye hamen pattern ki completion ka wait karna chahye. jb pattern complete ho jy to es k breakout ka wait karna chahye or neckline k breakout k bad hm es pattern main sell ki trade le skty hain. laikin breakout k bad confirmation lazmi ha. breakout ki confirmation ye ha k market neckline k bhr usi time frame main candle close kary js main ye pattern bny. or eski 2nd confirmation ye ha k breakout k bad market neckline ko dobara test kary.3rd time apni support se reject ho k market opr ki trf jati ha or bearish trend end ho jata h or market bullish side ki trf jati ha. Neckline: dear member bottom k bnany k bad market opr js resistance se reject hoti ha 2 bar usko neckline kaha jata ha. Breakout of Neckline:dear member tripple bottom chart pattern main trade karny k lye hamen pattern ki completion ka wait karna chahye. jb pattern complete ho jy to es k breakout ka wait karna chahye or neckline k breakout k bad hm es pattern main sell ki trade le skty hain. laikin breakout k bad confirmation lazmi ha. breakout ki confirmation ye ha k market neckline k bhr usi time frame main candle close kary js main ye pattern bny. or eski 2nd confirmation ye ha k breakout k bad market neckline ko dobara test kary.es pattern main trade leny k lye hmara stop loss us neckline py ho ga jahan se breakout ho. or profit target neckline se support tk k area ki height k equal ho ga. -
<a href="https://www.instaforex.org/ru/?x=ruforum">InstaForex</a> -
Azaz1Member
- Jan 2022
- 34
- 71
- 336
- 449 USD
InstaSpot: کسی بھی EPS اور بینک سے منافع واپس لیں، اور EPS اور cryptocurrencies کے تبادلے پر 7% تک کمائیں۔
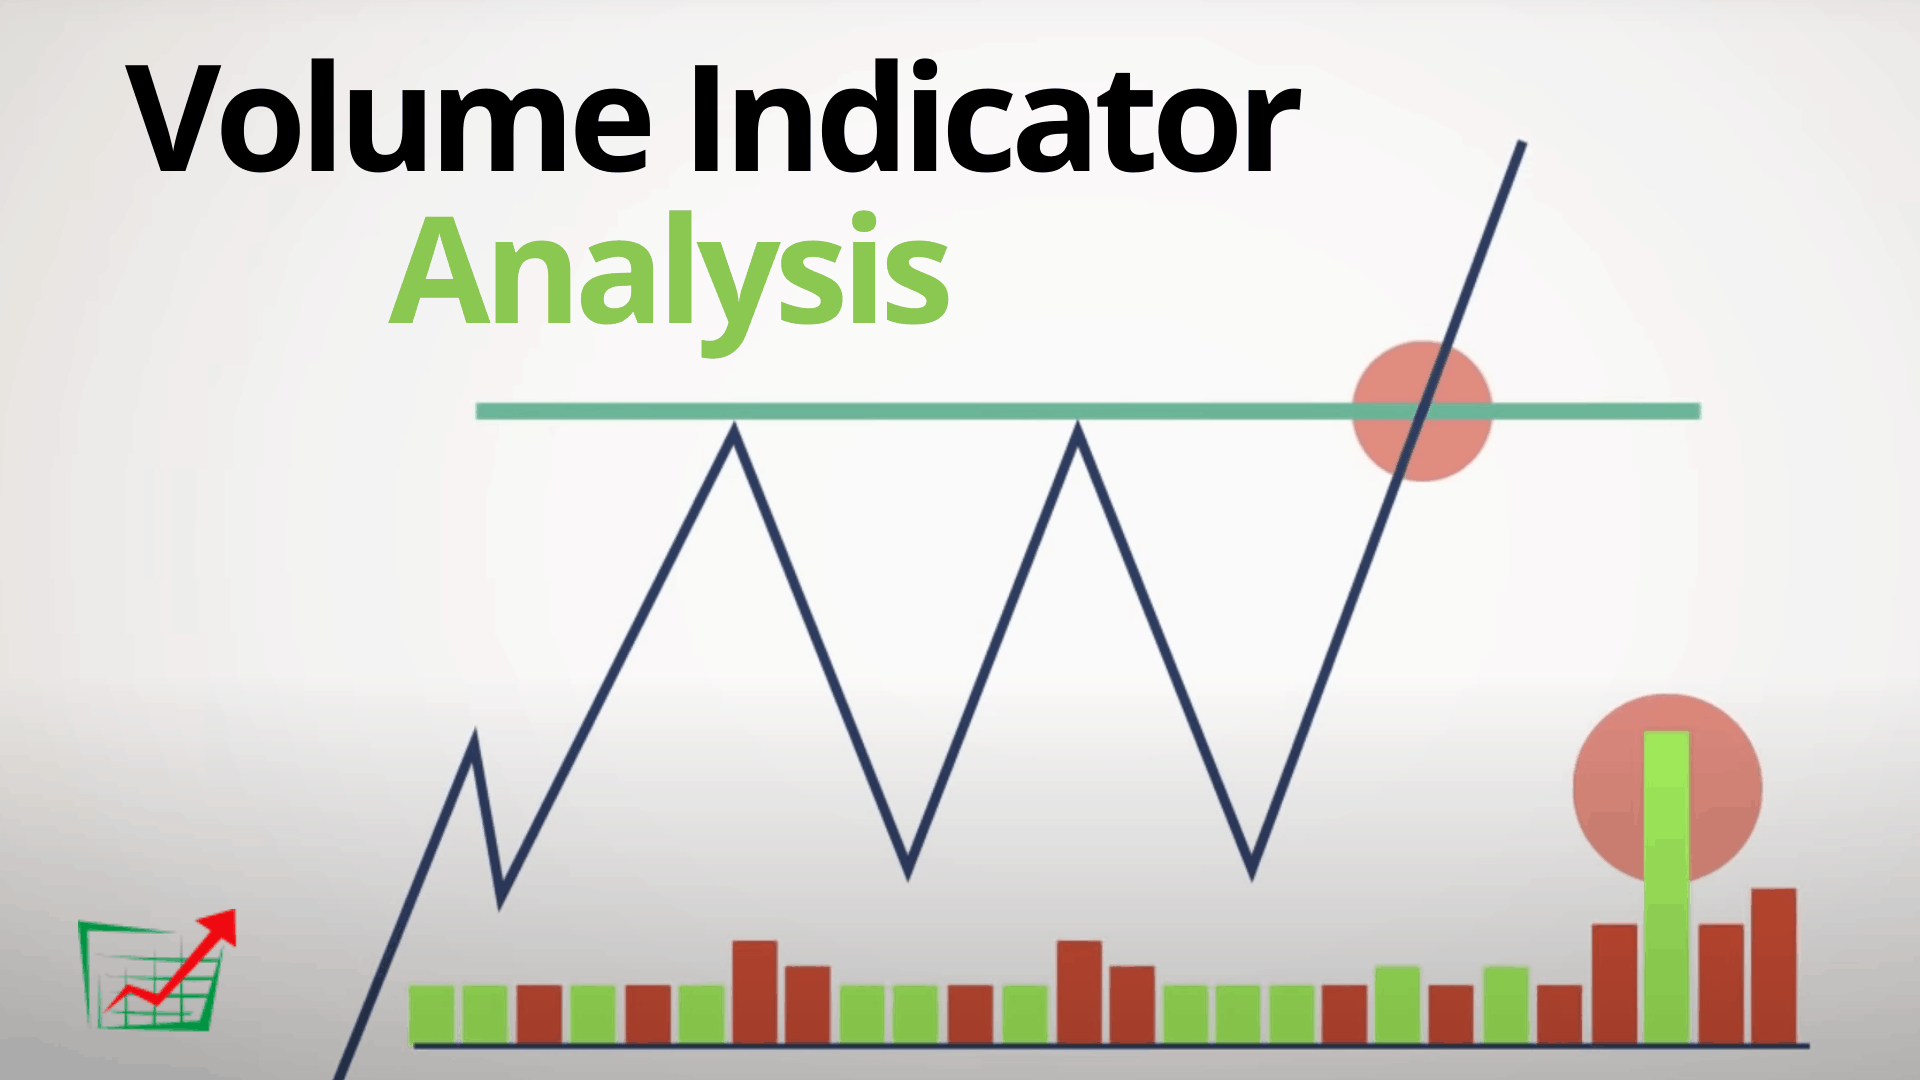
Triple Bottom chart pattern ek technical analysis concept hai jo ke financial markets, jaise ke stocks ya currencies, mein istemal hota hai. Is pattern mein, ek security ya financial instrument ki price mein teen baar neeche girne ki tendency hoti hai, lekin har baar woh neeche girne ke baad phir se ek certain level par recover karta hai. Ye pattern generally downtrend ya price decline ke dauraan dikhai deta hai aur traders iska use future price movement predict karne mein karte hain.Triple Bottom pattern ki shanakht kuch is tarah hoti hai: Three Lows: Price mein three distinct lows hote hain, jo similar ya almost similar levels par hote hain. Har baar price us level par gir kar rukta hai aur phir se upar uthne ki koshish karta hai. Resistance Level Breakout: Jab price teesri baar neeche girne ke baad phir se upar uthne ki koshish karta hai aur pehle do lows ko paar karke ek specific resistance level ko breakout karta hai, tab yeh pattern confirm hota hai. Is breakout se price ka uptrend start hota hai.Volume Analysis: Is pattern ki confirmation ke liye, volume ki bhi analysis ki jati hai. Normally, jab price lows tak girta hai aur fir se recovery ki taraf jaata hai, tab volume bhi increase hota hai. Isse yeh indicate hota hai ki market sentiment change ho raha hai.
 Price Target: Price ke recovery ke baad, traders is pattern ka use karke price ka target set karte hain. Generally, yeh target approximately triple bottom pattern ki height (lowest point se resistance level tak) ka distance hota hai. Triple Bottom pattern ki madad se traders prices ke trend change ko anticipate karte hain. Agar yeh pattern sahi tareeqay se form ho jaye aur confirmation mil jaye, toh yeh ek potential buying opportunity bhi ho sakti hai.Dhyan rahe ke market analysis aur trading risk ke saath juda hua hai. Pattern recognition ke alawa bhi, aapko fundamental aur technical analysis ke concepts ko samajhna zaroori hai. Trading karne se pehle hamesha apne financial goals aur risk tolerance ko samajhna mahatvapurn hai, aur behtar hoga ke aap kisi financial expert ya advisor se salah lein.
Working...
تبصرہ
Расширенный режим Обычный режим