Tri star candlestick pattern
-
zaigu12Senior Member

- Mar 2023
- 420
- 10
- 14 USD
-
<a href="https://www.instaforex.org/ru/?x=ruforum">InstaForex</a> -
zaigu12Senior Member
- Mar 2023
- 420
- 10
- 14 USD
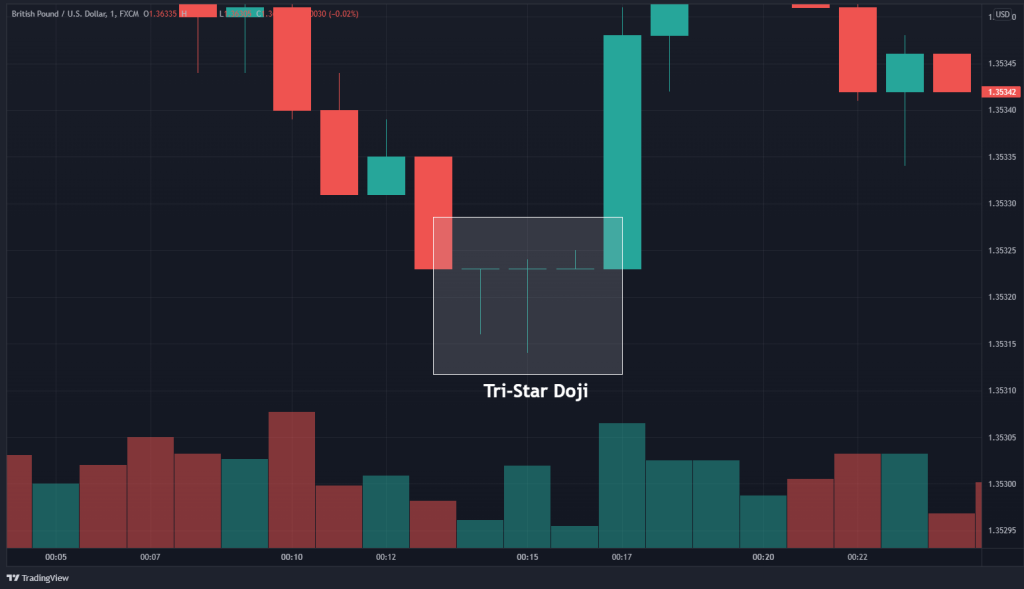
"Tri-Star" candlestick pattern ek rare aur complex pattern hota hai jo ki trend reversal ko indicate karta hai. Yeh pattern kuch specific candle formations se mil kar banta hai aur traders ko potential market direction change ke baare mein hint deta hai. Tri-Star pattern mein, teen consecutive candlesticks hote hain jo ek specific order mein arrange hote hain. Yeh teen candles hote hain: ek doji, ek smaller candle (jiska range doji ke andar hota hai), aur fir ek doji candle.
Doji Candle: Pehli candle ek doji hoti hai. Doji candle ka open aur close price almost same hota hai ya phir thoda sa difference hota hai. Yeh candle market indecision ko represent karta hai.
Smaller Candle: Dusri candle, doji candle se choti hoti hai aur uska range doji ke andar hota hai. Is candle ki body kisi specific direction mein move karti hai, jo indicate karta hai ke market mein ek taraf ki movement ho sakti hai.
Doji Candle (Fir se): Teesri candle fir se ek doji hoti hai, jo pehli doji candle ke paas hoti hai. Yeh doji candle phir se market indecision ko dikhata hai. Tri-Star pattern ko spot karke traders ko kuch potential insights mil sakte hain: Agar pehli doji bullish trend ke baad aati hai aur dusri small candle bearish trend ke baad, toh tri-star pattern ek possible bearish reversal signal ho sakta hai. Yani market niche jane ki possibility ho sakti hai. Agar pehli doji bearish trend ke baad aati hai aur dusri small candle bullish trend ke baad, toh tri-star pattern ek possible bullish reversal signal ho sakta hai. Yani market upar jane ki possibility ho sakti hai. Tri-Star pattern ka use karte waqt, traders ko confirmatory indicators aur price action ki detailed analysis ki bhi zaroorat hoti hai. Is pattern ke appearance ke baad market direction confirm karna challenging ho sakta hai, isliye traders ko cautious rehna chahiye. Yad rahe ke market mein pattern ke appearance aur unke implications ko understand karne ke liye thorough analysis aur practice ki zaroorat hoti hai. Is pattern ke saath risk management aur entry/exit strategy ko bhi dhyan mein rakhna important hai.
-
sultan77Senior Member
- Apr 2023
- 714
- 34
- 3
**Three Star Candlestick Pattern: An Explanation** Three Star candlestick pattern ek complex candlestick pattern hai jo traders ko potential trend reversals ya trend continuation ke signals provide karta hai. Yeh pattern teen alag alag candlesticks se bana hota hai, jinmein specific price movements aur patterns ko observe kiya jata hai. **Explanation:** Three Star candlestick pattern mein teen candlesticks involved hote hain: ek bullish (upward) candle, ek doji candle (jismein open aur close price barabar hote hain), aur ek bearish (downward) candle. In teen candlesticks ke patterns aur sequence ko analyze karke traders trend reversals aur trend continuation ka pata lagate hain. **Types of Three Star Patterns:** 1. **Bullish Three Star:** Is pattern mein pehle bearish candle ke baad ek doji candle aur phir ek bullish candle aata hai. Bullish Three Star pattern bullish trend reversal ka potential dikhata hai. 2. **Bearish Three Star:** Is pattern mein pehle bullish candle ke baad ek doji candle aur phir ek bearish candle aata hai. Bearish Three Star pattern bearish trend reversal ka possibility indicate karta hai. **Benefits of Three Star Patterns:** 1. **Trend Reversal Signals:** Three Star pattern bullish ya bearish trend reversal ke signals provide karta hai, jahan trend ka direction change hone ka expectation hota hai. 2. **Trend Continuation Indication:** Agar Three Star pattern existing trend mein form hota hai, to yeh trend continuation ka potential dikhata hai. 3. **Entry and Exit Points:** Three Star pattern entry aur exit points confirm karne mein madad deta hai, jisse traders sahi samay par trade kar sakte hain. **Drawbacks of Three Star Patterns:** 1. **Complexity:** Three Star pattern ko interpret karna complex ho sakta hai, khaaskar new traders ke liye. 2. **False Signals:** Kabhi-kabhi Three Star patterns false signals bhi de sakte hain, jahan actual reversal nahi hota. 3. **Market Conditions:** Market volatility ke dauran Three Star patterns ka interpretation mushkil ho sakta hai. **Conclusion:** Three Star candlestick pattern traders ke liye important tool hai jo potential trend reversals aur trend continuation ko samajhne mein madad deta hai. Lekin traders ko pattern ki complexity aur false signals ka bhi dhyan dena chahiye. Three Star pattern ko confirm karne ke liye other technical indicators aur analysis ki zaroorat hoti hai. Is pattern ki madad se traders apne entry aur exit points improve kar sakte hain, lekin proper research aur practice zaroori hai. Three Star pattern traders ko market movements aur trend changes ko better samajhne mein madad deta hai. Overall, is pattern ka istemal traders ki analysis skills aur trading decisions ko enhance karne mein madadgar ho sakta hai, lekin iska istemal karte waqt caution aur confirmation ki zaroorat hoti hai. -
Fahid5Senior Member
- Feb 2024
- 757
- 24
- 55
- 177 USD
Tri star candlestick pattern
Forex trading mein mukhtalif candlestick patterns istemal ki jaati hain jo traders ko market ke movement aur possible trend reversals ko samajhne mein madad karti hain. Inhi patterns mein se ek "Tri Star Candlestick Pattern" bhi hai. Is article mein hum Tri Star Candlestick Pattern ko Roman Urdu mein samjhenge, iske mukhtalif pehluon ko explore karenge aur yeh dekhenge ke yeh pattern forex trading mein kis tarah madadgar ho sakta hai.
Tri Star Candlestick Pattern: Kya Hai?
Tri Star Candlestick Pattern ek rare reversal pattern hai jo market mein trend reversal ko indicate karta hai. Yeh pattern generally teen doji candles se mil kar banta hai jo market ke indecision ko represent karti hain. Yeh pattern bohot strong reversal signal hota hai, lekin bohot kam dekhne ko milta hai.
Tri Star Candlestick Pattern Ki Pehchaan
Tri Star Candlestick Pattern ko pehchanne ke liye kuch khas cheezain hain jo aapko is pattern ko identify karne mein madad kar sakti hain:
1. Doji Candles
Tri Star Pattern teen consecutive doji candles se mil kar banta hai. Doji candle wo hoti hai jisme opening aur closing price almost equal hoti hai, jo market ke indecision ko show karti hai.
2. First Doji Candle
Pehli doji candle ek trend ke continuation ke baad banti hai, jo current trend ki strength ko weaken karne ka indication deti hai.
3. Second Doji Candle
Dusri doji candle pehli candle ke close ke qareeb banti hai aur market ke indecision ko aur bhi confirm karti hai.
4. Third Doji Candle
Teesri doji candle previous doji candles ke close ke qareeb banti hai aur trend reversal ke strong signal ko confirm karti hai.
5. Location of the Pattern
Yeh pattern generally extreme market conditions mein banta hai, jaise ke strong uptrend ke top ya strong downtrend ke bottom par.
Types of Tri Star Candlestick Pattern
Tri Star Pattern do types ka hota hai:
1. Bullish Tri Star Pattern
Bullish Tri Star Pattern ek downtrend ke bottom par banta hai aur market ke potential reversal ko indicate karta hai. Yeh pattern teen doji candles se mil kar banta hai jo downtrend ke baad banti hain aur potential uptrend ko show karti hain.
2.Bearish Tri Star Pattern
Bearish Tri Star Pattern ek uptrend ke top par banta hai aur market ke potential reversal ko indicate karta hai. Yeh pattern teen doji candles se mil kar banta hai jo uptrend ke baad banti hain aur potential downtrend ko show karti hain.
Tri Star Candlestick Pattern Trading Strategy
Tri Star Pattern trading strategy ko samajhne ke liye neeche diye gaye steps follow kiye jate hain:
1. Pattern Identification
Sab se pehle, aapko Tri Star Pattern ko identify karna hoga. Iske liye, aapko market mein teen consecutive doji candles ko dekhna hoga jo extreme market conditions mein banti hain.
2. Trend Reversal Confirmation
Pattern ko identify karne ke baad, aapko trend reversal ka confirmation lena hoga. Yeh confirmation generally pattern ke baad aane wali strong bullish ya bearish candle se milta hai.
3. Entry Point
Trend reversal confirmation ke baad, aapko trade enter karna hoga. Bullish Tri Star Pattern mein, aap buy trade enter karte hain jab ke Bearish Tri Star Pattern mein, aap sell trade enter karte hain.
4. Stop-Loss aur Take-Profit Levels
Trading ke doran risk management bohot zaroori hai. Aapko apne trades ke liye proper stop-loss aur take-profit levels set karne honge. Stop-loss typically previous low ya high ke thoda neeche ya upar set kiya jata hai jab ke take-profit levels market ke next support ya resistance levels ke qareeb set kiye jate hain.
Tri Star Candlestick Pattern Ke Fayde aur Nuksan
Tri Star Pattern trading strategy ke kuch fayde aur nuksan hain jo neeche diye gaye hain:
Fayde:- Strong Reversal Signal: Tri Star Pattern ek strong reversal signal hota hai jo market ke major trend changes ko indicate karta hai.
- Clear Entry aur Exit Points: Is pattern ke zariye aap clear entry aur exit points identify kar sakte hain.
- Rare Pattern: Yeh pattern rare hota hai, isliye jab banta hai to bohot strong aur reliable signal provide karta hai.
- Rare Occurrence: Yeh pattern bohot rare hota hai, isliye aapko is pattern ka intizar karna par sakta hai.
- False Signals: Kabhi kabhi market mein false signals bhi generate ho sakte hain, isliye proper confirmation lena zaroori hai.
- Market Conditions: Yeh pattern extreme market conditions mein banta hai, isliye har market condition mein applicable nahi hota.
Tri Star Pattern ke practical example ko samajhne ke liye, chaliye ek hypothetical scenario ko dekhte hain:
Example: Bullish Tri Star Pattern- Downtrend: Suppose karein ke USD/JPY pair mein ek strong downtrend chal raha hai aur price rapidly decrease ho rahi hai.
- First Doji Candle: Downtrend ke baad ek doji candle banti hai jo downtrend ke weakness ko show karti hai.
- Second Doji Candle: Pehli doji candle ke baad dusri doji candle banti hai jo market ke indecision ko confirm karti hai.
- Third Doji Candle: Dusri doji candle ke baad teesri doji candle banti hai jo trend reversal ka strong signal deti hai.
- Reversal Confirmation: Teesri doji candle ke baad ek strong bullish candle banti hai jo trend reversal ka confirmation deti hai.
- Entry Point: Bullish candle ke confirmation ke baad aap buy trade enter karte hain.
- Stop-Loss: Stop-loss previous low ke neeche set karte hain.
- Take-Profit: Take-profit market ke next resistance level ke qareeb set karte hain.
Tri Star Candlestick Pattern forex trading mein ek rare lekin strong reversal pattern hai jo market ke major trend changes ko indicate karta hai. Is pattern ke istemal se traders clear entry aur exit points identify kar sakte hain aur apne trades ko effectively manage kar sakte hain. Lekin, hamesha yad rahe ke trading mein risk hota hai aur proper risk management bohot zaroori hai. Tri Star Pattern ke saath saath aapko market ke doosre indicators aur analysis tools ko bhi istemal karna chahiye taake aapke trading decisions behtareen ho sakein.
-
Adil88Senior Member
- Apr 2024
- 1419
- 86
- 180
- 308 USD
Forex Trade Mein Tri Star Candlestick Pattern Ki Ahmiyat- Forex Trading Mein Candlestick Patterns
Forex trading ka aik aham hissa candlestick patterns hain jo traders ko market ki movements samajhne mein madad deta hai. In patterns mein se aik ahem pattern Tri Star Candlestick Pattern hai jo trend reversals aur market ki directions ka andaza lagane mein bohot ahmiyat rakhta hai.
Candlestick patterns, market psychology ko samajhne ka ek zariya hain. Har ek candlestick ek mukhtalif kahani bayan karta hai, jaise ke buyers aur sellers ke darmiyan ki struggle, aur market sentiment ka pata lagane mein madad karta hai.
Mukhtalif candlestick patterns ka istemal kar ke traders market trends ko samajhte hain aur sahi trading decisions lete hain. Candlestick patterns ka istemal karna traders ko entry aur exit points ka tay karna, aur stop loss aur take profit levels ko set karne mein madad deta hai.
- Tri Star Candlestick Pattern Kya Hai?
Tri Star Candlestick Pattern ek technical analysis tool hai jo trend reversals ko pehchanne mein istemal hota hai. Is pattern mein teen mukhtalif candlesticks hoti hain jo ek dusre ke qareeb qareeb band hoti hain aur market ke mukhtalif phases ko darust karte hain.
Yeh pattern rare hota hai, lekin jab yeh appear hota hai toh iski significance bohot zyada hoti hai. Is pattern mein teen consecutive candlesticks hoti hain jo ek dusre ke qareeb qareeb band hoti hain, aur iske appearance ke baad market mein significant changes ane ki possibility hoti hai.
Tri Star Pattern ka appearance market ke direction mein aik mukhtalif phase ya reversal ki nishani ho sakti hai, isliye isko samajhna aur sahi tajziya karna traders ke liye zaroori hai.
- Tri Star Pattern Ki Tashreeh
Tri Star Pattern mein pehli candlestick ek star ke qareeb band hoti hai, doosri candlestick ki body choti hoti hai aur teessri candlestick phir se ek star ke qareeb band hoti hai. Is pattern ko samajhne ke liye traders ko mukhtalif indicators aur price action ki tafseelat ko ghor se dekhna zaroori hota hai.
Pehli candlestick ek significant move ko indicate karta hai jo ke market mein volatility aur uncertainty ko show karta hai. Doosri candlestick ki choti body aur kam volume se market mein stability ka indication hota hai, jabke teessri candlestick phir se ek star ke qareeb band hone se trend reversal ki confirmation milti hai.
Is pattern ko samajhne ke liye traders ko doosre technical indicators aur price action patterns ko bhi shamil karna chahiye taake sahi trading decisions li ja sakein.
- Pehli Candlestick: Star Ke Qareeb
Pehli candlestick ek star ke qareeb band hoti hai, jo ke market mein uncertainty aur volatility ko darust karti hai. Is candlestick ke appearance ke baad traders ko aur indicators ki madad se market ki movements ka andaza lagana zaroori hota hai.
Jab market mein volatility barh jati hai, toh yeh ek indication ho sakti hai ke market mein significant changes hone wale hain. Traders ko is stage par cautious rehna chahiye aur market ki movements ko closely monitor karna chahiye.
Is stage par traders ko aur tafseelat aur confirmatory signals ki talash mein rehna chahiye, taake sahi trading decisions li ja sakein.
- Dusri Candlestick: Choti Body
Doosri candlestick ki body choti hoti hai aur iski wajah se market mein movement ki kami aur stability nazar aati hai. Is stage mein market mein uncertainty kam hoti hai lekin trend reversal ki possibility barh jati hai.
Doosri candlestick ka appearance market mein ek potential trend reversal ka indication ho sakta hai. Traders ko is stage par doosre indicators aur price action patterns ki madad se market ki movements ko samajhna zaroori hai, taake sahi trading decisions li ja sakein.
Is stage par traders ko market ki movements ko closely monitor karna chahiye aur confirmatory signals ki talash mein rehna chahiye.
- Teessri Candlestick: Star Ke Qareeb
Teessri candlestick phir se ek star ke qareeb band hoti hai, jo ke trend reversal ko confirm karta hai. Is stage mein volume mein izafa hota hai aur traders ko sahi aur munasib entry aur exit points ka intikhab karna hota hai.
Teessri candlestick ka appearance trend reversal ki confirmation ka indication deta hai. Traders ko is stage par apne trading plan ke mutabiq action lena chahiye aur market ki movements ko closely monitor karna chahiye.
Is stage par traders ko confirmatory signals aur doosre technical indicators ki tajziya karna chahiye taake sahi trading decisions li ja sakein.
- Tri Star Pattern Ka Tafsili Tajziya
Tri Star Pattern ko samajhne ke liye traders ko tafseelat se ghor karna zaroori hai. Is pattern ke appearance ke baad market ki movements, volume, aur doosre technical indicators ki tajziya karni chahiye taake sahi trading decisions li ja sakein.
Jab bhi Tri Star Pattern ka appearance hota hai, toh traders ko market ki movements ko closely monitor karna chahiye aur confirmatory signals ki talash mein rehna chahiye. Is pattern ko samajhne ke liye traders ko mukhtalif technical analysis tools aur price action patterns ko bhi shamil karna chahiye.
Tri Star Pattern ka appearance market ke direction mein significant changes ya reversal ki nishani ho sakti hai, isliye isko samajhna aur sahi tajziya karna traders ke liye zaroori hai.
- Tri Star Pattern Ki Tasdeeq
Tri Star Pattern ki tasdeeq karne ke liye traders ko doosre indicators ka bhi istemal karna hota hai. Maslan, moving averages, RSI, aur MACD jaise indicators ko istemal kar ke traders apne analysis ko mazeed tasdeeq kar sakte hain.
Jab bhi Tri Star Pattern ka appearance hota hai, toh traders ko confirmatory signals aur doosre technical indicators ki tajziya karna chahiye. Maslan, agar Tri Star Pattern ke appearance ke sath-sath RSI indicator bhi overbought ya oversold territory mein dikhata hai, toh yeh trend reversal ki tasdeeq karne mein aur mukhtalif signals ko confirm karne mein madadgar ho sakta hai.
Isi tarah, MACD aur moving averages bhi trend reversals aur market directions ka andaza lagane mein madadgar ho sakte hain. Jab Tri Star Pattern ka appearance hota hai, toh traders ko in doosre indicators ki madad se bhi market ki movements ko samajhna chahiye aur sahi trading decisions lena chahiye.
Tri Star Pattern ka appearance ek potential trend reversal ka indication hota hai, lekin iski tasdeeq aur confirmations ke liye traders ko doosre indicators aur price action patterns ki tajziya karna chahiye. Yeh mukhtalif tools aur techniques ko mila kar traders ko sahi trading decisions lene mein madad dete hain.- Tri Star Pattern Aur Trend Reversals
Tri Star Pattern trend reversals ko pehchanne mein madadgar sabit ho sakta hai. Jab market mein trend reversal hone ka indication milta hai, to traders ko apni positions ko adjust karne aur naye trends ko shuru karne ka faida uthana chahiye.
Trend reversals market ke dynamics mein significant changes la sakte hain aur traders ko naye trading opportunities provide kar sakte hain. Tri Star Pattern ka appearance ek potential trend reversal ki nishani ho sakti hai, lekin iski tasdeeq aur confirmations ke liye traders ko doosre indicators aur price action patterns ki madad leni chahiye.
Trend reversals ko pehchanne aur un par react karne ke liye traders ko market ki movements ko closely monitor karna chahiye aur sahi trading decisions lena chahiye. Iske saath hi, risk management ka bhi khas khayal rakha jana chahiye taake nuksan se bacha ja sake.
- Tri Star Pattern Aur Risk Management
Tri Star Pattern ka istemal kar ke traders apni risk management ko bhi behtar bana sakte hain. Is pattern ki madad se traders apne stop loss aur take profit levels ko sahi tareeqay se set kar sakte hain, taake nuksan se bacha ja sake.
Jab bhi Tri Star Pattern ka appearance hota hai, toh traders ko apni risk management strategy ko bhi review karna chahiye. Stop loss aur take profit levels ko set karne ke saath saath, position sizing aur leverage ka bhi khas khayal rakha jana chahiye taake nuksan se bacha ja sake.
Risk management trading ka ek ahem hissa hai aur isko samajh kar sahi tareeqay se implement karna traders ke liye zaroori hai. Tri Star Pattern ka istemal kar ke traders apni risk management ko behtar bana sakte hain aur apni trading performance ko improve kar sakte hain.
- Tri Star Pattern Ki Mumkin Falsafah
Tri Star Pattern ki mumkin falsafah ko samajhna traders ke liye zaroori hai. Kabhi-kabhi market mein false signals bhi aate hain, isliye traders ko mukhtalif indicators aur price action ko mila kar tafsili tajziya karna chahiye.
Jab bhi Tri Star Pattern ka appearance hota hai, toh traders ko confirmatory signals aur doosre technical indicators ki madad se market ki movements ko samajhna chahiye. False signals ko pehchanne aur un par react karne ke liye traders ko patience aur discipline ka bhi istemal karna chahiye.
False signals se bachne ke liye traders ko apni analysis ko mazeed tasdeeq karne aur confirmatory signals ka wait karna chahiye. Iske saath hi, risk management ka bhi khas khayal rakha jana chahiye taake nuksan se bacha ja sake.
- Tri Star Pattern Ka Istemal
Tri Star Pattern ka istemal sirf doosre indicators ke saath kiya jana chahiye. Is pattern ko individually istemal karne se behtar hai ke traders doosre technical tools aur analysis methods ko bhi shamil karein, taake sahi aur mufeed nateejay hasil kiye ja sakein.
Tri Star Pattern ka appearance ek potential trend reversal ka indication ho sakta hai, lekin iski tasdeeq aur confirmations ke liye traders ko doosre indicators aur price action patterns ki madad leni chahiye. Iske saath hi, sahi entry aur exit points ka bhi intikhab karna zaroori hai.
Tri Star Pattern ko samajhne aur sahi istemal karne ke liye traders ko patience aur discipline ka istemal karna chahiye. Is pattern ko samajh kar traders apni trading strategy ko improve kar sakte hain aur market ki movements ko behtar tareeqay se samajh sakte hain.
- Tri Star Pattern Mein Trading Strategy
Tri Star Pattern ko samajh kar traders apni trading strategy ko improve kar sakte hain. Is pattern ko samajhne ke baad traders apni entry aur exit points ko behtar tareeqay se set kar sakte hain, aur market trends ko sahi tareeqay se samajh sakte hain.
Tri Star Pattern ka appearance ek potential trading opportunity ho sakta hai, lekin isko samajhne aur sahi tareeqay se istemal karne ke liye traders ko mukhtalif indicators aur price action patterns ko bhi shamil karna chahiye. Iske saath hi, risk management ka bhi khas khayal rakha jana chahiye taake nuksan se bacha ja sake.
Trading strategy ko improve karne aur behtar performance hasil karne ke liye traders ko market ki movements ko closely monitor karna chahiye aur sahi trading decisions lena chahiye. Iske saath hi, learning aur practice ka bhi khas khayal rakha jana chahiye taake trading skills ko mazeed behtar banaya ja sake.
- Tri Star Pattern Ki Mehfoozat
Tri Star Pattern ko samajh kar trading ki mehfoozat ko barqarar rakhna zaroori hai. Jab bhi Tri Star Pattern ka appearance hota hai, toh traders ko market ki movements ko closely monitor karna chahiye aur confirmatory signals ki talash mein rehna chahiye.
Trading ki mehfoozat ko barqarar rakhne ke liye traders ko apni risk management ko bhi behtar banana chahiye. Stop loss aur take profit levels ko sahi tareekay se set karke, aur position sizing ka bhi khas khayal rakha jana chahiye. Iske saath hi, market ki movements ko samajhne aur sahi tareeqay se react karne ke liye traders ko patience aur discipline ka bhi istemal karna chahiye.
mathematica
Copy code
Tri Star Pattern ki madad se traders apni trading strategies ko behtar bana sakte hain aur market trends ko sahi tareeqay se samajh sakte hain. Is pattern ko samajh kar traders apni trading performance ko improve kar sakte hain aur consistent profits hasil kar sakte hain. Trading ki mehfoozat ko barqarar rakhne ke liye traders ko market ki movements ko closely monitor karna chahiye aur apne trading plan ke mutabiq action lena chahiye. Iske saath hi, learning aur practice ka bhi khas khayal rakha jana chahiye taake trading skills ko mazeed behtar banaya ja sake.
15. Aakhri Khyal
mathematica
Copy code
Aakhri khyal mein, Tri Star Candlestick Pattern forex trading mein ek ahmiyat rakhta hai jo traders ko market trends aur reversals ko pehchanne mein madad deta hai. Isko samajhna aur sahi tajziya karna traders ke liye zaroori hai, aur iske saath sahi risk management aur trading strategies ka istemal karna bhi zaroori hai. Tri Star Pattern ka appearance ek potential trading opportunity ho sakta hai, lekin isko samajhne aur sahi tareeqay se istemal karne ke liye traders ko patience, discipline, aur tafseelat se ghor karna chahiye. Iske saath hi, learning aur practice ka bhi khas khayal rakha jana chahiye taake trading skills ko mazeed behtar banaya ja sake. Aakhri tor par, Tri Star Candlestick Pattern ko samajh kar traders apni trading performance ko improve kar sakte hain aur consistent profits hasil kar sakte hain. Iske istemal ke saath, traders ko market ki movements ko closely monitor karna aur sahi tareeqay se react karna chahiye, taake trading journey mein kamiyabi hasil ki ja sake. -
AbjabbarSenior Member
- Sep 2022
- 637
- 666
- 478
- 336 USD
Forex Trading Mein Tri Star Candlestick Pattern()()()()
Tri Star candlestick pattern Forex trading mein ek rare aur unique reversal pattern hai jo significant market reversals ko indicate karta hai. Yeh pattern generally do types ka hota hai: bullish tri star aur bearish tri star.
Forex Trading Mein Tri Star Candlestick Pattern Ki Detail()()()()
Bullish Tri Star Pattern- Formation: Yeh pattern tab form hota hai jab continuous downtrend ke baad teen Doji candles ek ke baad ek banati hain.
- Position: Pahli Doji candle ek downtrend mein banti hai, dusri Doji candle pahli Doji se thodi lower ya equal level pe banti hai (kya middle Doji hoti hai), aur third Doji candle middle Doji se thodi higher ya equal level pe banti hai.
- Interpretation: Yeh pattern indicate karta hai ki downtrend khatam hone wala hai aur uptrend shuru ho sakta hai. Iska significance isliye zyada hota hai kyunki Doji candles market ke indecision ko indicate karti hain aur jab teen Doji candles ek sequence mein banti hain, toh yeh market mein significant reversal ka signal deti hain.
- Formation: Yeh pattern tab form hota hai jab continuous uptrend ke baad teen Doji candles ek ke baad ek banati hain.
- Position: Pahli Doji candle ek uptrend mein banti hai, dusri Doji candle pahli Doji se thodi higher ya equal level pe banti hai (kya middle Doji hoti hai), aur third Doji candle middle Doji se thodi lower ya equal level pe banti hai.
- Interpretation: Yeh pattern indicate karta hai ki uptrend khatam hone wala hai aur downtrend shuru ho sakta hai. Iska significance isliye zyada hota hai kyunki Doji candles market ke indecision ko indicate karti hain aur jab teen Doji candles ek sequence mein banti hain, toh yeh market mein significant reversal ka signal deti hain.
Key Characteristics- Doji Candles: Doji candle wo candle hoti hai jahan opening aur closing price almost same hoti hai, indicating indecision in the market.
- Reversal Signal: Tri Star pattern strong reversal signal hota hai, but kyunki yeh rare pattern hai, traders isse dekh ke cautious approach rakhte hain.
- Volume Confirmation: Volume ka analysis bhi zaroori hai. High volume ke saath Tri Star pattern ka formation aur bhi significant ho jata hai.
Tri Star pattern ko identify karne ke baad traders confirmatory signals ka intezar karte hain jaise ki volume confirmation ya other technical indicators (like RSI, MACD) ke signals ko dekhna. Yeh pattern ko support aur resistance levels ke saath bhi analyse kiya jata hai for better accuracy.
In conclusion, Tri Star candlestick pattern ek powerful reversal indicator ho sakta hai agar correctly identify aur confirm kiya jaye with additional technical analysis. -
NaveedeagleSenior Member
- Jul 2024
- 647
- 1
- 10
- 153 USD
Tri Star Candlestick Pattern
Tri Star Candlestick Pattern Ka Taaruf
Tri Star candlestick pattern ek rare aur powerful reversal pattern hai jo market ke trend reversal ko indicate karta hai. Ye pattern teen consecutive days par banata hai aur har din ek specific type ke candlestick ke combination se milkar banta hai. Ye pattern market ke peak par banta hai, jab market bearish trend mein hoti hai, ya phir market ke bottom par banta hai, jab market bullish trend mein hoti hai.
Pattern Ki Shakal
Tri Star pattern mein teen candles hoti hain:
Pehli Candle: Ye candle ek long-bodied candle hoti hai jo clear bullish (green) ya bearish (red) trend ko show karti hai. Ye candle market ke trend ko indicate karti hai.
Doosri Candle: Ye candle ek very small-bodied candle hoti hai jo pehli candle ke close ke aas-paas ya uske andar close hoti hai. Is candle ko "doji" ya "spinning top" kehte hain. Ye candle market mein indecision ko dikhati hai aur trend reversal ke signs deti hai.
Teesri Candle: Ye candle bhi ek long-bodied candle hoti hai lekin iski color pehli candle ke color ke opposite hoti hai. Agar pehli candle bullish thi, to teesri candle bearish hogi, aur agar pehli candle bearish thi, to teesri candle bullish hogi. Ye candle market ke trend reversal ko confirm karti hai.
Pattern Ki Pehchan Aur Interpretations
Trend Reversal Indicator: Tri Star pattern aksar trend reversal ka signal hota hai. Agar ye pattern bullish trend ke end par banta hai, to ye bearish reversal ko indicate karta hai. Agar ye pattern bearish trend ke end par banta hai, to ye bullish reversal ko indicate karta hai.
Market Condition: Tri Star pattern tab effective hota hai jab market strong trend ke phase mein hoti hai. Iska matlab hai ke ye pattern ko tab dekhna chahiye jab market kisi clear trend mein ho, chahe wo bullish ho ya bearish.
Volume Analysis: Tri Star pattern ki confirmation ke liye volume analysis bhi zaroori hai. Agar teesri candle ke formation ke dauran volume bhi high hai, to pattern ki strength aur reliability badh jati hai. Low volume ke saath pattern ka formation kam reliable hota hai.
Example Aur Practical Application
Bullish Tri Star: Agar aap ek bullish trend ke end par ek Tri Star pattern dekhte hain, to is pattern ki pehli candle ek strong bullish candle hoti hai. Doosri candle ek small-bodied candle hoti hai jo indecision ko show karti hai. Teesri candle ek long-bodied bearish candle hoti hai jo trend reversal ko confirm karti hai. Is pattern ke baad market mein bearish trend start ho sakta hai.
Bearish Tri Star: Agar aap ek bearish trend ke end par ek Tri Star pattern dekhte hain, to is pattern ki pehli candle ek strong bearish candle hoti hai. Doosri candle ek small-bodied candle hoti hai jo indecision ko show karti hai. Teesri candle ek long-bodied bullish candle hoti hai jo trend reversal ko confirm karti hai. Is pattern ke baad market mein bullish trend start ho sakta hai.
Conclusion
Tri Star candlestick pattern ek useful tool hai jo traders ko market ke potential reversal points ko identify karne mein madad karta hai. Lekin, kisi bhi trading strategy ki tarah, Tri Star pattern ko bhi alone rely nahi karna chahiye. Is pattern ko confirm karne ke liye aapko other technical indicators aur market conditions ka bhi analysis karna chahiye. Yeh pattern trade decisions ko enhance karne ke liye ek valuable addition ho sakta hai, lekin trading decisions ko diverse tools aur strategies ke saath combine karna chahiye taake aapki trading strategy robust aur reliable ho........
-
Sumi2193Senior Member
- Mar 2024
- 570
- 27
- 21
- 169 USD
TRI-STAR CANDLESTICK PATTERN
Explain Tri-star candlestick pattern:
As salam o alaikum dosto, Tri-Star candlestick pattern ik rare lekin powerful reversal pattern hy jo traders ko potential trend reversal ke signals provide karta hy. Ye pattern typically trend ki ik strong reversal ko darust karta hy jab market ik strong uptrend ya downtrend se change hone ki sambhavna hoti hy.Tri-Star pattern ik powerful reversal pattern hy jo traders ko potential trend reversals ke bare main signals provide karta hy. Iska istemal karke traders apne trading strategies ko improve kar sakte hain lekin iske sath sath, risk management or dusre confirmatory indicators ka bhi istemal karna zaroori hy. Trading main safalta hasil karne ke liye, ik holistic approach or constant learning ki zarurat hoti hy. Tri-Star candlestick pattern teen mukhtalif candlesticks se mushkilat ka muqablah karta hy. Har candlestick, ik makhsoos arq hy jo ke market ke mizaj ko darust dhang se darust darust karta hy. Tri-Star pattern ka pehla candlestick, market main tezi ko darust karti hy. Doosra candlestick, ik choti se range main ghira hota hy or tezi ko rokta hy. Teesra candlestick, doosre candlestick ki opposite direction main hoti hy or market main tijarat main kami hone ka ishara karti hy.Tri-Star pattern ka istemal karke traders market ki mawafiqat ko samajhne ka maqsad hasil karte hain. Is pattern ko pehchan'na, achi training or tajarbay ki zaroorat hoti hy take traders isey behtareen tor par samajh sakein or faida utha sakein.
Identification of Tri-Star Candlestick Pattern:
Dear traders, Tri-Star pattern teen consecutive candlesticks se milta hy jinke opening or closing prices ik jaisi hoti hain. Ye teen candlesticks ik tight range main trade karte hain, jise ik trikona ya star shape se compare kiya jata hy. Is pattern ke teen parts hote hain:- First Candlestick: First candlestick ik chhota sa doji hota hy jiska matlab hy ke opening or closing price apas main barabar hoti hain.
- Second Candlestick: Second candlestick bhi doji hoti hy or first ki tarah tight range main trade hoti hy.
- Third Candlestick: Third candlestick bhi doji hoti hy or first doji ke beech main ati hy. Is candlestick ka closing price first doji ke opening or closing prices ke darmiyan hota hy.
Tri-Star Candlestick Pattern Analysis:
Dear forex members, Tri-Star pattern ko analyze karne ke liye traders ko market conditions or doosre technical indicators ka bhi khayal rakhna zaroori hy. Kuch key points hain jo traders tri-star pattern ke sath combine karke market analysis karte hain:- Range-Bound Market: Tri-Star pattern mostly range-bound market conditions ko darust karta hy, jahan par price main kisi specific direction main movement nahi ho rahi hoti. Is pattern ko dikh kar traders samajh sakte hain ke market main indecision hy.
- Potential Reversal Indicator: Tri-Star pattern potential trend reversal ko bhi darust karta hy. Agar ye pattern downtrend ke bad ata hy, toh ye bullish reversal ko indicate karta hy, jabke agar uptrend ke bad ata hy, toh ye bearish reversal ko darust karta hy.
- Confirmation Tools: Tri-Star pattern ko confirm karne ke liye traders doosre technical indicators ka istemal karte hain. Moving averages, support or resistance levels, or trend lines ke sath combine karke ye pattern ko confirm kiya ja sakta hy.
-
MyselfSenior Member
- Apr 2023
- 258
- 140
- 92
- 67 USD
Introduction
Assalamu alaikum
Friend friends kaise ho ji ho Gaye yakin karta hai main Apne topic ko batana chahta hun aap logon se aur yah 3 star candle ke bare mein aapko karna chahta hun,
Explain the three-star candlestick pattern:
dost, Tri-Star candlestick pattern ik rare lekin powerful reversal pattern hy yes traders ko potential trend reversal to signals provide hy card. Ye pattern typically trend ki ik strong reversal ko darust card hy strike market ik strong uptrend ya downtrend se change chase ki sambhavna hoti hy.Tri-Star pattern ik strong reversal pattern hy yes traders ko potential trend reversals ke bare main signals provide hy card. Iska istemal karke traders apne trading strategies ko improve kar sakte hain lekin iske sath sath, risk management or dusre confirming indicators ka bhi istemal karna zaroori hy. Main business safalta hasil karne ke liye, ik holistic approach or continuous learning ki zarurat hoti hy. Tri-Star candlestick pattern teen mukhtalif candlesticks se mushkilat ka muqablah card hy. Har candlestick, ik makhsoos arq hy jo ke market ke mizaj ko darust dhang se darust darust karta hy. Tri-Star pattern ka pehla candlesticks, market main tezi ko darust cards hy. Doosra candle, ik choti se range main ghira hota hy or tezi ko rokta hy. Teesra candlestick, doosre candlestick ki opposite direction main hoti hy or main market tijarat main kami hone ka ishara karti hy.Tri-Star pattern ka istemal karke traders market ki mawafiqat ko samajhne ka maqsad hasil karte hain. Is pattern ko pehchan'na, achi training or tajarbay ki zaroorat hoti hy take traders isey behtareen tor par samajh sakein or faida utha sakein.
Identifying the Tri-Star Candlestick Pattern:
Dear Traders, Tri-Star pattern teenage candlesticks se milta hy jinke opening or closing prices ik jaisi hoti hain. Ye teen candlesticks ik narrow range main trading card hain, jise ik trikona ya star shape with comparison kiya jata hy. Is the pattern for teenage works popular:
First candlestick: First candlestick ik chhota sa doji hota hy jiska matlab hy to the opening or closing price apas main barabar hoti hain.
Second candlestick: Second candlestick bhi doji hoti hy or first ki tarah narrow range of hoti hy main trade.
Third candlestick: Third candlestick bhi doji hoti hy or first doji ke buk main ati hy. It is candlestick ka closing price first doji to opening or closing price ke darmiyan hota hy.
Tri-Star Candlestick Pattern Analysis:
Dear forex members, Tri-Star pattern ko analyzes karne ke liye traders ko market conditions or doosre technical indicators ka bhi khayal rakhna zaroori hy. Kuch key points hain jo traders tri-star pattern ke sath combine karke market analysis karte hain:
Range-Bound Market: Tri-Star pattern mostly range-bound market conditions ko darust karta hy, jahan par price main kisi specific direction main movement nahi ho rahi hoti. Is pattern ko dikh kar traders samajh sakte hain to market main indecision hy.
Potential Reversal Indicator:
Potential trend change of the Tri-Star ko bhi darust karta hy pattern. Agar ye pattern downtrend ke bad ata hy, toh ye bullish reversal ko indicate card hy, jabke agar uptrend ke bad ata hy, toh ye bearish reversal ko darust card hy.
Confirmation tools: Tri-Star pattern ko confirm karne ke liye traders doosre technical indicators ka istemal karte hain. Moving averages, support or resistance levels or trend lines ke sath combine karke ye pattern ko confirm kiya ja sakta hy. -
Sajjad5Senior Member
- May 2024
- 143
- 28
- 12
- 31 USD
Tri star candlestick pattern
Tri Star candlestick pattern aik rare aur powerful reversal pattern hai jo aam tor par market ke top ya bottom par banta hai. Yeh pattern 3 consecutive Doji candles se mil kar banta hai aur yeh bullish ya bearish reversal signal de sakta hai. Aayiye iske baray mein tafseelan samajhte hainTri Star Candlestick PatternStructure
-3 Doji Candles: Yeh pattern 3 Doji candles par mushtamil hota hai. Doji candles wo hoti hain jahan opening aur closing price lagbhag barabar hoti hai, jo market ki indecision ko zahir karti hain.
-Location: Yeh pattern ya to market ke top (Bullish Tri Star) ya bottom (Bearish Tri Star) par banta hai.
Types
1. Bullish Tri Star
-Formation: Market ke bottom par 3 Doji candles banti hain.
- Indication: Yeh pattern market ke bottom par form hone ke baad bullish reversal ka signal deta hai, yani market ke girawat ke baad upar jane ka imkaan hota hai.
- Characteristics:
- Pehli Doji candle ek downtrend mein banti hai.
- Doosri Doji candle pehli ke neechay ya usi level par banti hai.
- Teesri Doji candle doosri candle ke baad banti hai, jo bullish reversal ka strong signal deti hai.
2. Bearish Tri Star
-Formation: Market ke top par 3 Doji candles banti hain.
- Indication: Yeh pattern market ke top par form hone ke baad bearish reversal ka signal deta hai, yani market ke utar chadhav ke baad girawat ka imkaan hota hai.
- Characteristics**:
- Pehli Doji candle ek uptrend mein banti hai.
- Doosri Doji candle pehli ke upar ya usi level par banti hai.
- Teesri Doji candle doosri candle ke baad banti hai, jo bearish reversal ka strong signal deti hai.
Interpretation aur Usage
- Confirmation**: Tri Star pattern ke baad confirmation ka intezar zaroori hota hai, jese ke agle din ki candle ek strong move ke saath band ho, taake reversal signal confirm ho sake.
- Volume Analysis**: Volume analysis bhi zaroori hai, kyun ke high volume par bante hue patterns ziada reliable hote hain.
- Risk Management**: Tri Star pattern ke saath trading karte waqt risk management ka khayal rakhna zaroori hai, jese ke stop loss aur position sizing.
Conclusion
Tri Star candlestick pattern ek rare magar powerful reversal pattern hai jo trend reversal ka strong signal deta hai. Is pattern ka sahi interpretation aur confirmation aapki trading strategy ko significant edge de sakta hai. Lekin, hamesha yaad rakhen ke koi bhi trading pattern 100% accurate nahi hota, isliye risk management aur doosre technical analysis tools ka istemal zaroori hai.
-
mabdulrehmanSenior Member
- Jul 2024
- 2506
- 24
- 45
- 460 USD
Tri Star Candlestick Pattern: Ek Mukhtasir Jaiza
Muqaddama
Candlestick patterns technical analysis ka ek ahm hissa hain jo traders ko market trends aur potential reversals ko identify karne mein madad dete hain. In patterns mein se ek Tri Star candlestick pattern hai jo bohot hi rare aur powerful reversal signal mana jata hai. Is article mein hum Tri Star candlestick pattern ko briefly explain karenge aur iske istimaal ka tareeqa samjhenge.
Tri Star Candlestick Pattern Kya Hai?
Tri Star candlestick pattern ek reversal pattern hai jo market ke uptrend ya downtrend ke baad appear hota hai. Ye pattern 3 consecutive Doji candles se mil kar banta hai. Doji candles wo hoti hain jahan open aur close prices almost equal hoti hain, jo market ke indecision ko indicate karti hain.
Types of Tri Star Patterns- Bullish Tri Star: Bullish Tri Star pattern typically downtrend ke baad appear hota hai aur potential bullish reversal ko indicate karta hai. Is pattern mein:
- Pehli Doji candle downtrend ko continue karti hai.
- Doosri Doji candle pehli candle ke near close hoti hai.
- Teesri Doji candle doosri candle ke near close hoti hai aur downtrend ke end ko indicate karti hai.
- Bearish Tri Star: Bearish Tri Star pattern typically uptrend ke baad appear hota hai aur potential bearish reversal ko indicate karta hai. Is pattern mein:
- Pehli Doji candle uptrend ko continue karti hai.
- Doosri Doji candle pehli candle ke near close hoti hai.
- Teesri Doji candle doosri candle ke near close hoti hai aur uptrend ke end ko indicate karti hai.
Tri Star Pattern Ka Istemaal- Pattern Identification: Tri Star pattern ko identify karna important hai. Iske liye traders ko 3 consecutive Doji candles ko dekhna hota hai jo downtrend ya uptrend ke baad appear hoti hain. Pattern ki confirmation ke liye volume aur price action ko bhi analyze karna zaroori hai.
- Entry aur Exit Points: Jab Bullish Tri Star pattern form hota hai, toh buy signal generate hota hai aur traders entry ke liye prepare hote hain. Similarly, jab Bearish Tri Star pattern form hota hai, toh sell signal generate hota hai aur traders exit ya short-selling ke liye prepare hote hain.
- Stop Loss aur Take Profit: Har trading strategy mein stop loss aur take profit levels ko define karna zaroori hota hai. Tri Star pattern ke liye traders previous support aur resistance levels ko consider karte hain taake apne risk ko effectively manage kar sakein.
Tri Star Pattern Ki Limitations- Rarity: Tri Star pattern bohot rare hota hai aur market mein kam nazar aata hai. Is pattern ki rarity ki wajah se iski identification aur confirmation mushkil ho sakti hai.
- False Signals: Kabhi kabhi Tri Star pattern false signals generate kar sakta hai, khas tor par volatile markets mein. Isliye inko confirmatory indicators ke saath use karna important hota hai.
Conclusion
Tri Star candlestick pattern ek rare aur powerful reversal signal hai jo market trends aur potential reversals ko identify karne mein madad karta hai. Is pattern ko sahi tarah se samajh kar aur confirmatory indicators ke saath use karke traders apne trading decisions ki accuracy ko improve kar sakte hain. Har trader ke liye zaroori hai ke wo Tri Star pattern ko recognize karne mein maharat hasil kare taki wo market movement ko better anticipate kar sake aur profitable trading decisions le sake.
-
HealthSenior Member
- Mar 2024
- 1987
- 70
- 73
- 795 USD
**Tri Star Candlestick Pattern Kya Hai?**
Tri Star candlestick pattern forex aur stock trading mein ek important technical analysis tool hai jo market reversal aur trend changes ko identify karne mein madad karta hai. Yeh pattern teen candlesticks par mabni hota hai aur market ki indecision aur potential reversal points ko indicate karta hai. Is post mein hum Tri Star candlestick pattern ki detail samjhenge, iski types aur trading implications ko discuss karenge.
### Tri Star Candlestick Pattern Ki Definition
Tri Star candlestick pattern teen consecutive candlesticks par based hota hai jo market ke indecision aur potential reversal ko signal karte hain. Yeh pattern do major types mein divide kiya ja sakta hai: **Bullish Tri Star** aur **Bearish Tri Star**. Dono types market ke different scenarios aur potential trend reversals ko indicate karte hain.
### Bullish Tri Star Pattern
Bullish Tri Star pattern tab develop hota hai jab market ek downtrend mein hoti hai aur teen consecutive candlesticks pattern ko form karti hain. Is pattern ki characteristics hain:
1. **First Candlestick:** Pehli candlestick strong bearish (red) hoti hai jo trend continuation ko indicate karti hai.
2. **Second Candlestick:** Doosri candlestick ek small body ke sath hoti hai jo indecision ko show karti hai. Is candlestick ka open aur close price almost same hota hai.
3. **Third Candlestick:** Teesri candlestick strong bullish (green) hoti hai jo previous downtrend ko reverse karti hai. Yeh candlestick price ko upward direction mein push karti hai.
**Significance:** Bullish Tri Star pattern market ke bottom par form hota hai aur potential uptrend ya buying opportunity ko indicate karta hai. Jab yeh pattern develop hota hai, to traders potential reversal aur market ki upward movement ke signals ko dekhte hain.
### Bearish Tri Star Pattern
Bearish Tri Star pattern tab develop hota hai jab market ek uptrend mein hoti hai aur teen consecutive candlesticks pattern ko form karti hain. Is pattern ki characteristics hain:
1. **First Candlestick:** Pehli candlestick strong bullish (green) hoti hai jo trend continuation ko indicate karti hai.
2. **Second Candlestick:** Doosri candlestick ek small body ke sath hoti hai jo indecision ko show karti hai. Is candlestick ka open aur close price almost same hota hai.
3. **Third Candlestick:** Teesri candlestick strong bearish (red) hoti hai jo previous uptrend ko reverse karti hai. Yeh candlestick price ko downward direction mein push karti hai.
**Significance:** Bearish Tri Star pattern market ke top par form hota hai aur potential downtrend ya selling opportunity ko indicate karta hai. Jab yeh pattern develop hota hai, to traders potential reversal aur market ki downward movement ke signals ko dekhte hain.
### Trading Implications
1. **Confirmation:** Tri Star pattern ko trading decisions ke liye confirmatory signals ke roop mein use kiya jata hai. Pattern ki confirmation ke liye, traders ko third candlestick ke completion aur previous trend ki reversal ko dekhna zaroori hota hai.
2. **Risk Management:** Tri Star pattern ko trading decisions mein include karne se pehle risk management strategies implement karna zaroori hai. Stop-loss aur take-profit levels ko set karke potential losses aur profits ko manage kiya ja sakta hai.
3. **Combine with Other Indicators:** Tri Star pattern ko dusre technical indicators ke sath combine karke trading decisions ko enhance kiya ja sakta hai. RSI, MACD, aur moving averages jaise indicators pattern ke signals ko validate karne mein madadgar hote hain.
### Conclusion
Tri Star candlestick pattern forex aur stock trading mein market reversal aur trend changes ko identify karne ke liye important hai. Bullish aur Bearish Tri Star patterns market ke different scenarios ko indicate karte hain aur potential buying aur selling opportunities ko highlight karte hain. Pattern ki confirmation aur risk management ke sath, traders accurate trading decisions le sakte hain aur market movements ko effectively capitalize kar sakte hain. Technical analysis tools aur indicators ke combination se aap apne trading strategies ko enhance kar sakte hain aur market trends ko better predict kar sakte hain.
-
ShokeenSenior Member
- Mar 2024
- 2292
- 67
- 103
- 876 USD
### Tri Star Candlestick Pattern
Tri Star Candlestick Pattern ek significant reversal pattern hai jo traders ko market ke potential reversal points ki pehchan karne mein madad karta hai. Yeh pattern aksar bullish ya bearish trend ke end par dikhai deta hai, aur isay teen consecutive candlesticks ke zariye identify kiya jata hai.
**Pattern Ki Pehchan:**
Tri Star pattern mein teen candlesticks hoti hain. Pehli aur teesri candlestick ek jaisi hoti hain, jo zyada tar do doji candlesticks hoti hain, jabke beech ki candlestick ek opposite color ki hoti hai. Yeh pattern market ke uncertainty aur indecision ko darshata hai.
1. **Pehli Candlestick:** Yeh aksar bullish ya bearish trend ke dauran hoti hai aur yeh ek strong body ke sath hoti hai.
2. **Doosri Candlestick:** Yeh ek doji hoti hai, jo ke market ke indecision ko darshati hai. Is candlestick ka open aur close price barabar hota hai, jo yeh darshata hai ke na buyers na sellers dominate kar rahe hain.
3. **Teesri Candlestick:** Yeh bhi ek doji hoti hai, lekin yeh pehli candlestick ke opposite color ki hoti hai. Yeh bullish pattern ke liye bearish color aur bearish pattern ke liye bullish color mein hoti hai.
**Trading Strategy:**
Tri Star pattern ko samajhne ke liye, sab se pehle yeh zaroori hai ke is pattern ki confirmation ho. Jab teesri candlestick ban jati hai, to traders ko dekna hota hai ke kya price us candlestick ki high ya low ko todta hai. Agar price high ko todta hai, to yeh bullish confirmation hota hai. Is waqt traders ko buying position lena chahiye. Agar price low ko todta hai, to yeh bearish confirmation hota hai, aur traders ko selling position lena chahiye.
**Volume Ka Role:**
Volume bhi is pattern ki confirmation mein important hota hai. Agar volume teesri candlestick ke breakout ke waqt barhta hai, to yeh signal zyada strong hota hai. Is se yeh pata chalta hai ke market mein traders ki interest badh rahi hai.
**Combination with Other Indicators:**
Tri Star pattern ko dusre technical indicators ke sath istemal karna behtar hota hai. Jaise RSI ya MACD, yeh aapko additional confirmation de sakte hain aur trading decisions ko behtar bana sakte hain.
**Aakhir Mein:**
Tri Star Candlestick Pattern ek valuable tool hai jo traders ko market ke reversal points ko samajhne mein madad karta hai. Is pattern ka sahi istemal aur confirmation ke sath trading decisions lena aapko market mein successful banane mein madad karega. Trading mein hamesha analysis aur research zaroori hai, is liye in patterns ko samajhne ka waqt nikalein.
-
Amir07Senior Member
- Aug 2024
- 1361
- 160
- 66
- 319 USD
Tri Star candlestick pattern ek khas technical analysis tool hai jo traders ko market ke mood ko samajhne mein madad karta hai. Ye pattern teen consecutive candlesticks ke combination se bana hota hai aur iska istemal price reversal ke signals ko identify karne ke liye kiya jata hai.
Tri Star pattern ka pehla candlestick ek strong trend ki taraf hota hai. Ye ya to bullish (upar ki taraf) ya bearish (neeche ki taraf) trend ho sakta hai. Iske baad, doosra candlestick ek choti si body ke saath ek doji candlestick hota hai. Doji candlestick ka matlab hota hai ke market mein uncertainty hai aur buyers aur sellers ke beech balance bana hua hai. Doji ki body chhoti hoti hai aur shadow ya wicks zyada hoti hain, jo is baat ka indication deti hain ke market mein kisi decisive movement ki kami hai.
Teeja candlestick, jo ke pattern ka last part hota hai, pehle do candlesticks ki direction ke opposite hota hai. Agar pehla candlestick bullish tha aur doosra doji tha, to teesra candlestick bearish hoga, aur agar pehla candlestick bearish tha aur doosra doji tha, to teesra candlestick bullish hoga. Is combination se ye pata lagta hai ke market ek reversal point par hai.
Tri Star pattern ko identify karna thoda mushkil ho sakta hai, lekin agar ye pattern ban jaye to traders isse ek strong signal ke tor par le sakte hain. Ye pattern aksar market mein ek significant change ki taraf ishaara karta hai, aur traders ise apne trading strategies mein include kar sakte hain.
Is pattern ki reliability tab aur barh jati hai jab ye ek strong trend ke baad ban jaye, aur jab iske sath volume bhi significant ho. Volume ka increase is baat ka indication hota hai ke market participants ka interest badh raha hai aur trend change hone ka waqt aa gaya hai.
Tri Star pattern ka analysis karte waqt traders ko dhyan rakhna chahiye ke ye sirf ek signal hai aur market ki overall conditions ko bhi consider karna chahiye. Dusre technical indicators aur fundamental analysis ko bhi include karna zaroori hai taake trading decisions ko aur bhi accurate banaya ja sake.
Ye pattern apne simplicity ke bawajood kaafi effective ho sakta hai, lekin hamesha isse confirmation ke saath use karna chahiye. Agar pattern ban gaya hai aur market ke sath confirmatory signals bhi mil rahe hain, to phir ye ek accha opportunity ho sakti hai trade karne ke liye. Overall, Tri Star candlestick pattern ek useful tool hai jo market ki changing dynamics ko samajhne mein madad kar sakta hai
-
<a href="https://www.instaforex.org/ru/?x=ruforum">InstaForex</a> -
Jugnoo923Senior Member
- Jan 2024
- 1728
- 1212
- 435
- 746 USD
Tri Star candlestick pattern ek ahem technical analysis tool hai jo trading aur investing mein madadgar hota hai. Yeh pattern, jaise ke naam se hi zahir hai, teen stars yaani teen chhoti candlesticks se milkar banta hai. Yeh pattern market ki trend reversal ki ishaarat deta hai aur traders isay market ki direction samajhne ke liye use karte hain.
Tri Star pattern ko samajhne ke liye pehle yeh samajhna zaroori hai ke candlestick patterns kya hote hain. Candlestick chart ek trading chart hai jo ek specific time period ke dauran market ki price movement ko dikhata hai. Har candlestick ke paas ek open price, close price, high price, aur low price hoti hai. Tri Star pattern teen consecutive candlesticks se milkar banta hai jinki characteristics specific hoti hain.
Tri Star pattern ka pehla candlestick ek strong trend ke baad hota hai. Yeh ek trend reversal ka sign hota hai aur iska body bada hota hai. Iske baad, second candlestick ek chhoti body ke saath hoti hai aur yeh pehli candlestick ke comparison mein relatively neutral hoti hai. Yeh chhoti body pattern ke centre mein hoti hai aur iska open aur close price close hote hain. Yeh indicate karta hai ke market ek indecisive phase mein hai aur buying aur selling pressure ke beech equilibrium ban gaya hai.
Teesra candlestick bhi chhoti body ka hota hai aur iski position bhi second candlestick ke close price ke aas paas hoti hai. Yeh pattern ke conclusion ka sign hota hai aur market ki direction ko finalize karta hai. Teesra candlestick ka close price bhi pehli aur dusri candlestick ke close price ke aas paas hota hai, jo ke market ke trend reversal ka indication hai.
Tri Star pattern ko samajhne ke liye market ke overall context ko dekhna zaroori hai. Agar yeh pattern ek strong uptrend ya downtrend ke baad develop hota hai, to yeh trend reversal ka strong signal hota hai. Yeh pattern ek short-term reversal ki taraf ishaarat karta hai aur isay other technical indicators ke sath combine karke zyada accurate trading signals hasil kiye ja sakte hain.
Tri Star pattern ko use karte waqt traders ko caution ki zaroorat hoti hai. Yeh pattern kabhi-kabhi false signals bhi generate kar sakta hai, isliye isay other confirmation tools ke sath validate karna zaroori hai. Is pattern ko trade karte waqt market ke broader trends aur news events ko bhi monitor karna chahiye, kyunki yeh factors bhi market ki movement ko impact kar sakte hain.
Ek successful trading strategy me Tri Star pattern ko ek tool ke taur pe use kiya jata hai. Yeh pattern market ke sentiment aur potential reversal points ko identify karne mein madad karta hai, lekin iska use karte waqt market ki overall conditions aur risk management ko bhi dhyan me rakhna zaroori hai. Traders ko is pattern ke sath patience aur disciplined approach adopt karna chahiye taake better trading decisions le sakein
اب آن لائن
Working...
تبصرہ
Расширенный режим Обычный режим