Forex technical analysis
-
shan512Senior Member

- Jul 2023
- 113
- 32
- 4
- 127 USD
-
<a href="https://www.instaforex.org/ru/?x=ruforum">InstaForex</a> -
shan512Senior Member
- Jul 2023
- 113
- 32
- 4
- 127 USD
Bilkul, main aapko forex technical analysis ke bare mein batata hoon. Forex technical analysis ek tareeka hai jisse traders currency exchange market mein price movements ko samajhne aur predict karne ke liye istemal karte hain. Isme past price data, charts, aur various technical indicators ka istemal hota hai. Yeh traders ko potential trading opportunities ki pehchan karne aur unke decisions ko support karne mein madad karta hai.Kuch important concepts aur tools forex technical analysis mein shamil hote hain: Candlestick Charts: Candlestick charts price movements ko visual representation mein dikhate hain. Har candlestick ek specific time period (jaise 1 minute, 1 hour, 1 day) ke price movement ko darshata hai. Har candlestick mein open, high, low, aur close prices dikhaye jate hain. Support and Resistance Levels: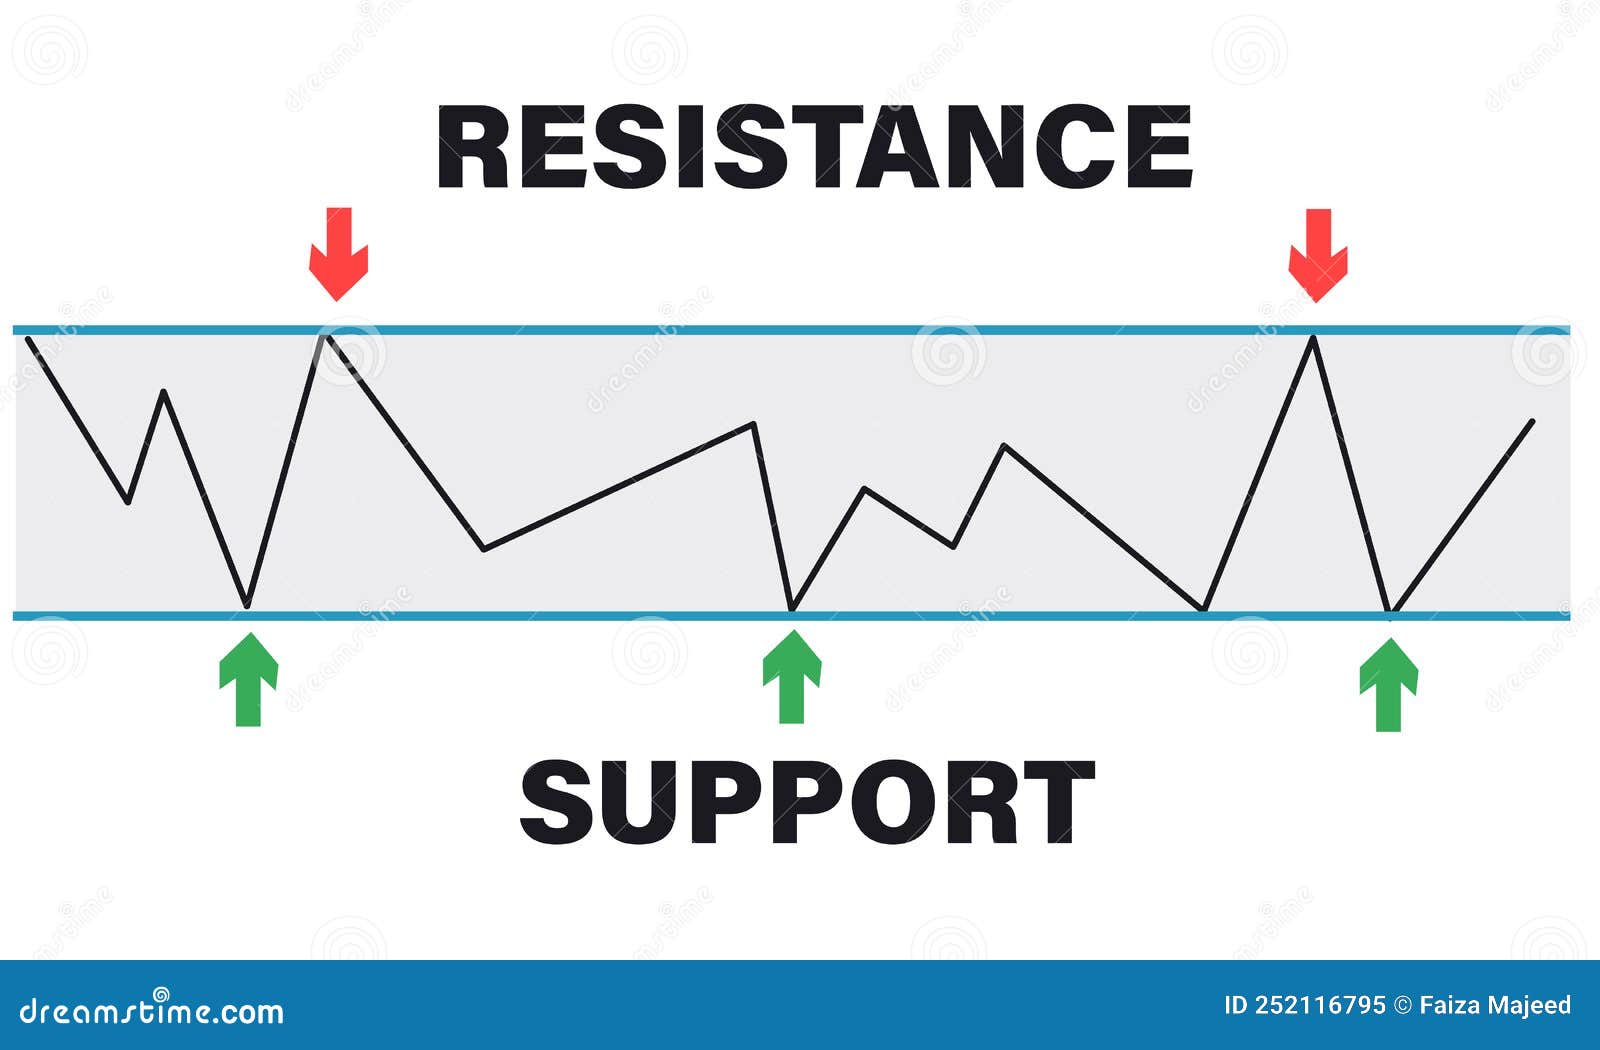 Yeh levels aise price points hote hain jahan par price historically bounce kiya hai. Support level price ko neeche jane se rokta hai, jabki resistance level price ko upar jane se rokta hai.Trend Lines: Trend lines ko chart par draw karke trend ko identify kiya jata hai. Upar ya neeche ki taraf slope wale lines uptrends aur downtrends ko represent karte hain. Technical Indicators: Yeh mathematical calculations hote hain jo price movements aur volume ke data se calculate hote hain. Examples include Moving Averages, Relative Strength Index (RSI), MACD (Moving Average Convergence Divergence), aur Bollinger Bands. In indicators ka istemal market direction, momentum, aur overbought/oversold conditions ko samajhne mein hota hai.Chart Patterns: Chart patterns, jaise ki Head and Shoulders, Double Tops, aur Triangles, traders ko price patterns aur potential reversals ke liye signals provide karte hain. Fibonacci Retracements: Fibonacci levels price movements ko analyze karne ke liye istemal hote hain. In levels ko draw karke traders determine karte hain ki price kis level tak retrace ho sakti hai.Ichimoku Cloud: Ichimoku cloud ek advanced technical indicator hai jo trend direction, support/resistance levels, aur momentum ko identify karta hai. Economic Calendar: Economic calendar mein upcoming economic events aur indicators ki dates hoti hain, jaise ki interest rate decisions, GDP releases, aur employment data. In events ka impact market movements par hota hai.Forex technical analysis mein, traders yeh sab tools aur concepts istemal karke price movements ka analysis karte hain. Isse unhe trading decisions ke liye insights milte hain. Yaad rahe ke technical analysis ek tool hai aur iske saath fundamental analysis (economic indicators, news, geopolitical factors) bhi consider karna zaroori hota hai.
اب آن لائن
Working...
تبصرہ
Расширенный режим Обычный режим