What is the double bottom pattern?
-
Khobaib1918Senior Member

- Mar 2023
- 172
- 2
- 14
- 3 USD
-
<a href="https://www.instaforex.org/ru/?x=ruforum">InstaForex</a> -
Khobaib1918Senior Member
- Mar 2023
- 172
- 2
- 14
- 3 USD
WHAT IS DOUBLE BOTTOM PATTERN ? Dobalu bottom pattern ek technical analysis chart pattern hai jo aam taur par ek downtrend ki reversal aur ek uptrend ka shuru hona ko signal data hai. Is mein do alag alag low points ya bottoms hote hain jo ek peak say separaat hote hain jis kay baad doosri low point aam tor par pehli bottom ki price level ko match karta hai. EXPLAIN DOUBLE BOTTOM PATTERN : Stocks kay decline shuru hote hi Doubal bottom pattern banne lagta hai jo kay jab stock ek bottom tak pohnch jaata hai aur phir direction reverse ho kar woh pehlay kay support level tak jaata hai. Us kay baad woh fir se decline hota hai magar is bar woh pehli bottom kay neechay nahi pohnchta phir woh uptrend mey chala jaata hai. Is pattern ko aam taur par price charts kay zariye dekha jata hai 'V' shape kay tor par jis mein two successive lows ho. Aam tor par is pattern ko samne layne kay liye kay pre-defined resistance level thik nazar aana chaheye jis mein do bottoms ke beech ka peak included ho. IMPORTANCE OF DOUBLE BOTTOM PATTERN : Double bottom pattern kay importance mein se ek yeh hai kay wo aik specific stock kay trend per asar andaz karne kay liye accurately predict kar sakta hai kay is ne bottom tak pohnch gaya hai abhi woh uptrend mey chalney laga hai. Is liye iss pattern ko investors ya traders jo uptrend ke faidey hasil karna chahtey hain un kay liye entry signal banna chaheye. Is pattern ko trader's stop loss ya take profit levels identify karne mein bhi madad deta hai. Peak jo do bottoms ke beech maujood tha wo resistance provide karti hai jo take profit kay liye target banta hai. Saath he, lows bhi support levels ban saktey han jo trader's risk manage karne mein madad karti hain aur un kay profits protect karti hain. CONCLUSION OF DOUBLE BOTTOM PATTERN : Double bottom pattern ek effective tool hai jo specific stock kay trend change ko accurately predict kar sakta hai. Iskay zariye long positions mein enter hona mumkin hai aur stop loss ya take profit signals kay saath trades ko exit karna. Overall, doubal bottom pattern traders aur investors dono kay liye useful tool hai jo securities kay current aur potential future prices per valuable insight provide karta hai. -
RanawaseemSenior Member
- Aug 2020
- 878
- 310
- 483
- 672 USD
InstaSpot: کسی بھی EPS اور بینک سے منافع واپس لیں، اور EPS اور cryptocurrencies کے تبادلے پر 7% تک کمائیں۔
"Double Bottom" pattern ko Forex mein "Dobara Neechay" ya "Dobara Nichey" pattern kehte hain. Yeh ek technical analysis chart pattern hai jo market mein dekha jata hai. Yeh pattern ek reversal pattern hota hai jo ek downtrend ke baad ban sakta hai aur iska matlab hota hai ki market sentiment bearish se bullish ki taraf shift ho rahi hai. Is pattern ka tafsili tor par bayan karte hain: Formation Double bottom pattern do mukhtalif kam qeemat (valleys) par bana hota hai jo qareebi qeemat mein hote hain. Yeh do qeemat nichey jate hain jo ek peak (chota sa upar ki taraf movement) se separate hote hain. Ise "double bottom" is liye kehte hain kyunki yeh do mukhtalif troughs ki tarah lagta hai jo ek support level bana rahe hain. Double bottom pattern aam taur par ek lambi downtrend ke baad banta hai. Yeh downtrend yeh dikhati hai ke sellers qaboo mein hain aur qeematein kam ho rahi hain. Confirmation Yeh pattern complete aur tasdeeq ho jata hai jab qeemat peak ko upar ki taraf break kar leti hai jo dono lows ko separate karta hai. Yeh breakout is baat ka ishara hai ke selling pressure kam ho gayi hai aur buyers ki taraf se taaqat aa rahi hai. Is breakout level ko traders entry point ke taur par istemal kar sakte hain agar woh potential reversal ka faida uthana chahte hain. Target: Breakout ke baad potential price target ko wohi qeemat measure ki jati hai jo pattern ke bottom se peak tak hoti hai (do lows ke beech wala bulandi point) aur uss faasle ko breakout level mein jama karke. Yeh projected price level traders ke liye profit hasil karne ka ya positions adjust karne ka maqsood ho sakta hai. Yaad rahe ke double bottom pattern ek reliable trend reversal ka ishara ho sakta hai, lekin har pattern aisa nahi hota. Traders aksar dusre technical indicators aur analysis techniques ka istemal chart patterns ke saath karke zyada soch samajh kar faislay lete hain. Zaroori hai ke trading mein risk hota hai, aur forex market ya kisi bhi financial market mein trading faislay se pehle patterns ko samajhne aur risk management strategies istemal karne ki salahiyat rakhte hain. How To Trade Double Bottom Pattren Pattern Identificaion (Pattern Ki Pehchaan): Sabse pehle, aapko chart par double bottom pattern ko identify karna hoga. Yeh pattern do lows (valleys) aur unke beech mein ek peak (upward movement) se bana hota hai jo ek downtrend ke baad nazar aata hai. Downtrend Confirmation Double bottom pattern usually ek downtrend ke baad form hota hai. Isliye pehle confirm karein ke aapka chart downtrend mein hai. Pattern Confirmation (Pattern Ki Tasdeeq): Pattern complete aur confirmed tab hota hai jab price peak (upward movement) ko break kar ke uss level par jaata hai jo dono lows ko separate karta hai. Is breakout ko confirm hone par aapko bullish reversal ki possibility hoti hai. Entry Point Aur Stop Loss: Jab pattern confirm ho jaye, to entry point ka faisla lena zaroori hai. Aap entry point ko breakout level ke around set kar sakte hain. Stop loss ko bhi set karein, taki agar trade against direction chala gaya to aapka loss limited rahe. Target Aur Profits: Aapko pattern ke target aur profits ka maqsood set karna hoga. Iske liye pattern ke bottom se peak tak ka distance measure karein aur woh distance breakout level mein jama kar ke target level set karein. Risk Management (Risk Ka Intizam): Har trade mein risk management zaroori hai. Apne trading capital ke hisab se appropriate position size aur risk level decide karein. Monitoring (Nigrani): Jab aap trade karte hain, to market ko closely monitor karein. Price movement ko observe karein aur agar trade aapke target level tak pohanch jaye, to profits secure karne ke liye appropriate actions lein. Educated Decisions: Chart patterns ke sath-sath, dusre technical indicators aur market analysis tools ka bhi istemal karein. Educated decisions lene ke liye market ki gehraaiyon ko samjhein. Yeh steps ek basic guideline hain double bottom pattern ko trade karne ke liye. Zaroori hai ke aap apni research aur knowledge par bhi bharosa karein. Trading mein amooman risk hota hai, isliye hamesha caution aur risk management maintain karein. -
HuzaifachohanMember
- Jun 2023
- 65
- 1
- 2
DOUBLE BOTTOM PATTERN:-"Double Bottom Pattern" ek technical analysis term hai jo stock market ya financial markets mein use hota hai. Yeh pattern price chart par dikhta hai aur traders aur investors iska istemal karke price movement predict karte hain. Double Bottom Pattern tab banta hai jab ek security ya stock ka price pehle ek downtrend ya price decline ke baad do baar bottom par touch karta hai aur phir ek reversal (price increase) ka signal deta hai. Is pattern ko samjhne ke liye, yahan tak ke isko visualize kar sakte hain: Downtrend Phase (Pehla Bottom): Security ka price pehle down-trend mein hota hai, yani price continuously kam ho raha hota hai. Us point tak jab price kam ho kar ek bottom point (nichla point) par pahunchta hai. Recovery Phase (Upar Ki Aur): Price phir se thoda sa upar ki aur move karta hai, lekin yeh recovery full reversal nahi hoti. Price firse neeche jata hai lekin pehle bottom tak nahi pahunchta. Downtrend Continuation: Price phir se neeche jata hai aur pehle bottom tak pahunchta hai ya usse bhi niche. Yahan tak ke price doosri baar pehle bottom se upar nahi jata. Second Bottom (Dusra Bottom): Price doosri baar neeche aakar ek similar ya thoda sa kam bottom point par pahunchta hai, lekin yeh pehle bottom se kam nahi hota. Reversal Confirmation: Ab price ek strong reversal signal deta hai. Yani, price doosri baar bottom se upar ki taraf move karta hai aur isse uptrend shuru hota hai. Double Bottom Pattern traders ke liye ek bullish (price increase ki taraf) signal hota hai. Jab price doosri baar bottom se upar jata hai, woh ek potential buying opportunity ho sakti hai, khaaskar jab yeh pattern high trading volumes ke saath dikhe. Is pattern ko identify karne ke liye, technical analysis tools jaise ki price charts, moving averages, aur volume indicators ka istemal hota hai. Traders is pattern ko dekh kar price ke future movement ka anumaan lagate hain aur uske hisab se trade karte hain. Yad rahe ke financial markets unpredictable hote hain aur kisi bhi pattern ya indicator ke sirf hone par hi trade karna risky ho sakta hai. Isliye, is pattern ko samjhne aur istemal karne se pehle acchi tarah se research aur samajh lena zaroori hai. -
<a href="https://www.instaforex.org/ru/?x=ruforum">InstaForex</a> -
Expert_Trader1Senior Member
- Jul 2023
- 136
- 3
- 86
Double Bottom Chart Pattern: Dealers ke liye ek bullish (cost increment ki taraf) signal hota hai. Hit cost doosri baar base se upar jata hai, woh ek potential purchasing opportunity ho sakti hai, khaaskar poke yeh design high exchanging volumes ke saath dikhe.Is design ko recognize karne ke liye, specialized investigation instruments jaise ki cost diagrams, moving midpoints, aur volume markers ka istemal hota hai. Dealers is design ko dekh kar cost ke future development ka anumaan lagate hain aur uske hisab se exchange karte hain.Yad rahe ke monetary business sectors unusual hote hain aur kisi bhi design ya marker ke sirf sharpen standard greetings exchange karna hazardous ho sakta hai. Isliye, is design ko samjhne aur istemal karne se pehle acchi tarah se research aur samajh lena zaroori hai. Twofold Base Example" ek specialized examination term hai jo securities exchange ya monetary business sectors mein use hota hai. Yeh design cost diagram standard dikhta hai aur dealers aur financial backers iska istemal karke cost development foresee karte hain.Double Base Example tab banta hai poke ek security ya stock ka cost pehle ek downtrend ya cost decline ke baad do baar base standard touch karta hai aur phir ek inversion (cost increment) ka signal deta hai.is design ko samjhne ke liye, yahan tak ke isko imagine kar sakte hain Cost phir se thoda sa upar ki aur move karta hai, lekin yeh recuperation full inversion nahi hoti. Cost firse neeche jata hai lekin pehle base tak nahi pahunchta.Price phir se neeche jata hai aur pehle base tak pahunchta hai ya usse bhi specialty. Yahan tak ke cost doosri baar pehle base se upar nahi jata.Price doosri baar neeche aakar ek comparable ya thoda sa kam base point standard pahunchta hai, lekin yeh pehle base se kam nahi hota. Chart Pattern Types: Graph designs ke sath, dusre specialized pointers aur market examination instruments ka bhi istemal karein. Taught choices lene ke liye market ki gehraaiyon ko samjhein.Yeh steps ek fundamental rule hain twofold base example ko exchange karne ke liye. Zaroori hai ke aap apni research aur information standard bhi bharosa karein. Exchanging mein amooman risk hota hai, isliye hamesha alert aur risk the executives keep up with karein.Har exchange mein risk the board zaroori hai. Apne exchanging capital ke hisab se fitting position size aur risk level choose karein.Jab aap exchange karte hain, to showcase ko intently screen karein. Cost development ko notice karein aur agar exchange aapke target level tak pohanch jaye, to benefits secure karne ke liye suitable activities lein.Jab design affirm ho jaye, to passage point ka faisla lena zaroori hai. Aap passage point ko breakout level ke around set kar sakte hain. Stop misfortune ko bhi set karein, taki agar exchange against course chala gaya to aapka misfortune restricted rahe.
 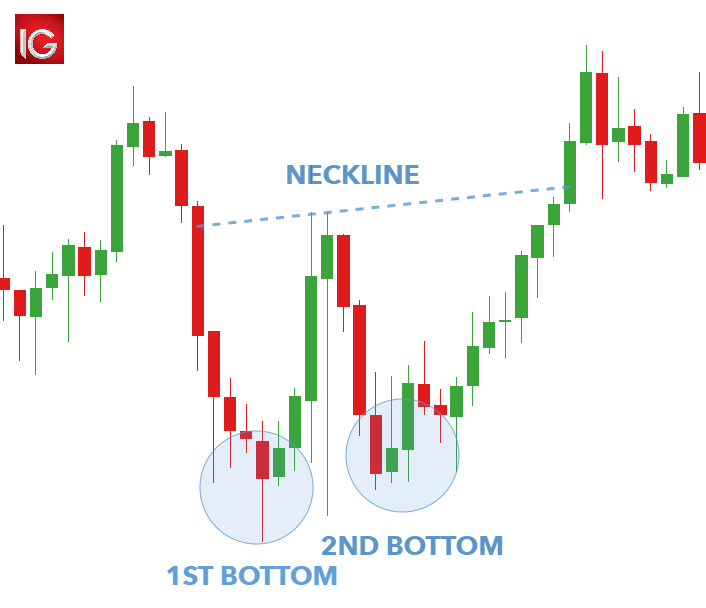 Breakout ke baad potential cost target ko wohi qeemat measure ki jati hai jo design ke base se top tak hoti hai (do lows ke beech wala bulandi point) aur uss faasle ko breakout level mein jama karke. Yeh projected cost level dealers ke liye benefit hasil karne ka ya positions change karne ka maqsood ho sakta hai.Yaad rahe ke twofold base example ek dependable pattern inversion ka ishara ho sakta hai, lekin har design aisa nahi hota. Merchants aksar dusre specialized pointers aur investigation procedures ka istemal graph designs ke saath karke zyada soch samajh kar faislay lete hain.Zaroori hai ke exchanging mein risk hota hai, aur forex market ya kisi bhi monetary market mein exchanging faislay se pehle designs ko samajhne aur risk the executives methodologies istemal karne ki salahiyat rakhte hain. Chart Pattern Trading: Design do mukhtalif kam qeemat (valleys) standard bana hota hai jo qareebi qeemat mein hote hain. Yeh do qeemat nichey jate hain jo ek top (chota sa upar ki taraf development) se separate hote hain. Ise "twofold base" is liye kehte hain kyunki yeh do mukhtalif box ki tarah lagta hai jo ek support level bana rahe hain.Double base example aam taur standard ek lambi downtrend ke baad banta hai. Yeh downtrend yeh dikhati hai ke dealers qaboo mein hain aur qeematein kam ho rahi hain.eh ek specialized examination outline design hai jo market mein dekha jata hai. Yeh design ek inversion design hota hai jo ek downtrend ke baad boycott sakta hai aur iska matlab hota hai ki market opinion negative se bullish ki taraf shift ho rahi hai.Is design ka tafsili pinnacle standard bayan karte hain
 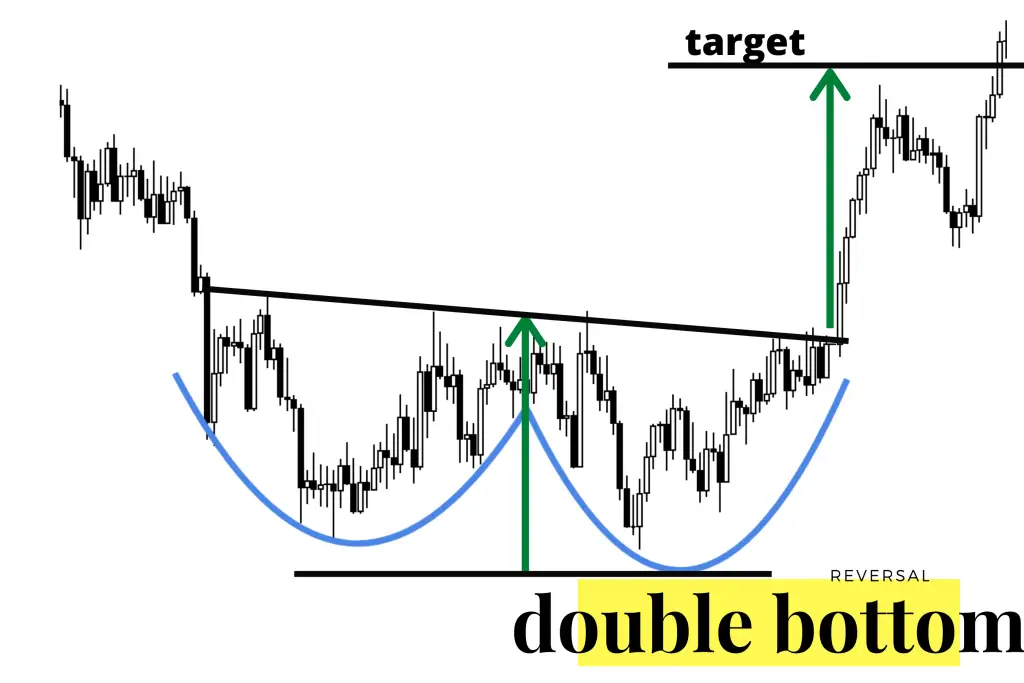 Twofold base example kay significance mein se ek yeh hai kay wo aik explicit stock kay pattern per asar andaz karne kay liye precisely foresee kar sakta hai kay is ne base tak pohnch gaya hai abhi woh upswing mey chalney laga hai. Is liye iss design ko financial backers ya merchants jo upturn ke faidey hasil karna chahtey hain un kay liye section signal banna chaheye.Is design ko broker's stop misfortune ya take benefit levels distinguish karne mein bhi madad deta hai. Top jo do bottoms ke beech maujood tha wo obstruction give karti hai jo take benefit kay liye target banta hai. Saath he, lows bhi support levels boycott saktey han jo dealer's gamble oversee karne mein madad karti hain aur un kay benefits safeguard karti hain.
اب آن لائن
Working...
تبصرہ
Расширенный режим Обычный режим