Harami Cross (Bullish and Bearish) Candlestick Pattern Guide.
-
SnoSenior Member

- Sep 2020
- 1861
- 16
- 265
- 668 USD
-
<a href="https://www.instaforex.org/ru/?x=ruforum">InstaForex</a> -
SnoSenior Member
- Sep 2020
- 1861
- 16
- 265
- 668 USD
Harami Cross (Bullish and Bearish) Candlestick Pattern. Harami Cross ek candlestick pattern hai jo market trend ko identify karne mein madad deta hai. Harami Cross pattern ka matlab hota hai "pregnant woman" ya "pregnant lady". Is pattern mein ek choti candle ek bari candle ko andar mein engulf karti hai. Is pattern ko bullish ya bearish dono tarah se interpret kiya ja sakta hai, yani upar ya neeche ki taraf jane wale trend ko identify karne mein madad deta hai. Agar ek bullish trend mein Harami Cross pattern banta hai to iska matlab hota hai ki market ki trend upar ki taraf jaa rahi hai. Is pattern mein pehle ek bari candle banegi jiski range lambi hogi. Phir dusri choti candle banegi jiski range pehli candle ki range ke andar hogi. Iska matlab hota hai ki pehli candle ki range mein trading ki gayi hai. Agar dusri candle pehli candle ko andar mein engulf karti hai to iska matlab hota hai ki market ka trend upar ki taraf jaa raha hai. Harami Cross (Bearish) Candlestick Pattern Benefits. Agar ek bearish trend mein Harami Cross pattern banta hai to iska matlab hota hai ki market ki trend neeche ki taraf jaa rahi hai. Is pattern mein pehle ek bari candle banegi jiski range lambi hogi. Phir dusri choti candle banegi jiski range pehli candle ki range ke andar hogi. Iska matlab hota hai ki pehli candle ki range mein trading ki gayi hai. Agar dusri candle pehli candle ko andar mein engulf karti hai to iska matlab hota hai ki market ka trend neeche ki taraf jaa raha hai. Main Factors. Harami Cross pattern ek useful tool hai trend ki identification ke liye. Agar kisi trader ko is pattern ki samajh hai to woh market ke trend ko identify kar sakta hai aur apni trading decisions ko improve kar sakta hai. -
sultan77Senior Member
- Apr 2023
- 714
- 34
- 3
Harami Cross Candlestick Pattern ek continuation pattern hai jo bullish ya bearish trend ke beech mein temporarily price consolidation ko indicate karta hai. Is pattern mein do consecutive candlesticks hote hain, jinme se pehla candlestick bada hota hai aur doosra candlestick chhota hota hai. **Explanation of Harami Cross Candlestick Pattern**: Harami Cross pattern mein pehla candlestick bada hota hai aur doosra candlestick chhota hota hai. Pehla candlestick ka range doosre candlestick ke range se zyada hota hai. Yeh pattern bullish ya bearish trend ke dauran dekha ja sakta hai aur temporarily price consolidation indicate karta hai. **Types of Harami Cross Candlestick Pattern**: 1. **Bullish Harami Cross**: Isme pehla candlestick bearish hota hai aur doosra candlestick uske andar close hota hai. Yeh pattern bearish trend mein dekha jata hai aur bullish reversal ka indication ho sakta hai. 2. **Bearish Harami Cross**: Isme pehla candlestick bullish hota hai aur doosra candlestick uske andar close hota hai. Yeh pattern bullish trend mein dekha jata hai aur bearish reversal ka indication ho sakta hai. **Characteristics of Harami Cross Candlestick Pattern**: - Pehla candlestick ka range doosre candlestick ke range se zyada hota hai. - Doosra candlestick ka range pehle candlestick ke andar hota hai. - Harami Cross pattern ka duration thoda lamba ho sakta hai, jisse price consolidation phase indicate hota hai. **Benefits (Fawaid) of Harami Cross Candlestick Pattern**: - Harami Cross pattern traders ko trend continuation ya reversal points identify karne mein madad deta hai. - Is pattern se traders potential entry aur exit points find kar sakte hain. - Trend reversal ke signals provide karta hai jab pehla candlestick ka range zyada hota hai. **Drawbacks (Nuqsan) of Harami Cross Candlestick Pattern**: - Yeh pattern hamesha accurate nahi hota, kuch cases mein false signals bhi ho sakte hain. - Market conditions aur events ke impact se pattern ka interpretation difficult ho sakta hai. **Conclusion**: Harami Cross Candlestick Pattern trend continuation aur reversal points ko identify karne mein madad deta hai. Lekin isey istemal karne se pehle, traders ko confirmatory signals aur dusre technical analysis tools ka bhi istemal karna chahiye. Market mein hone wali aur hone wale events ke madd-o-jazar se pehle, proper research aur analysis karna zaroori hai. -
AynSenior Member
- Aug 2020
- 3754
- 1727
- 700
- 2 635 USD
Harami Cross Candlestick Pattern. Harami Cross, ek important candlestick pattern hai jo market trends ko samjhne aur predict karne ke liye istemal hota hai. Yeh pattern Bullish (Upar ki taraf) ya Bearish (Niche ki taraf) direction mein develop ho sakta hai. Harami Cross, do alag alag candles se mil kar banta hai: pehli candle ek large range wali candle hoti hai aur dusri candle uske ander bani small range wali candle hoti hai. Bullish Harami Cross. Bullish Harami Cross pattern, jab market downtrend mein hota hai, yani ke prices ne neeche ki taraf movement ki hai aur phir trend reverse ho raha hai, tab ye dikh sakta hai. Is pattern mein. Large Bearish Candle (Pehli Candle)Pehli candle, ek long bearish (neeche ki taraf ja rahi) trend mein bani hoti hai jiski range zyada hoti hai. Yeh candle sellers ki dominance ko darshata hai. Small Bullish Candle (Dusri Candle).Dusri candle, pehli candle ki body ke andar bani hoti hai aur iski range pehli candle se kam hoti hai. Yeh bullish movement ko represent karti hai. Bullish Harami Cross pattern ka matlab hota hai ke selling pressure kam ho raha hai aur buyers market mein wapis a rahe hain. Yeh ek reversal signal ho sakta hai aur price upar ki taraf move kar sakta hai. Bearish Harami Cross. Bearish Harami Cross. pattern, jab market uptrend mein hota hai, yani ke prices ne upar ki taraf movement ki hai aur phir trend reverse ho raha hai, tab ye dikh sakta hai. Is pattern mein. Large Bullish Candle (Pehli Candle).Pehli candle, ek long bullish (upar ki taraf ja rahi) trend mein bani hoti hai jiski range zyada hoti hai. Yeh candle buyers ki dominance ko darshata hai. Small Bearish Candle (Dusri Candle).Dusri candle, pehli candle ki body ke andar bani hoti hai aur iski range pehli candle se kam hoti hai. Yeh bearish movement ko represent karti hai. Bearish Harami Cross pattern ka matlab hota hai ke buying pressure kam ho raha hai aur sellers market mein wapis a rahe hain. Yeh ek reversal signal ho sakta hai aur price neeche ki taraf move kar sakta hai. -
Expert_Trader1Senior Member
- Jul 2023
- 136
- 3
- 86
Harami Cross Chart Pattern: Harami Cross, ek significant candle design hai jo market patterns ko samjhne aur anticipate karne ke liye istemal hota hai. Yeh design Bullish (Upar ki taraf) ya Negative (Specialty ki taraf) bearing mein foster ho sakta hai. Harami Cross, do alag candles se mil kar banta hai: pehli candle ek huge reach wali flame hoti hai aur dusri candle uske ander bani little reach wali light hoti hai.Bullish Harami Cross example, poke market downtrend mein hota hai, yani ke costs ne neeche ki taraf development ki hai aur phir pattern switch ho raha hai, tab ye dikh sakta hai. Is design mein Pehli candle, ek long negative (neeche ki taraf ja rahi) pattern mein bani hoti hai jiski range zyada hoti hai. Yeh light venders ki strength ko darshata hai.Small Bullish Candle (Dusri Candle).Dusri flame, pehli candle ki body ke andar bani hoti hai aur iski range pehli candle se kam hoti hai. Yeh bullish development ko address karti hai. Harami Cross example dealers ko pattern continuation ya inversion focuses distinguish karne mein madad deta hai Is design se brokers potential passage aur leave focuses find kar sakte hain.Trend inversion ke signals give karta hai punch pehla candle ka range zyada ho Harami Cross Candle Example Yeh design hamesha exact nahi hota, kuch cases mein bogus signs bhi ho sakte hain Economic situations aur occasions ke influence se design ka understanding troublesome ho sakta hai Harami Cross Candle Example pattern continuation aur inversion focuses ko recognize karne mein madad deta hai. Lekin isey istemal karne se pehle, dealers ko corroborative signs aur dusre specialized investigation apparatuses ka bhi istemal karna chahiye. Market mein sharpen wali aur sharpen grain occasions ke madd-o-jazar se pehle, appropriate examination aur investigation karna zaroori hai. Chart Pattern Identification And Types: Harami Cross example mein pehla candle bada hota hai aur doosra candle chhota hota hai. Pehla candle ka range doosre candle ke range se zyada hota hai. Yeh design bullish ya negative pattern ke dauran dekha ja sakta hai aur briefly cost union show karta hai.Harami Cross Candle Example ek continuation design hai jo bullish ya negative pattern ke beech mein briefly cost combination ko demonstrate karta hai. Is design mein do back to back candles hote hain, jinme se pehla candle bada hota hai aur doosra candle chhota hota hai.Harami Cross example ek helpful apparatus hai pattern ki distinguishing proof ke liye. Agar kisi dealer ko is design ki samajh hai to woh market ke pattern ko recognize kar sakta hai aur apni exchanging choices ko improve kar sakta hai.
  Harami Cross ek candle design hai jo market pattern ko distinguish karne mein madad deta hai. Harami Cross example ka matlab hota hai "pregnant lady" ya "pregnant woman". Is design mein ek choti flame ek bari light ko andar mein inundate karti hai. Is design ko bullish ya negative dono tarah se decipher kiya ja sakta hai, yani upar ya neeche ki taraf jane rib pattern ko recognize karne mein madad deta hai.Agar ek bullish pattern mein Harami Cross example banta hai to iska matlab hota hai ki market ki pattern upar ki taraf jaa rahi hai. Is design mein pehle ek bari light banegi jiski range lambi hogi. Phir dusri choti flame banegi jiski range pehli candle ki range ke andar hogi.Bearish Harami Cross example hit market upturn se downtrend mein shift hota hai. Pehla candle bullish hota hai, jo ki upturn ko demonstrate karta hai. Dusra candle pehle light ke andar rehta hai, lekin ye negative hota hai, jo ki pattern inversion ki sign deta hai. Merchants is circumstance mein short positions lena shuru karte hain, expecting ki downtrend start hoga. Chart Pattern Trading: Harami Cross Example mein do mukhtalif candles shamil hotay hain. Pehlay candle bada hota hai aur doosray candle us ke andar bana hota hai, lekin pehlay candle ki range mein nahi aata. Harami Cross Example ki pehli candle ko 'mother light' kehte hain aur doosri candle ko 'doji' ya 'cross' flame kehte hain.Agar ek bullish pattern mein Harami Cross example banta hai to iska matlab hota hai ki market ki pattern upar ki taraf jaa rahi hai. Is design mein pehle ek bari flame banegi jiski range lambi hogi. Phir dusri choti light banegi jiski range pehli candle ki range ke andar hogi.Pehli candle badi hoti hai aur is mein cost range ziada hoti hai. Yeh bullish ya negative ho sakti hai, matlab upar ya neeche jaa sakti hai.Doosri candle choti hoti hai aur is mein open aur close cost qareeb barabar hote hain. Is candle mein market ki vulnerability aur uncertainty zahir hoti hai.
 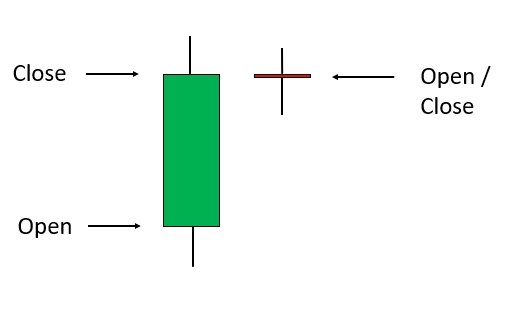 Harami Cross Example ki tashkhees karne ke baad, merchants is design ki tasdeeq ke liye aur specialized markers ya cost examination devices istemal karte hain. Agar is design ke baad market ki taraf tawajjah se upar ya neeche development dekhi jaye, to is se aam taur standard exchanging signals create kiye ja saktay hain.Harami Cross Example ek significant specialized examination apparatus hai jo forex brokers istemal karte hain taa'ke market ke future developments ko samajh saken. Is design ki sahi tashkhees aur samajh se, dealers apni exchanging systems ko behtar bana sakte hain aur potential exchanges ko samjhne mein madad hasil kar sakte hain.
-
Mariyum06Junior Member
- Mar 2023
- 35
- 294
- 36
- 19 USD
pehla candle bada hota hai aur doosra candle chhota hota hai. Pehla candle ka range doosre candle ke range se zyada hota hai. Yeh design bullish ya negative pattern ke dauran dekha ja sakta hai aur briefly cost union show karta hai.Harami Cross Candle Example ek continuation design hai jo bullish ya negative pattern ke beech mein briefly cost combination ko demonstrate karta hai. Is design mein do back to back candles hote hain, jinme se pehla candle bada hota hai aur doosra candle chhota hota hai.Harami Cross example ek helpful apparatus hai pattern ki distinguishing proof ke liye. Agar kisi dealer ko is design ki samajh hai to woh market ke pattern ko recognize kar sakta hai aur apni exchanging choices ko improve kar sakta hai.Harami Cross Example mein do mukhtalif candles shamil hotay hain. Pehlay candle bada hota hai aur doosray candle us ke andar bana hota hai, lekin pehlay candle ki range mein nahi aata. Harami Cross Example ki pehli candle ko 'mother light' kehte hain aur doosri candle ko 'doji' ya 'cross' flame kehte hain.Agar ek bullish pattern mein Harami Cross example banta hai to iska matlab hota hai ki market ki pattern upar ki taraf jaa rahi hai. Is design mein pehle ek bari flame banegi jiski range lambi hogi. Phir dusri choti light banegi jiski range pehli candle ki range ke andar hogi.Pehli candle badi hoti hai aur is mein cost range ziada hoti hai. Yeh bullish ya negative ho sakti hai, matlab upar ya neeche jaa sakti hai.Doosri candle choti hoti hai aur is mein open aur close cost qareeb barabar hote hain. Is candle mein market ki vulnerability aur uncertainty zahir hoti hai. Harami Cross Example ki tashkhees karne ke baad, merchants is design ki tasdeeq ke liye aur specialized markers ya cost examination devices istemal karte hain. Agar is design ke baad market ki taraf tawajjah se upar ya neeche development dekhi jaye, to is se aam taur standard exchanging signals create kiye ja saktay hain.Harami Cross Example ek significant specialized examination apparatus hai jo forex brokers istemal karte hain taa'ke market ke future developments ko samajh saken. Is design ki sahi tashkhees aur samajh se, dealers apni exchanging systems ko behtar bana sakte hain aur potential exchanges ko samjhne mein madad hasil kar sakte hain. Harami Cross ek candle design hai jo market pattern ko distinguish karne mein madad deta hai. Harami Cross example ka matlab hota hai "pregnant lady" ya "pregnant woman". Is design mein ek choti flame ek bari light ko andar mein inundate karti hai. Is design ko bullish ya negative dono tarah se decipher kiya ja sakta hai, yani upar ya neeche ki taraf jane rib pattern ko recognize karne mein madad deta hai.Agar ek bullish pattern mein Harami Cross example banta hai to iska matlab hota hai ki market ki pattern upar ki taraf jaa rahi hai. Is design mein pehle ek bari light banegi jiski range lambi hogi. Phir dusri choti flame banegi jiski range pehli candle ki range ke andar hogi.Bearish Harami Cross example hit market upturn se downtrend mein shift hota hai. Pehla candle bullish hota hai, jo ki upturn ko demonstrate karta hai. Dusra candle pehle light ke andar rehta hai, lekin ye negative hota hai, jo ki pattern inversion ki sign deta hai. Merchants is circumstance mein short positions lena shuru karte hain, expecting ki downtrend start hoga.candlestick pattern hai jo market trends ko samjhne aur predict karne ke liye istemal hota hai. Yeh pattern Bullish (Upar ki taraf) ya Bearish (Niche ki taraf) direction mein develop ho sakta hai. Harami Cross, do alag alag candles se mil kar banta hai: pehli candle ek large range wali candle hoti hai aur dusri candle uske ander bani small range wali candle hoti hai. Bullish Harami Cross. Bullish Harami Cross pattern, jab market downtrend mein hota hai, yani ke prices ne neeche ki taraf movement ki hai aur phir trend reverse ho raha hai, tab ye dikh sakta hai. Is pattern mein. Agar ek bullish trend mein Harami Cross pattern banta hai to iska matlab hota hai ki market ki trend upar ki taraf jaa rahi hai. Is pattern mein pehle ek bari candle banegi jiski range lambi hogi. Phir dusri choti candle banegi jiski range pehli candle ki range ke andar hogi.
-
<a href="https://www.instaforex.org/ru/?x=ruforum">InstaForex</a> -
sorat123Senior Member
- Apr 2023
- 171
- 58
- 1
Introduction of the post. A.O.Apehla candle bada hota hai aur doosra candle chhota hota hai. Pehla candle ka range doosre candle ke range se zyada hota hai. Yeh design bullish ya negative pattern ke dauran dekha ja sakta hai aur briefly cost union show karta hai.Harami Cross Candle Example ek continuation design hai jo bullish ya negative pattern ke beech mein briefly cost combination ko demonstrate karta hai. Is design mein do back to back candles hote hain, jinme se pehla candle bada hota hai aur doosra candle chhota hota hai.Harami Cross example ek helpful apparatus hai pattern ki distinguishing proof ke liye. Agar kisi dealer ko is design ki samajh hai to woh market ke pattern ko recognize kar sakta hai aur apni exchanging choices ko improve kar sakta hai.Harami Cross Example mein do mukhtalif candles shamil hotay hain. Pehlay candle bada hota hai aur doosray candle us ke andar bana hota hai, lekin pehlay candle ki range mein nahi aata. Harami Cross Example ki pehli candle ko 'mother light' kehte hain aur doosri candle ko 'doji' ya 'cross' flame kehte hain.Agar ek bullish pattern mein Harami Cross example banta hai to iska matlab hota hai ki market ki pattern upar ki taraf jaa rahi hai. Is design mein pehle ek bari flame banegi jiski range lambi hogi. Phir dusri choti light banegi jiski range pehli candle ki range ke andar hogi.Pehli candle badi hoti hai aur is mein cost range ziada hoti hai. Yeh bullish ya negative ho sakti hai, matlab upar ya neeche jaa sakti hai.Doosri candle choti hoti hai aur is mein open aur close cost qareeb barabar hote hain. Is candle mein market ki vulnerability aur uncertainty zahir hoti hay. Harami Cross Example ki tashkhees karne ke baad, merchants is design ki tasdeeq ke liye aur specialized markers ya cost examination devices istemal karte hain. Agar is design ke baad market ki taraf tawajjah se upar ya neeche development dekhi jaye, to is se aam taur standard exchanging signals create kiye ja saktay hain.Harami Cross Example ek significant specialized examination apparatus hai jo forex brokers istemal karte hain taa'ke market ke future developments ko samajh saken. Is design ki sahi tashkhees aur samajh se, dealers apni exchanging systems ko behtar bana sakte hain aur potential exchanges ko samjhne mein madad hasil kar sakte hay. Harami Cross ek candle design hai jo market pattern ko distinguish karne mein madad deta hai. Harami Cross example ka matlab hota hai "pregnant lady" ya "pregnant woman". Is design mein ek choti flame ek bari light ko andar mein inundate karti hai. Is design ko bullish ya negative dono tarah se decipher kiya ja sakta hai, yani upar ya neeche ki taraf jane rib pattern ko recognize karne mein madad deta hai.Agar ek bullish pattern mein Harami Cross example banta hai to iska matlab hota hai ki market ki pattern upar ki taraf jaa rahi hai. Is design mein pehle ek bari light banegi jiski range lambi hogi. Phir dusri choti flame banegi jiski range pehli candle ki range ke andar hogi.Bearish Harami Cross example hit market upturn se downtrend mein shift hota hai. Pehla candle bullish hota hai, jo ki upturn ko demonstrate karta hai. Dusra candle pehle light ke andar rehta hai, lekin ye negative hota hai, jo ki pattern inversion ki sign deta hai. Merchants is circumstance mein short positions lena shuru karte hain, expecting ki downtrend start hoga.candlestick pattern hai jo market trends ko samjhne aur predict karne ke liye istemal hota hai. Yeh pattern Bullish (Upar ki taraf) ya Bearish (Niche ki taraf) direction mein develop ho sakta hay. Harami Cross, do alag alag candles se mil kar banta hai: pehli candle ek large range wali candle hoti hai aur dusri candle uske ander bani small range wali candle hoti hay.
اب آن لائن
Working...
تبصرہ
Расширенный режим Обычный режим