Tweezer Bottom Candlestick Pattern.
-
AynSenior Member

- Aug 2020
- 3754
- 1727
- 700
- 2 635 USD
-
<a href="https://www.instaforex.org/ru/?x=ruforum">InstaForex</a> -
AynSenior Member
- Aug 2020
- 3754
- 1727
- 700
- 2 635 USD
Tweezer Bottom Candlestick Pattern.Tweezer Bottom ek mukhtalif aur ahem candlestick pattern hai jo technical analysis mein istemal hota hai. Yeh pattern market mein price reversal ko indicate karta hai, jahan price trend down se up ki taraf palat sakta hai. Tweezer Bottom Kya Hai. Tweezer Bottom ek candlestick pattern hai jise do alag alag candlesticks se represent kiya jata hai. Yeh pattern aksar downtrend ke baad dekha jata hai aur yeh bullish reversal ko suggest karta hai. Is pattern mein do candlesticks hote hain - pehla candle bearish hota hai aur dusra candle uske niche ek doosre ke paas, ya uske bilkul qareeb close hota hai. Yani, dono candlesticks ki lower wicks ya tails similar ya kam se kam close distance pe hote hain. Tweezer Bottom Identification. Tweezer Bottom pattern ko pehchanne ke liye, yeh kuch zaroori baatein hain: Downtrend. Tweezer Bottom pattern normaly kisi downtrend ke baad dekha jata hai. Yani, market price pehle neeche ki taraf ja raha hota hai. 2. 2 Candlesticks.Pattern mein do candlesticks hote hain. Pehla candle bearish hota hai aur dusra candle bullish hota hai. Lower Wicks. Dono candlesticks ke lower wicks ya tails similar ya kam se kam close distance pe hote hain. Yeh ek doosre ke paas ya overlap karte hain. 4. **Confirmation:** Pattern ki sahi tashkhees ke liye, agle candle ka intezar karna zaroori hai. Agar agla candle bullish hai aur price up ki taraf move karta hai, toh Tweezer Bottom pattern ki confirmation hoti hai.Tweezer Bottom ek powerful candlestick pattern hai jo price reversal ko signal karta hai. Is pattern ki samajh aur tashkhees, sahi trading decisions lene mein madadgar ho sakti hain. Lekin, jaise har trading pattern mein hota hai, is pattern ki bhi confirmation aur risk management zaroori hain. Trading mein shuruwat karne se pehle is pattern ko demo account pe practice karna behtar ho sakta hai. -
Azam1Member
- Jul 2023
- 55
- 4
- 38
Tweezer Base Candle Example. Tweezer Base ek mukhtalif aur ahem candle design hai jo specialized examination mein istemal hota hai. Yeh design market mein cost inversion ko demonstrate karta hai, jahan cost pattern down se up ki taraf palat sakta hai. Tweezer Base Kya Hai. Tweezer Base ek candle design hai jise do alag candles se address kiya jata hai. Yeh design aksar downtrend ke baad dekha jata hai aur yeh bullish inversion ko recommend karta hai. Is design mein do candles hote hain - pehla light negative hota hai aur dusra flame uske specialty ek doosre ke paas, ya uske bilkul qareeb close hota hai. Yani, dono candles ki lower wicks ya tails comparable ya kam se kam close distance pe hote hain. Tweezer Base Distinguishing proof. Tweezer Base example ko pehchanne ke liye, yeh kuch zaroori baatein hain: Downtrend. Tweezer Base example normaly kisi downtrend ke baad dekha jata hai. Yani, market cost pehle neeche ki taraf ja raha hota hai. 2 Candlesticks.Pattern mein do candles hote hain. Pehla candle negative hota hai aur dusra light bullish hota hai. Lower Wicks. Dono candles ke lower wicks ya tails comparable ya kam se kam close distance pe hote hain. Yeh ek doosre ke paas ya cross-over karte hain. 4. **Confirmation:** Example ki sahi tashkhees ke liye, agle candle ka intezar karna zaroori hai. Agar agla candle bullish hai aur cost up ki taraf move karta hai, toh Tweezer Base example ki affirmation hoti hai. importance forex main : forex jab say pakistan mmain aya is nay dhoom machai hui hai hnami is say bhar poor faida uthana chayay kun kh yay hamain bhut ziada kam day araha hai jiss say ham bahut ziada dollar kama kar lay ja arahy haiin jis say is main koi issue nai ho raha hai ham sab ko chayay yahan par is forex ki importance ko smjain candle pattern sab sy behtreen candle pattern in forex main sab say acha nizam chal raha hai candle pattern ka ham sab ko chayay is nizam ko smjain uar is say bhut ziada dollar kamain jiss say hamin bhi faida ho aur hamin dekh kar is say aur loog jur jain jiss aur ziadad fiada ho jai ga aur ham sab ki yahi condition hai kh is main work karinn. -
AyezaSenior Member
- Apr 2019
- 6660
- 163
- 2141
- 1 546 USD
Tweezer Bottom Candlestick Details. Tweezer Bottom Candlestick Pattern ka matlab hai "Tweezer Bottom Mombatti Patten". Ye ek technical analysis tool hai jo traders use karte hain stock market me. Tweezer Bottom Candlestick Pattern ek bullish reversal pattern hai. Is pattern me do candlesticks hote hain jo ek saath nazar aate hain. Ye candlesticks ek support level ke near create hote hain aur iska matlab hota hai ki market me selling pressure kam hone wala hai aur buying pressure increase hone wala hai. Tweezer Bottom Candlestick Pattern Anylesis. Tweezer Bottom Candlestick Pattern me do candlesticks hote hain. Pehla candlestick bearish hota hai aur doosra candlestick bullish hota hai. Dono candlesticks ke bottom price same hote hain aur iska matlab hota hai ki market me support level create ho raha hai. Agar aap Tweezer Bottom Candlestick Pattern ko use karna chahte hain to aapko ek bullish reversal ke liye wait karna hoga. Jab aapko ye pattern dikhe to aapko buy karna chahiye aur stop loss rakhein neeche support level ke near. Main Facts. Tweezer Bottom Candlestick Pattern ek useful tool hai jo traders ko market me kaafi help karta hai. Is pattern ko use karne se pehle aapko market ke trends ko samajhna hoga aur phir iska use karna chahiye. Is pattern ki help say trading kernay may problum nahi hoti or is liye Maximum members is ko like kertay hain is terha say trading kerna or bhi easy ho jata hay trading say releted her terha ki strategy ko utilise kren -
shan512Senior Member
- Jul 2023
- 113
- 32
- 4
- 127 USD
"Tweezer Bottom" ek prakar ka candlestick pattern hai jo technical analysis mein istemal hota hai. Ye pattern generally trend reversal ya trend continuation ko indicate karne mein madad karta hai. Tweezer Bottom pattern ka matlab hota hai ki do alag-alag candlesticks ek saath aate hain jahan par price ek particular support level ke aas-paas fluctuate karta hai.Is pattern mein, ek bullish candlestick (usually green ya white) followed by ek bearish candlestick (usually red ya black) hota hai, jiske baad phir ek bullish candlestick aata hai. Ye pattern tab hota hai jab bearish trend ke baad price ne neeche girna band kar diya ho aur fir se bullish momentum shuru ho gaya ho.Tweezer Bottom pattern ko identify karne ke liye, aapko in points ko dekhna hota hai: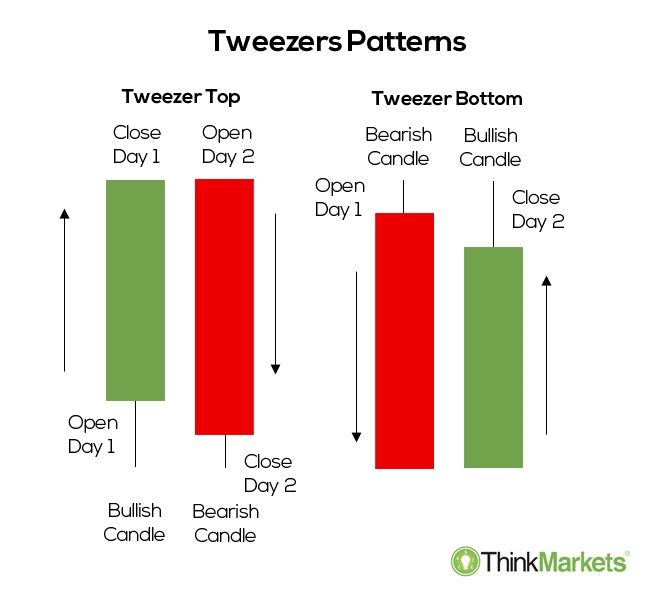 Downtrend: Pehli candlestick jo bearish hoti hai, woh ek downtrend ke baad dikhti hai. Support Level: Price ek specific support level ke aas-paas consolidate karti hai. Second Candle: Dusri candlestick, pehli candle ki low level par close hoti hai. Ye doji pattern bhi ho sakta hai. Third Candle: Tisri candle, dusri candle ki high level ko cross karti hai, indicating bullish momentum.Ye pattern ek potential trend reversal ko indicate karta hai, lekin iska confirmations ke liye aapko dusri technical analysis tools aur indicators ka bhi istemal karna chahiye, jaise ki RSI (Relative Strength Index), MACD (Moving Average Convergence Divergence), aur price volume analysis.Mujhe aapki yeh samajhne ki koshish sahi lagi. Agar aapko kuch aur jaankari chahiye ya kuch specific sawaalon ke liye, toh bina kisi hichkichahat ke poochh sakte hain!
-
M-HuzaifaJunior Member
- Aug 2023
- 23
- 1
TWEEZER BOTTOM CANDLESTICK PATTERN KEA HOTA HA ??? TWEEZER BOTTOM CANDLESTICK PATTERN: "Tweezer Bottom" candlestick pattern ek technical analysis tool hai jo ke financial markets, jaise ke stocks, forex, aur commodities mein istemal hota hai. Is pattern ki madad se traders aur investors market trend aur potential reversals ko samajhne ki koshish karte hain."Tweezer Bottom" pattern do consecutive (ek ke baad ek) candlesticks se bana hota hai, jahan pe pehli candlestick (usually a bearish candle) ek downtrend ke dauraan form hoti hai aur doosri candlestick (usually a bullish candle) uske baad form hoti hai. Dono candlesticks ka close price similar hota hai ya phir bohat qareeb hota hai. Pattern ki wazahat karne ke liye, main steps niche diye gaye hain: Downtrend: Pehli candlestick downtrend mein form hoti hai, matlab ke prices ne neeche jaane ki tendency dikhayi di hai. Tweezer Bottom Formation: Dusra candlestick bhi downtrend mein form hoti hai, lekin yeh pehli candlestick ki wick (upper shadow) ke qareeb ya usse touch karti hai, isse "tweezer bottom" pattern complete hota hai. Dusra candlestick usually bullish hoti hai, matlab ke uski opening price pehli candlestick ki opening price ke qareeb hoti hai ya usse neeche. Similar or Close Prices: Dono candlesticks ka close price similar hota hai ya phir bohat qareeb hota hai. Tweezer Bottom pattern ko dekhte waqt, traders iske signals ko samajhne ki koshish karte hain. Yadi downtrend ke baad ek Tweezer Bottom pattern form hota hai, toh yeh ek potential bullish reversal signal ho sakta hai. Iska matlab ho sakta hai ke market trend change hone wala hai aur prices upar ki taraf move karne ka prashna ho sakta hai. Traders is signal ko confirm karne ke liye aur bhi technical indicators aur analysis tools istemal karte hain. Hamesha dhyan rahe ke candlestick patterns single indicators nahi hote, aur ek hi pattern se trading decisions lene se bachein. Dusri technical aur fundamental analysis bhi zaroori hoti hai market ki sahi samajhne ke liye. Please note ke market mein trading karne se pehle, apko thorough research karna chahiye aur agar possible ho toh ek financial advisor ki salah bhi leni chahiye. -
Km2006Senior Member
- Mar 2022
- 1260
- 72
- 152
- 1 117 USD
Tweezers Candlestick Pattern. Hello dosto Bullish trend ma consistent bearish candles tweezer shape ma bnti hain to trend reversed predicted hota hai. trading market mein bahut sari baton different prediction dete hain aise hi tweezer top and bottom in date with the top and bottom candlestick chart patterns ko use karke decision liya ja sakta hai market ke reversal trend and continue trend ka.Forex trading market man candlestick chart patterns aapko diagram ke through tweezer top and bottom understand karne mein aapki help karta hun. Jab continue bearish candles banna shuru ho jaati hain air koi bhi candle bullish last candle ko cross kr ky close na ho to is ko tweezer bearish reversal trend kaha ja skta hai. Aisy he agr koi bhi three ye four candles continue bullish bn jain aor koi bhi candle bewrish camdle ko break kr ky below close na ho to us ko top tweezer oattern kaha ja skta hai jo bullish trend ki prediction deta hai aor ap intra day ma bullish trade open kr skty hain. Tweezer Bottom and Tweezer Top Candlestick Pattern. Dear friends Tweezer Top aur Tweezer bottom pattern k bad tweezer top new resistance aur Tweezer bottom new support hoga. Tweezer candlesticks pattern asal man ak Reversal candlesticks pattern ha. Tweezer top ki best examples Bullish Engulfing candlesticks pattern aur dark-cloud cover han. Tweezer bottom k foran bad ager hammer candlesticks patterh banna correctness k signal ha. Is man ha Buy ki trade lagaen. Tweezer bottom pattern k ke bad a candle Agar bullish Bane to agale candle mein Main aapane trade entry bike ki Le leni hai aur in case of the tweezer top pattern ke a Jab Bhi To Z top candle ki candle complete hone ke sath Agali candle complete ho to aapane Sel ki trade Le leni hai. Tweezer Top and Bottom Candlestick Pattern. Hi friends Tweezer Top aur Tweezer Bottom ko first time Steve Nison nami banda na invent kia. Steve Nison man Candlesticks chart k liye west man bhot famouse han. Tweezer candlesticks attern k bara man Steve Nison na apni book "Japanese Candlesticks Charting Techniques" man likhi ha. "Tweezer Top sa morad ha k jab two candles pehli hamasha bullish aur second hamasha bearish ho aur bullish ka high taqreban ya bilkul bearish candle k high baraber ho. Is pattern k motabiq market jahan per close hoi waheb sa he nicha i. Tweezer top pattern strong signal tab hoga jab ye uptrend k bad ae. "Tweezer Bottom sa morad ha k jab two candles pehli hamasha bearish aur dosri bulliish bana aur dono k low taqreban ya bilkul same ho. Iska motabiq jahan per market close hoi udher sa he oper chali gai. Tweezer Bottom candlesticks attern strong signal tab hoga jab ye bearish trend k bad bana to. -
<a href="https://www.instaforex.org/ru/?x=ruforum">InstaForex</a> -
UmerdonaSenior Member
- Apr 2021
- 1963
- 483
- 2787
- 540 USD
What is Tweezer Bottom Candlestick Pattern:? INTRODUCTION: sirr,, [/h]Tweezer Bottom Candlestick Details. Tweezer Bottom Candlestick Pattern ka matlab hai "Tweezer Bottom Mombatti Patten". Ye ek technical analysis tool hai jo traders use karte hain stock market me.Main Facts. Tweezer Bottom Candlestick Pattern ek useful tool hai jo traders ko market me kaafi help karta hai. Is pattern ko use karne se pehle aapko market ke trends ko samajhna hoga aur phir iska use karna chahiye.Tweezer Bottom Candlestick Pattern ek bullish reversal pattern hai. Is pattern me do candlesticks hote hain jo ek saath nazar aate hain. Ye candlesticks ek support level ke near create hote hain aur iska matlab hota hai ki market me selling pressure kam hone wala hai aur buying pressure increase hone wala hai. Tweezer Bottom Candlestick Pattern Anylesis. Tweezer Bottom Candlestick Pattern me do candlesticks hote hain. Pehla candlestick bearish hota hai aur doosra candlestick bullish hota hai. Dono candlesticks ke bottom price same hote hain aur iska matlab hota hai ki market me support level create ho raha hai.
Agar aap Tweezer Bottom Candlestick Pattern ko use karna chahte hain to aapko ek bullish reversal ke liye wait karna hoga. Jab aapko ye pattern dikhe to aapko buy karna chahiye aur stop loss rakhein neeche support level ke near.
Is pattern ki help say trading kernay may problum nahi hoti or is liye Maximum members is ko like kertay hain is terha say trading kerna or bhi easy ho jata hay trading say releted her terha ki strategy ko utilise kren BEST OF LUCK MY SWEET MEMBERS............,,,,,,,,,,,,,,
اب آن لائن
Working...
تبصرہ
Расширенный режим Обычный режим