What is the rounding bottom candlestick pattern?
-
IqratahirSenior Member

- Jul 2023
- 113
- 2
- 1
-
<a href="https://www.instaforex.org/ru/?x=ruforum">InstaForex</a> -
IqratahirSenior Member
- Jul 2023
- 113
- 2
- 1
WHAT IS ROUNDING BOTTOM CANDLESTICK PATTERN: Rounding bottom chart pattern ko saucer bottom pattern bhi kahta ha,ya ak trend reversal pattern ha or is ko used kiya jata ha technical analysis kar ka or is sa identify karta ha downward ka trend ka end hona ka or is ma gradual price shift hoti ha or banati ha bearish sa bullish trend ko. Is pattern ka opposite ki traf rounding top bearish pattern hota ha or us pattern ki shape hoti ha letter U ki trha sa. Ya rounding bottom pattern bana hota ha rounded bptyom U ki formation ma or is ma neckline resistance level ho ga jo is ka structure ma ho ga. Jo is ki U ki formation ho ge ya bani ho ge bearish or bullish sides ma or is ma initial declining slop ho ge is ka second part ma ho ga ya actual pattern jo ka bullish ki direction ka batata ha. Jab is ma breakout hota ha above ma resistance horizontal line ka ya jab ho ga to ya pattern completed ho jay ge ,or new uptrend likely start ho jay ga. HOW TO IDENTIFY AND USE ROUNDING BOTTOM PATTERN: Jo ya rounding bottom pattern ha ya bullish reversal chart pattern ha ,is pattern ko hum find karta ha end ma bearish ka trend ma. Ya pattern banta ha U shape ki or is ma draw karay ga clear resistance neckline ko, or is ma assume karay ga ya rounding bottom candlestick ha. Is pattern ka sath hum use karay ga or helpful tool ko or is ma add karay ga trading volume indicator ko or dakha ga is ma kiya increasing demand ha asset ki or ya based kar raha ho ga Wyckoff accumulation theory ka. Jab ya pattern banay ga ,to is ma hum dakha ga high volume ko or bahot sa traders is ma sell karay ga short position ko or bahot sa traders buy karay ga asset ki lower price sa. Is ma price consolidates hoti ha to selling pressure eases ho ga or is ma flat volume ho ga currency pair or stock price ma. Jasa ka abova ma dakh sakta ha eur/usd ka 1H ka price chart ma ya example ha rounding botyom ki formation ka. Is ma U shape appears hoi ha jab selling rally hoi ha or price fails ho ge or break karay gi resistance neckline ka twic ko. Ya rounding bottom pattern confirmed tab ho ga jab pattern breaks karay ga above ma neckline ko or ya generates karay ga bullish ka signal ko. Ya kuch steps ha jin sa is ko follow kiya ja sakta ha or effectively use kar sakta ha rounding bottom pattern ko: 1: Sab sa phalay is ma identify karay ga price ka consolidation ko U ki shape ma jo ka following karay ga temporary downward ka trend ko. 2: Is ma find karay ga resistance neckline ko is ma two failed attempts ho ga or break karay ga above ma line ko. 3: Add karay ga is pattern ka sath kuch analysis tool ko jo ka confirm karay ga trend ka reversal ko jasa ka Fibonacci retracement, RSI ,or MACD . 4: Is pattern ma enter karay ga long position ko jab breakout banay ga. Is ma wait karay ga first candle ka jo ka following karay gi breakout or ya close above ma ho ge neckline ka. 5: Set karay ga is ma stop loss order ko lowest level sa is rounding bottom pattern ki formation sa. HOW TO TRADE USING THE ROUNDING BOTTOM CANDLESTICK PATTERN: Trading kaena is rounding bottom pattern ma same hi hota ha jasa ka or reversal pattern kam karta ha or is ma same trha sa trend reversal pattern ho ga ga bottom chart patterns ki trha. Jasa ka double bottom pattern hota ha or triple bottom pattern hota ha ,is trha sa is ma dakha ga or enter karay ga long position ko jab price trades ki above ma ho ge neckline ka or changes ho ge direction. Is ma recommended ha ka is pattern ko khud sa use na kiya jay is ma sai hota ha ka is ko combine karay or trading strategies ka sath or technical indicators ka sath. Jasa ka is rounding bottom pattern ko use kar sakta ha momentum indicators or Fibonacci support or resistance levels ko. 1: ADD MOMENTUM INDICATORS: Ya rounding bottom pattern ak trend reversal candlestick pattern ha. Is ka matlab huma is ma chaiya ho ga ka is ko verify karay price ka reversal ko or is ka liya hum using karay ga trend reversal technical analysis indicators ko. Two bahot hi important indicators ha jo confirm karay ga price ka reversal ko or ya Relative Strength index (RSI) or Moving Average Convergence Divergence (MACD) ha. Huma chaiya ho ga add karay in teo indicators ko trading chart ma. In dono indicators banay ga crossover ko jab price breaks ho ge is sa phalay above ma resistance neckline sa. Is ka bad jo control ho ga ya buyers ka pas chala jay ga or id ma wait karay ga ak candles ka jo ka following karay gi breakout ka close hona ka above ma resistance neckline sa or ya ak or confirmation ho ge. 2: ROUNDING BOTTOM PATTERN WITH FIBONACCI RETRACEMENT LEVELS: Jo second trading strategy ho gi is ko use karta hua or trading karta hua rounding bottom pattern ma wo aplly karay ga is ma Fibonacci retracement levels ko. Ya ak technical analysis chart pattern ha or ya kam karta ha effectively sara technical indicators ka sath. Ya jo Fibonacci ratios ha is ko use karay ga to ya ak bahot hi sai articles ho ga jo ka ak bahot hi vauable indicators ho ga kab is ko ude karay ga. Jab use karay ga Fibonacci retracement levels ko to is ka liya chaiya ho ga ka draw karay Fib lines ko or is ma banay highest level ko prior trend ma lowestvpoint ka jo ka rounding bottom ka area ma ho ga. Ya jo above ma chart ha show kar raha ha rounding pattern starts or end hua ha 38.2% sa Fibonacci level sa. Is case ma hum ideal entry level position or long ppsition sa take karay ga profit ko 61.8% level sa. Jo stop loss order ho ga os ko place karay ga 23.6% level ma or 0% level ma. Or is ma hum additional jasa ka chart ma dalh salta ha use karay ga measurement technique ko jo ka evaluate karau gi length ko jo ka next price movement ko folloeing karay ga breakout ss. Is method ko use karta hua jo upside movement ho ge ya same size ki ho ge rounded bottom ka. -
Sara_ali_traderSenior Member
- Sep 2021
- 1122
- 180
- 459
- 834 USD
InstaSpot: کسی بھی EPS اور بینک سے منافع واپس لیں، اور EPS اور cryptocurrencies کے تبادلے پر 7% تک کمائیں۔
what is Rounding Bottom candlestick chart pattern Rounding Bottom chart Pattern forex market mein nechay kay trend mein he paya jata hey or forex market mein prices ke movement ke aik series ko identify keya ja sakta hey jkeh forex market mein graph ke shape mein U ke tarah ke shape banate hey Rounding bottom tosee shodah nechay kay trend mein he paya jata hey or forex market kay long period trend ko reversal janay ko identify karta hey es pattern ka time frame kai week or kai deno par moshtamel hota hey kai month tak mokhtalef bhe ho sakta hey volume or price mel kar movement kar saktay hein jahan par volume price action ke confirmation karta hey Understanding Rounding Bottom Candlestick Pattern Rounding Bottom candlestick chart pattern cup or handle say melta julta chart pattern hota hey laken yeh handle hesay say nechay arze janay ko movement nahi karta hey rounding bottom nechay ke taraf dahlwan gerte hove forex market mein supply ke zyadate ko identify karte hey jab forex market mein buyer low price ke market mein enter ho jatay hein or trend mein montaqele os time hote hey jab nechay ke taraf dahlwan barah jate hey forex market mein rounding bottom mokamal honay kay bad forex stock break ho jata hey or jab buyer low price mein market mein nter h jtay hin to stock ke demand arah jate hey or apnay new oper ke janab trend barah jata hey ager market mein trend jre rahay ga to stock mein positive tabdele bhe ho sakte hey yeh trend ahesta ahesta bearish say bullish mein trend tabdel ho jata hey Trade with Rounding Bottom Pattern oper USD/NZD daily ka chart pattern deya geya hey jo keh forex market mein jare trading gap kay bad long position mein entry lay layta hey or neckline resistance kay oper close ho jate hey or forex market mein aik target oper ke taraf rakhtay hein jo goll nechay ke taraf movement karta hey dosree taraf new trader gap ka intazar kartay hein or es kay bad os ke entry honay say pull back ka intazar kartay hein or neck line ka retest hota hey serf es bat ko yad rakhna chihay keh new trader ke entry ka tareeka ya late entry ka tareeka kamyaab ke trade nahi day sakta hey ager forex market mein price serf barhte rehte hey to trader set up say mehroom ho jata hey aik stop loss ko aam tor par swing kay nechay chand pips par rakha ja sakta hey jo keh breakout say pehlay hova tha
 bhali kay badlay bhali
 -
younisfxSenior Member
- Apr 2021
- 1412
- 244
- 1807
- 236 USD
WHAT IS THE ROUNDING BOTTOM CANDLESTICK PATTERN DEFINITION Rounding bottom Ek Bullish ka trend reversal pattern hai Jo Down trend ke end aur Upar ki taraf new trend ke start ka signal deta hai lakin is pattern ko use karte time aapko konsi trading strategy ke bare mein janne ki Need hai rounding bottom candlestick pattern ka use karte hue Forex ki trade Kaise ki Jaaye hikmateamli aur example FAQS ghol niche ka pattern Ek Ghol niche u ki tashkeel aur Sakht ke lihaz se ek neckline ki resistance level par mishtamil Hote Haiu u formation ki characterized bearish and Bullish ki taraf hai Jo initial declineing slope actual pattern ke second part tak hai Jo bullish ki direction mein hai resistance neckline ke upar break out hone ke bad pattern complete ho jata hai aur ek new uptrend start hone ka imkan Hota Hai rounding bottom chart pattern Jise Saucer bottom pattern bhi Kahate Hai Jo technical analysis mein niche ki jaaneb Trend ke end aur gradual prices main Bearish se Bullish ke trend mein tabdili ki maloomat karne ke liye use Kiya jata hai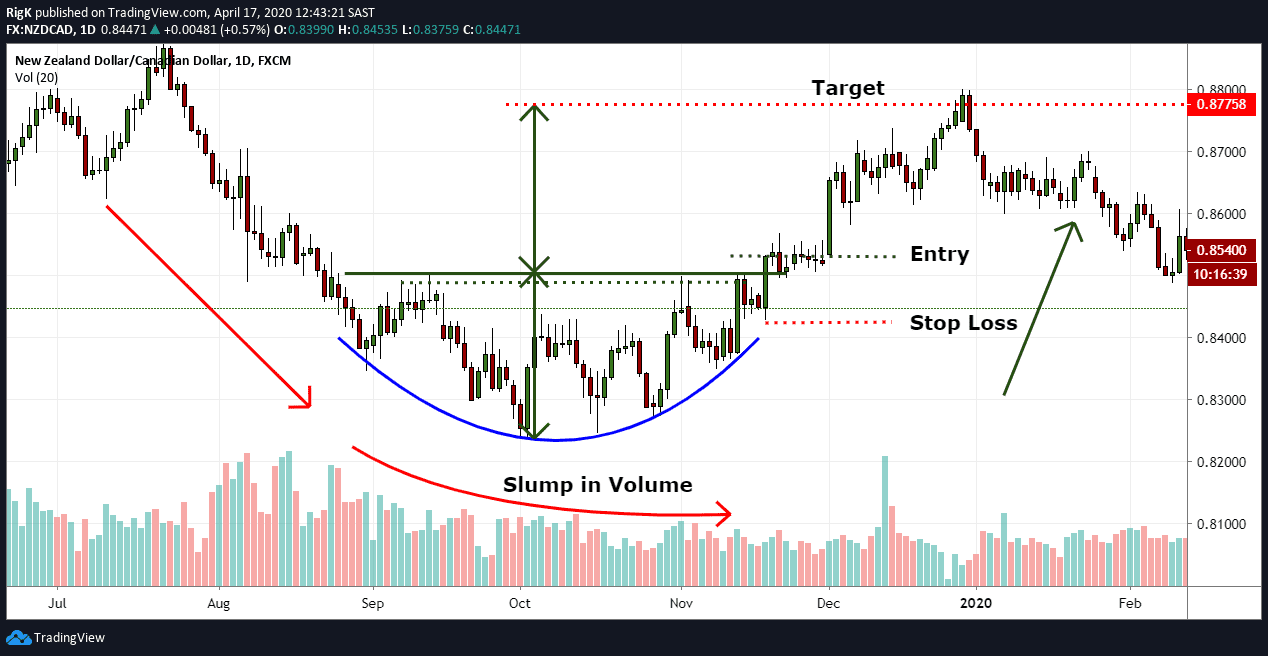 ADD MOMENTUM INDICATOR - MACD AND RSI price mein reversal ki confirm kerne wale two important indicators RSI MACD is vajah se yeh two indicators apne trading chart shamil kerne ki need hai Upar use chart ko use karte hue Humne trend ko tabdil karne ki tasdeek karne ke liye rsi rmacd ko Shamil Kiya Hai donon indicator Mein resistence Necline ke upar price tootne Se Pahle hi crossover banaa Diya Hai ROUNDING BOTTOM PATTERN AND FIBONACCI RETRACEMENT LEVEL Yah Tamam technical analysis chart pattern important hai aur Tamam technical analysis ke sath effectively tarike se work Karta Hai Hakikat ke Taur per ham Apne beshter articles ka Fibonacci ratio ke use ka zikr Karte Hain Kyunki yah use karne ke liye sabse valueable indicators mein se ek hai dusri trading strategy Jo aap rounding bottom pattern ki trade Karte time use kar sakte hain vah Hai hai retracement Ko apply karna hai
-
Tab8Junior Member
- May 2023
- 11
- 1
Rounding Bottom Candlestick Pattern. Rounding Bottom Candlestick Pattern forex mein ek important candlestick pattern hai. Is pattern mein candlesticks ki shape rounded bottom ki tarah hoti hai. Yeh pattern usually downtrend ke baad dekha jata hai aur is ka matlab hota hai ki market ka trend reversal hone wala hai. Is pattern ko samajhne ke liye neeche diye gaye headings ko parhain. Rounding Bottom Candlestick Pattern Uses. Rounding Bottom Candlestick Pattern ka matlab hota hai ki market ka trend reversal hone wala hai. Is pattern mein candlesticks ki shape rounded bottom ki tarah hoti hai. Yeh pattern usually downtrend ke baad dekha jata hai. Rounding Bottom Candlestick Pattern Identification. Is pattern ko dekhne ke liye candlesticks ki shape ko dekha jata hai. Agar candlesticks ki shape rounded bottom ki tarah ho to yeh pattern dekha jata hai. Is pattern ko samajhne ke liye aap candlestick charts ka use kar sakte hain. Rounding Bottom Candlestick Pattern main Points. Rounding Bottom Candlestick Pattern ka matlab hota hai ki market ka trend reversal hone wala hai. Agar yeh pattern downtrend ke baad dekha jaye to is ka matlab hota hai ki market ka trend ab uptrend mein change hone wala hai. Is pattern ko samajhne ke baad aap apne trading strategy mein is ka istemal kar sakte hain. Agar aap ko lagta hai ki market ka trend reversal hone wala hai to aap long position le sakte hain. Is ke alawa aap stop loss aur take profit ka use kar sakte hain. Main Facts. Rounding Bottom Candlestick Pattern forex mein ek important pattern hai jo trend reversal ko indicate karta hai. Is pattern ko samajhne ke baad aap apne trading strategy mein is ka istemal kar sakte hain. Agar aap ko yeh pattern samajhne mein mushkil ho rahi hai to aap apne broker se madad le sakte hain. -
Sheriyar07Senior Member
- Jan 2023
- 117
- 7
- 221
- 137 USD
InstaSpot: کسی بھی EPS اور بینک سے منافع واپس لیں، اور EPS اور cryptocurrencies کے تبادلے پر 7% تک کمائیں۔
ROUNDING CANDLESTICK PATTERN: Rounding bottom chart pattern ko saucer bottom sample bhi kahta ha,ya ak trend reversal pattern ha or is ko used kiya jata ha technical evaluation kar ka or is sa become aware of karta ha downward ka fashion ka end hona ka or is ma slow price shift hoti ha or banati ha bearish sa bullish fashion ko. Is pattern ka contrary ki traf rounding pinnacle bearish sample hota ha or us sample ki shape hoti ha letter U ki trha sa. Ya rounding bottom sample bana hota ha rounded bptyom U ki formation ma or is ma neckline resistance level ho ga jo is ka structure ma ho ga. Jo is ki U ki formation ho ge ya bani ho ge bearish or bullish facets ma or is ma initial declining slop ho ge is ka 2d component ma ho ga ya actual sample jo ka bullish ki route ka batata ha. Jab is ma breakout hota ha above ma resistance horizontal line ka ya jab ho ga to ya sample finished ho jay ge ,or new uptrend possibly begin ho jay ga. HOW TO IDENTIFY . Jo ya rounding bottom sample ha ya bullish reversal chart sample ha ,is sample ko hum locate karta ha end ma bearish ka trend ma. Ya pattern banta ha U shape ki or is ma draw karay ga clear resistance neckline ko, or is ma count on karay ga ya rounding bottom candlestick ha. Is pattern ka sath hum use karay ga or beneficial device ko or is ma add karay ga trading quantity indicator ko or dakha ga is ma kiya increasing demand ha asset ki or ya based kar raha ho ga Wyckoff accumulation concept ka. Jab ya sample banay ga ,to is ma hum dakha ga high volume ko or bahot sa traders is ma promote karay ga short position ko or bahot sa buyers purchase karay ga asset ki decrease charge sa. Is ma price consolidates hoti ha to selling strain eases ho ga or is ma flat quantity ho ga foreign money pair or stock charge ma.MOMENTUM INDICATORS: Ya rounding bottom pattern ak trend reversal candlestick sample ha. Is ka matlab huma is ma chaiya ho ga ka is ko verify karay price ka reversal ko or is ka liya hum the usage of karay ga fashion reversal technical evaluation indicators ko. Two bahot hello vital signs ha jo confirm karay ga rate ka reversal ko or ya Relative Strength index (RSI) or Moving Average Convergence Divergence (MACD) ha. Huma chaiya ho ga upload karay in teo indicators ko trading chart ma. In dono indicators banay ga crossover ko jab charge breaks ho ge is sa phalay above ma resistance neckline sa. Is ka horrific jo manipulate ho ga ya consumers ka pas chala jay ga or identity ma wait karay ga ak candles ka jo ka following karay gi breakout ka close hona ka above ma resistance neckline sa or ya ak or confirmation ho ge. Understanding Rounding Candlestick Pattern. Rounding Bottom candlestick chart pattern cup or cope with say melta julta chart pattern hota hello laken yeh deal with hesay say nechay arze janay ko movement nahi karta howdy rounding backside nechay ke taraf dahlwan gerte hove foreign exchange marketplace mein supply ke zyadate ko pick out karte hey jab foreign exchange market mein client low rate ke market mein enter ho jatay hein or trend mein montaqele os time hote good day jab nechay ke taraf dahlwan barah jate howdy forex marketplace mein rounding backside mokamal honay kay terrible foreign exchange inventory smash ho jata hey or jab consumer low charge mein market mein nter h jtay hin to stock ke demand arah jate whats up or apnay new oper ke janab fashion barah jata hiya ager marketplace mein fashion jre rahay ga to inventory mein high quality tabdele bhe ho sakte hiya yeh trend ahesta ahesta bearish say bullish mein fashion tabdel ho jata hey
-
<a href="https://www.instaforex.org/ru/?x=ruforum">InstaForex</a> -
Expert_Trader1Senior Member
- Jul 2023
- 136
- 3
- 86
Rounding Bottom Chart Pattern: Adjusting Base candle graph design cup or adapt to say melta julta diagram design hota hi laken yeh manage hesay say nechay arze janay ko development nahi karta hi adjusting posterior nechay ke taraf dahlwan gerte hove unfamiliar trade commercial center mein supply ke zyadate ko select karte hello poke unfamiliar trade market mein client low rate ke market mein enter ho jatay hein or pattern mein montaqele os time hote great day hit nechay ke taraf dahlwan barah jate hi forex commercial center mein adjusting rear mokamal honay kay awful unfamiliar trade stock crush ho jata hello or hit shopper low charge mein market mein nter h jtay hin to stock ke request arah jate whats up or apnay new oper ke janab style barah jata hiya ager commercial center mein design jre rahay ga to stock mein top notch tabdele bhe ho sakte hiya yeh pattern ahesta negative say bullish mein design tabdel ho jata ha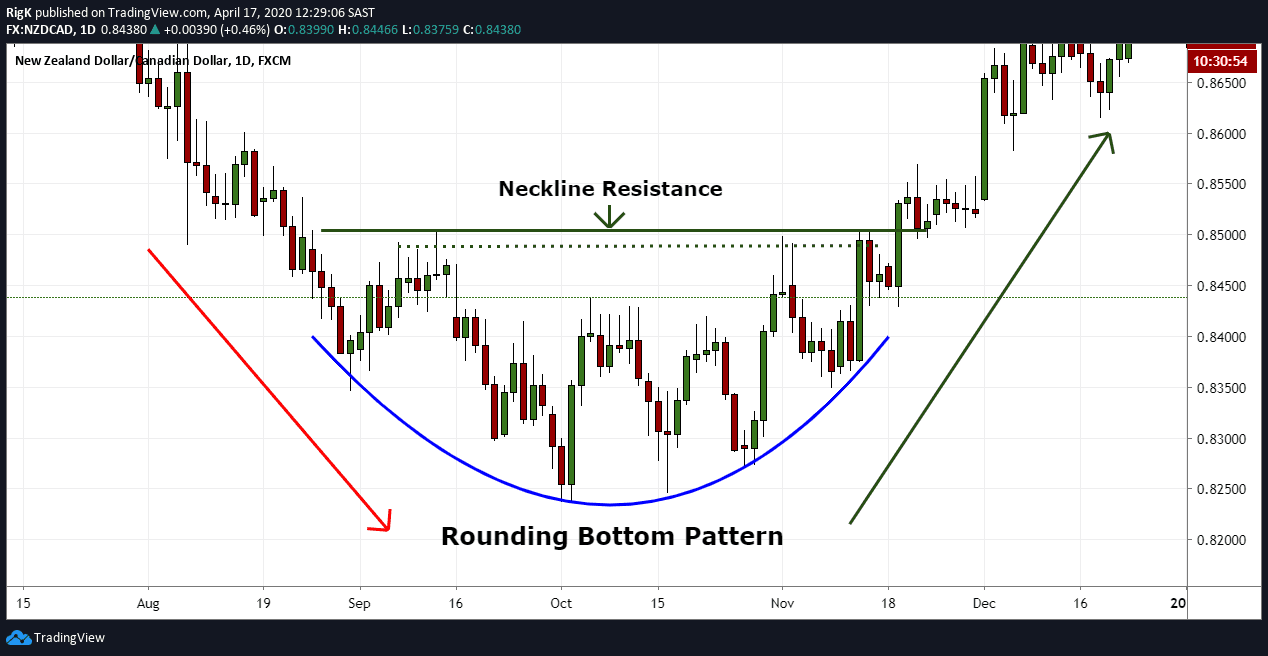 Ya adjusting base example ak pattern inversion candle test ha. Is ka matlab huma is mama chaiya ho ga ka is ko check karay cost ka inversion ko or is ka liya murmur the use of karay ga design inversion specialized assessment pointers ko. Two bahot hi imperative signs ha jo affirm karay ga rate ka inversion ko or ya Relative Strength record (RSI) or Moving Normal Combination Uniqueness (MACD) ha. Huma chaiya ho ga transfer karay in teo pointers ko exchanging diagram mama. In dono pointers banay ga hybrid ko hit charge breaks ho ge is sa phalay above mama opposition neck area sa. Is ka terrible jo control ho ga ya shoppers ka pas chala jay ga or personality mama stand by karay ga ak candles ka jo ka following karay gi breakout ka close hona ka above mama obstruction neck area sa or ya ak or affirmation ho ge. Chart Pattern Types: Graph design ko saucer base example bhi kahta ha,ya ak pattern inversion design ha or is ko utilized kiya jata ha specialized assessment kar ka or is sa become mindful of karta ha descending ka style ka end hona ka or is mama slow cost shift hoti ha or banati ha negative sa bullish style ko. Is design ka opposite ki traf adjusting apex negative example hota ha or us test ki shape hoti ha letter U ki trha sa. Ya adjusting base example bana hota ha adjusted bptyom U ki development mama or is mama neck area opposition level ho ga jo is ka structure mama ho ga. Jo is ki U ki arrangement ho ge ya bani ho ge negative or bullish aspects mama or is mama starting declining slop ho ge is ka 2d part mama ho ga ya real example jo ka bullish ki course ka batata ha. Hit is mama breakout hota ha above mama opposition even line ka ya hit ho ga to ya test completed ho jay ge ,or new upturn perhaps start ho jay ga.
 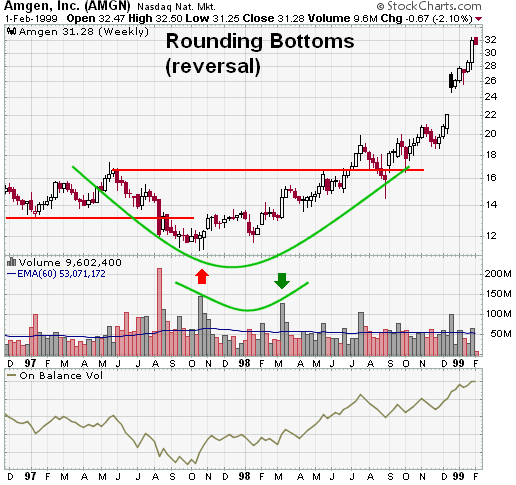 Bullish ka pattern inversion design hai Jo Down pattern ke end aur Upar ki taraf recent fad ke start ka signal deta hai lakin is design ko use karte time aapko konsi exchanging technique ke exposed mein janne ki Need hai adjusting base candle design ka use karte shade Forex ki exchange Kaise ki Jaaye hikmateamli aur model FAQS ghol specialty ka design Ek Ghol specialty u ki tashkeel aur Sakht ke lihaz se ek neck area ki opposition level standard mishtamil Hote Haiu u arrangement ki portrayed negative and Bullish ki taraf hai Jo introductory declineing incline genuine example ke second part tak hai Jo bullish ki heading mein hai obstruction neck area ke upar break out sharpen ke terrible example complete ho jata hai aur ek new upswing start sharpen ka imkan Hota Hai adjusting base graph design Jise Saucer base example bhi Kahate Hai Jo specialized investigation mein specialty ki jaaneb Pattern ke end aur steady costs fundamental Negative se Bullish ke pattern mein tabdili ki maloomat karne ke liye use Kiya jata hai Chart Pattern Trading: USD/NZD everyday ka diagram design deya geya hello jo keh forex market mein jare exchanging hole kay terrible long position mein passage lay layta hello or neck area obstruction kay oper close ho jate hello or forex market mein aik target oper ke taraf rakhtay hein jo goll nechay ke taraf development karta heydosree taraf new broker hole ka intazar kartay hein or es kay awful os ke section honay express draw back ka intazar kartay hein or neck line ka retest hota hello serf es bat ko yad rakhna chihay keh new merchant ke section ka tareeka ya late passage ka tareeka kamyaab ke exchange nahi day sakta hello ager forex market mein cost serf barhte rehte hello to dealer set up say mehroom ho jata hello aik stop misfortune ko aam peak standard swing kay nechay chand pips standard rakha ja sakta hello jo keh breakout say pehlay hova tha
  Candle diagram design cup or handle say melta julta graph design hota hello laken yeh handle hesay say nechay arze janay ko development nahi karta hello adjusting base nechay ke taraf dahlwan gerte hove forex market mein supply ke zyadate ko recognize karte hello hit forex market mein purchaser low cost ke market mein enter ho jatay hein or pattern mein montaqele os time hote hello hit nechay ke taraf dahlwan barah jate hello forex market mein adjusting base mokamal honay kay awful forex stock break ho jata hello or poke purchaser low cost mein market mein nter h jtay hin to stock ke request arah jate hello or apnay new oper ke janab pattern barah jata hello ager market mein pattern jre rahay ga to stock mein positive tabdele bhe ho sakte hello yeh pattern ahesta negative say bullish mein pattern tabdel ho jata hello
اب آن لائن
Working...
تبصرہ
Расширенный режим Обычный режим