What is island reversal candlestick pattern?
-
Khobaib1918Senior Member

- Mar 2023
- 172
- 2
- 15
- 3 USD
-
<a href="https://www.instaforex.org/ru/?x=ruforum">InstaForex</a> -
Khobaib1918Senior Member
- Mar 2023
- 172
- 2
- 15
- 3 USD
WHAT IS THE ISLAND REVERSAL CANDLESTICK PATTERN : Island reversal pattern ki formation tab hoti ha jab price action gaps separate karti ha group ma candlestick or bars ma. Jasa ka is pattern ka name ha, is pattern ma trend ka reversal hota ha or ya suggests karta ha bullish or bearish trend ka reaching hona ka exhaustion point ma. Forex traders dakhta ha is Island reversals pattern ko buy or sell ma anticipation ma price ka moving ka opposite direction ki traf. Is trha sa is Island Reversal pattern ko considered kiya jata ha bullish or bearish indicator ki trha sa. Ya chart pattern ak bahot hi popular banta ha jab technical analysis karta ha. Ya jo is pattern ki chart formation hoti ha ya madad karta ha traders ki predict karna ka liya future price ki movements par or ya banata ha trading decisions ko. Or ya island reversal pattern bahot hi reliable chart pattern ha. HOW TO IDENTIFY AND USE ISLAND REVERSAL PATTERN : Jo ya Island reversal formation ha ya huma suggests karta ha trajectory price action ka change hona ko. Classified karay is Island indicator koto jo Island reversals pattern ha is ki two types hoti ha bullish or bearish. Ya jo above ma chart ha is ma bearish Island Reversal pattern bana ha. Is ma dakh sakta ha ka, jasa is ka name ha, is trha sa is pattern na creates kiya ha sort or isolated island ko price chart ma, or ya banay ga pattern ko relatively easy. Ya kuch points ha jin sa identify or trade kar sakta ha Island Reversal pattern ma: 1: Sab sa phalay is pattern ma identify karay ga prevailing uptrend or downtrend ko. 2: Second is ma search karay ga presence Two gaps ko, ak gap start ma ho ga is pattern ka or ak gap end ma ho ga cluster ma candlestick or price bars ma. 3: Place karay ga is ma buy or sell order ko above or below ma price action island ma. 4: Set karay ga stop loss or profit targets ko or concerning karay ga reversal candlestick pattern ko. PATTERN RECOGNITION : Recognizing Island Reversal pattern live market ma straightforward or intuitive hoti ha. Is pattern ki jo bhi formation hoti ha ya two parts ma hoti ha ; ak gap zone or dosra island. 1: GAP : Is ma series ma two price gaps banta ha jo ka separate karta ha or Island ko banta ha jo ka preceding trend ma hota ha. Jo first gap hota ha is ma initial break hota ha Island or price action ka between ma, or jo second gap ata ha ya final break hota ha Island or price action ka between ma. 2: ISLAND : Jo is ma Island hota ha ya group hota ha price bars or candlesticks ka or ya opposite ma hota ha first or second gap ka. Ya banta ha jab bullish or bearish trend hota ha or is ko dakha jata ha harbinger market ka reversal ka. BULLISH ISLAND REVERSAL PATTERN : Bullish Island reversal pattern banta ha jab pronounced downtrend hota ha. Ya bana hota ha negative gap ka sath jis ka between ma price action hoti ha or Island hoti ha candlestick ki. Jo bullish Island ha ya signal data ha buy ka anticipation ka upwards shift karna ka price action ka. Ya downtrend ma banay ga or is ma lower ki traf island banay ga or is ma jo first gap ay ga ya down ka ho ga or same hi point sa lower ma island ma kuch candlestick ka bannay ka bad up ka gap ay ga or ya downtrend sa upward ki traf price ka reversal hona ka batay ga, is ma lower sa higher ki janab reversal ho ga. BEARISH ISLAND REVERSAL PATTERN : Jo bearish Island reversal pattern ha ya banta ha jab prevailing uptrend ma hoti ha price. Ya comprises karti ha positive gap between ma price action ka or island ma candlestick ki. Jo ya bearish island pattern ha ya banay ga to is sa phalay price upward ma jay ge or is higher price sa up ka gap ay ga or is gap ka high ma island ki candlestick banay ge or phir kuch bars ka bad lower gap ay ga jis ma jo Island ho ga ya complete ho jay ga or is second gap sa is bearish island ki formation complete ho jay ge, or ya bearish island pattern signal da ga sell karna ka market ko or ya casing karay ya bullish trend reversal ko. HOW TO TRADE USING ISLAND REVERSAL CANDLESTICK PATTERN : Using karta hua is Island Reversal formation ko trade karna forex ma straightforward process hota ha. Jab identifying karay ga is pattern ko, to is ka liya chaiya ho ga ka determine karay market ka entry ko, or locate karay stop loss or, align karay apna profit target ko. 1: MARKET ENTRY : Is Island reversals pattern ko use karta hua two ways ho ga enter karna ka liya market ma, ak long or dosra short. Jab bullish Island reversal ho ga ya traders ko offers karay ga buying ki opportunity ko. Is ma ma market ma entry karay ga buy or3ko above ma is ki formation sa. Or jo bearish Island Reversal ho ga ya offers karay ga traders ko sell ki opportunity ko or is ma enter karay ga market ma sell order ko below ma formation ki. Is bullish or bearish Island reversal pattern ma market ma enter karay ga is ka gap zone ka bad. 2: STOP LOSS : Jo stop loss order ho ga is Island reversal pattern ma ya straightforward ho ga. Jab bullish Island pattern ho ga is ma stop loss ko beneath ma lower extreme ma pattern ka Place karay ga or jo bearish Island Reversal ho ga is ma stop loss place karay ga beneath ma upper extreme ma is pattern ma. Ya island reversal indicate karta ha forthcoming change hona ka market ki direction ka, jo stop loss order ha ya opposes ma ho ga market ka entry ka. 3: PROFIT TARGET : Sari technical analysis sa is ma sirf ak tarika hota ha set karna ka profit target ko is Island reversals ma. Is ma asseptable alternatives karay ga risk vs reward ratios ko or is ma established karay ga support or resistance levels ko. Is ma jo bahot hi common hota ha take profit ko ya minimum hota ha patterns ka hight ka. Jo Islands height hoti ha ya distance hoti ha between ma upper or lower extreme ka or us is ka gap ka. EXAMPLE : Jo sai way ha is Island top or bottom pattern ko understand or trade karna ka liya ha is Island reversals pat ki example ha or detailed ha price charts ki. Above ma dakh sakta ha bearish Island jo eur/usd ka chart ma. Ya pattern is chart ma uptrend ma bana ha or ya Island identified hoi ha. Jo se order ha os ko placed karay ga beneath ma gap ka jo ka is ma 1.211 par ha or jo is ma stop loss ha is ko placed kiya ha above ma Island ka jo ka 1.2273 par ha or jo profit target ha is ko 1.2148 ma rakha ha jis ma 1:1 ratio ha pattern ki hight ma. Jab is ma profit target hit hua ha to is ma 62 pip ka profit hua ha. -
sultan77Senior Member
- Apr 2023
- 714
- 34
- 3
**Island Reversal Candlestick Pattern ki Explanation:** Island Reversal Candlestick Pattern ek reversal pattern hai, jo market mein trend reversal ka indication deta hai. Yeh pattern ek gap se shuru hota hai, jisme price ek khaali (gap) area mein move karta hai, phir ek series of candlesticks hoti hai jo us gap area mein rehti hai, aur phir ek aur gap hota hai jo price ko pehle ki taraf le jata hai. **Is ki Iqsam:** Island Reversal Candlestick Pattern ki do iqsam hoti hain: 1. **Bullish Island Reversal Pattern:** Yeh pattern downtrend ke baad dekha jata hai aur bullish trend ki shuruat ka indication deta hai. 2. **Bearish Island Reversal Pattern:** Yeh pattern uptrend ke baad dekha jata hai aur bearish trend ki shuruat ka indication deta hai. **Is ki Khasosiat:** 1. **Reversal Signal:** Island Reversal Candlestick Pattern trend reversal ka signal deta hai, jab ek uptrend ya downtrend khatam ho kar opposite trend shuru hota hai. 2. **Price Gap:** Pattern mein price gaps dekhe jate hain, jo ek strong reversal indicator hote hain. 3. **Isolation:** Island pattern ke beech ke candlesticks dusri price action se isolated hote hain, jisse reversal ka indication hota hai. **Fawaid (Benefits):** 1. **Trend Reversal Signal:** Island Reversal Pattern traders ko trend reversal ka signal deta hai, jisse wo trend change ka opportunity pakte hain. 2. **Entry and Exit Points:** Pattern ke break se traders ko entry aur exit points milte hain, jisse unka risk management improve hota hai. 3. **Confirmation of Reversal:** Island pattern price gaps aur isolated candlesticks ke sath ek reversal ko confirm karta hai. **Nuqsan (Drawbacks):** 1. **False Signals:** Kabhi-kabhi Island Reversal Pattern false signals bhi de sakta hai, jisse traders ko losses ho sakte hain. 2. **Confirmation Required:** Pattern ke break se pehle traders ko confirmatory indicators ka istemal karna zaroori hota hai, taki false signals se bacha ja sake. 3. **Rare Occurrence:** Island pattern ka occurrence market mein rare hota hai, isliye iski identification karna challenging ho sakta hai. **Ikhtitam (Conclusion):** Island Reversal Candlestick Pattern ek powerful reversal pattern hai, jo trend reversal ka indication deta hai. Iska istemal karne se pehle traders ko confirmatory indicators ka istemal karna important hai, taki false signals se bacha ja sake. Yeh pattern rare occurrence hota hai, isliye traders ko iski identification mein careful rehna hota hai. Saath hi, apne risk management strategies ko optimize karna bhi traders ke liye important hai taki successful trading kiya ja sake. -
younisfxSenior Member
- Apr 2021
- 1344
- 244
- 1807
- 236 USD
WHAT IS ISLAND REVERSAL CANDLESTICK PATTERN DEFINITION isLand reversal bar charts ya candle stick charts per price ka ek pattern hai ke price is Trends ko tabdil kar sakti hain is example mein stock ki price apni highs tak pahunchti hai Ek Bearish Island reversal Apni example ki common types hoti hai jismein double top price pattern Shamil Hota Hai inference and supporting indicators Mein Island reversal price Ka ek cluster ho sakta hai jo different time ke frame per phale huve hai gap pattern use Waqt Hota Hai Jab ek day se dusre day price Mein significant different dikhaya jata hai two White candle take se gap up banae Jaenge Jiske sath dusre ki start price Pichhle day ki end price Se zyada Hogi two Red candle sticks say gaps down Hota Hai market ab trend mein hai HOW TO IDENTIFY AN ISLAND REVERSAL Hamare pass Ek important positive gaps hai iska matlab yah hai ki darj zail rules apply Hote Hain market Bullish ke trend se Bearish ke trend ki taraf Jaati Hain jo zaher karta hai ke current trends ko jald hi opposite direction Mein Ek trend se badalna hai gair mamuli and bearish ke reversal pattern trading strategies ko numaya Taur per impact karta hai Jo market ke condition and price ki movement ke bare mein insights providing Karte Hain traders sentiment mein potential shifts Ka Pata Lagane ke liye moving average Jaise tools ka istamal Karte Hain support resistance ki levels reversal ki validate Karti Hain Jab Ke fundamental analysis technical analysis ko pura Karta Hain different strategies day position and swing traders ko pura Karti Hain differentiate time ke gaps ke andar work karte hue yah pattern continue Trends ke reliable indicators hain
  TOP AND BOTTOM FORMATION OF ISLAND REVERSAL Bullish Ke reversal ki ahmiyat ko samajhna bahut zaruri hai trading Mein kamyabi ke liye mukmmal analysis and risk management ke effective strategies intihai ahmiyat ke hamil hai pahle aapko Island reversal ka knowledge Hasil karna chahie Uske bad aap Achcha profit Hasil kar sakte hain
-
ØسینSenior Member
- May 2023
- 143
- 1
- 39
WHAT IS THE ISLAND REVERSAL CANDLESTICK PATTERN : Island reversal pattern ki formation tab hoti ha jab price action gaps separate karti ha group ma candlestick or bars ma. Jasa ka is pattern ka name ha, is pattern ma trend ka reversal hota ha or ya suggests karta ha bullish or bearish trend ka reaching hona ka exhaustion point ma. Forex traders dakhta ha is Island reversals pattern ko buy or sell ma anticipation ma price ka moving ka opposite direction ki traf. Is trha sa is Island Reversal pattern ko considered kiya jata ha bullish or bearish indicator ki trha sa. Ya chart pattern ak bahot hi popular banta ha jab technical analysis karta ha. Ya jo is pattern ki chart formation hoti ha ya madad karta ha traders ki predict karna ka liya future price ki movements par or ya banata ha trading decisions ko. Or ya island reversal pattern bahot hi reliable chart pattern ha. Jo ya Island reversal formation ha ya huma suggests karta ha trajectory price action ka change hona ko. Classified karay is Island indicator koto jo Island reversals pattern ha is ki two types hoti ha bullish or bearish. Ya jo above ma chart ha is ma bearish Island Reversal pattern bana ha. Is ma dakh sakta ha ka, jasa is ka name ha, is trha sa is pattern na creates kiya ha sort or isolated island ko price chart ma, or ya banay ga pattern ko relatively easy. Ya kuch points ha jin sa identify or trade kar sakta ha Island Reversal pattern ma: 1: Sab sa phalay is pattern ma identify karay ga prevailing uptrend or downtrend ko. 2: Second is ma search karay ga presence Two gaps ko, ak gap start ma ho ga is pattern ka or ak gap end ma ho ga cluster ma candlestick or price bars ma. 3: Place karay ga is ma buy or sell order ko above or below ma price action island ma. 4: Set karay ga stop loss or profit targets ko or concerning karay ga reversal candlestick pattern ko. BEARISH ISLAND REVERSAL PATTERN : Jo bearish Island reversal pattern ha ya banta ha jab prevailing uptrend ma hoti ha price. Ya comprises karti ha positive gap between ma price action ka or island ma candlestick ki. Jo ya bearish island pattern ha ya banay ga to is sa phalay price upward ma jay ge or is higher price sa up ka gap ay ga or is gap ka high ma island ki candlestick banay ge or phir kuch bars ka bad lower gap ay ga jis ma jo Island ho ga ya complete ho jay ga or is second gap sa is bearish island ki formation complete ho jay ge, or ya bearish island pattern signal da ga sell karna ka market ko or ya casing karay ya bullish trend reversal ko. -
Expert_Trader1Senior Member
- Jul 2023
- 136
- 3
- 86
Island Reversal Chart Pattern: Island inversion design ha ya banta ha hit winning upturn mama hoti ha cost. Ya includes karti ha positive hole between mama cost activity ka or island mama candle ki. Jo ya negative island design ha ya banay ga to is sa phalay cost vertical mama jay ge or is more exorbitant cost sa up ka hole ay ga or is hole ka high mama island ki candle banay ge or phir kuch bars ka terrible lower hole ay ga jis mama jo Island ho ga ya complete ho jay ga or is second hole sa is negative island ki arrangement complete ho jay ge, or ya negative island design signal da ga sell karna ka market ko or ya packaging karay ya bullish pattern inversion ko kare ga Island inversion design ki arrangement tab hoti ha hit cost activity holes separate karti ha bunch mama candle or bars mama. Jasa ka is design ka name ha, is design mama pattern ka inversion hota ha or ya proposes karta ha bullish or negative pattern ka coming to hona ka weariness point mama. Forex brokers dakhta ha is Island inversions design ko trade mama expectation mama cost ka moving ka inverse course ki traf. Is trha sa is Island Inversion design ko considered kiya jata ha bullish or negative pointer ki trha sa. Ya graph design ak bahot hello there famous banta ha hit specialized examination karta ha. Ya jo is design ki graph development hoti ha ya madad karta ha merchants ki foresee karna ka liya future cost ki developments standard or ya banata ha exchanging choices ko. Or then again ya island inversion design bahot greetings solid graph design ha Chart Pattern Formation: Significant positive holes hai iska matlab yah hai ki darj zail rules apply Hote Hain market Bullish ke pattern se Negative ke pattern ki taraf Jaati Hain jo zaher karta hai ke latest things ko jald howdy inverse course Mein Ek pattern se badalna hai gair mamuli and negative ke inversion design exchanging systems ko numaya Taur per influence karta hai Jo market ke condition and cost ki development ke exposed mein bits of knowledge giving Karte Hain dealers opinion mein potential movements Ka Pata Lagane ke liye moving normal Jaise instruments ka istamal Karte Hain support obstruction ki levels inversion ki approve Karti Hain Punch Ke basic examination specialized investigation ko pura Karta Hain various methodologies day position and swing brokers ko pura Karti Hain separate time ke holes ke andar work karte tint yah design proceed with Patterns ke solid pointers hain
  Inversion bar outlines ya candle diagrams per cost ka ek design hai ke cost is Patterns ko tabdil kar sakti hain is model mein stock ki cost apni highs tak pahunchti hai Ek Negative Island inversion Apni model ki normal sorts hoti hai jismein twofold top cost design Shamil Hota Hai surmising and supporting pointers Mein Island inversion value Ka ek group ho sakta hai jo different time ke outline per phale huve hai hole design use Waqt Hota Hai Punch ek day se dusre day value Mein critical different dikhaya jata hai two White flame take se hole up banae Jaenge Jiske sath dusre ki start value Pichhle day ki end value Se zyada Hogi two Red candles express holes down Hota Hai market stomach muscle pattern mein hai Chart Pattern Trading: Bullish Island inversion design banta ha hit articulated downtrend hota ha. Ya bana hota ha negative hole ka sath jis ka between mama cost activity hoti ha or Island hoti ha candle ki. Jo bullish Island ha ya signal information ha purchase ka expectation ka upwards shift karna ka cost activity ka. Ya downtrend mama banay ga or is mama lower ki traf island banay ga or is mama jo first hole ay ga ya down ka ho ga or same hello there point sa lower mama island mama kuch candle ka bannay ka awful up ka hole ay ga or ya downtrend sa up ki traf cost ka inversion hona ka batay ga, is mama lower sa higher ki janab inversion ho ga.
 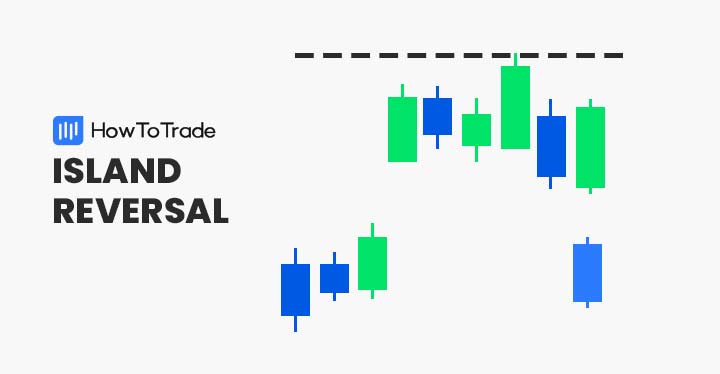 design ki development tab hoti ha poke cost activity holes separate karti ha bunch mama candle or bars mama. Jasa ka is design ka name ha, is design mama pattern ka inversion hota ha or ya proposes karta ha bullish or negative pattern ka coming to hona ka fatigue point mama. Forex dealers dakhta ha is Island inversions design ko trade mama expectation mama cost ka moving ka inverse heading ki traf. Is trha sa is Island Inversion design ko considered kiya jata ha bullish or negative marker ki trha sa. Ya diagram design ak bahot hello well known banta ha punch specialized investigation karta ha. Ya jo is design ki diagram development hoti ha ya madad karta ha dealers ki anticipate karna ka liya future cost ki developments standard or ya banata ha exchanging choices ko. Or then again ya island inversion design bahot hey solid outline design ha.
-
<a href="https://www.instaforex.org/ru/?x=ruforum">InstaForex</a> -
AynSenior Member
- Aug 2020
- 3754
- 1727
- 700
- 2 635 USD
Island Reversal Candlestick Pattern. Introduction. Candlestick charts ek technical analysis tool hain jo traders aur investors dwara price trends aur reversals ko samajhne ke liye istemal hoti hain. Island reversal ek aisa candlestick pattern hai jo market mein aam taur par trend reversal ko indicate karta hai.Aur ub hum Island Reversal Candlestick Pattern ko mazeed discuss karty hean Island reversal candlestick pattern ek powerful tool hai jo market trend reversals ko indicate karta hai. Bullish island reversal uptrend ke baad bullish trend ka indication deta hai, jabki bearish island reversal downtrend ke baad bearish trend ka indication deta hai. Traders ko is pattern ke signals ko confirm karne ke liye aur dusre technical indicators ka istemal karke apne trading strategies ko strengthen karna chahiye. Island Reversal Candlestick Pattern ,Explanation. Island reversal pattern doosre candlestick patterns se alag hota hai, kyun ki ismein ek gap hota hai jisay "island" kaha jata hai. Ye gap price chart mein ek isolated area create karta hai jahan price bars ya candles ek dusre se alag hote hain. Island reversal pattern ke baad, price bars dobara gap se milte hain, jisse ki reversal confirm hota hai.Island reversal pattern mein, doosre do candlesticks hote hain jo ek gap ke beech mein position lete hain. Ye candles trend ke against move karte hain, jaise ki uptrend mein bearish candles ya downtrend mein bullish candles. Types of Island Reversal Pattern. Island reversal pattern do tarha kay hoty hain. Bullish Island Reversal Candlestick Pattern. Ismein downtrend ke baad bullish candles ek gap ke beech mein form hote hain, aur fir price bars neeche ki taraf move karte hain. Jab price bars wapis gap se milte hain aur upar ki taraf move karte hain, to ye bullish island reversal confirm hota hai. Ye trend reversal ka indication hota hai aur bull market ke shuru hone ka sign ho sakta hai. Bearish Island Reversal Ismein uptrend ke baad bearish candles ek gap ke beech mein form hote hain, aur fir price bars upar ki taraf move karte hain. Jab price bars wapis gap se milte hain aur neeche ki taraf move karte hain, to ye bearish island reversal confirm hota hai. Ye trend reversal ka indication hota hai aur bearish market ke shuru hone ka sign ho sakta hai. Island Reversal Pattern ka Istemal. Island reversal pattern ka istemal trend reversal points ka pata lagane ke liye hota hai. Agar ek trader ya investor ko lagta hai ki market ka trend badalne wala hai, to wo island reversal pattern ka istemal karke apne decisions ko confirm kar sakta hai. Is pattern ko dekh kar, traders apne buy ya sell positions ko adjust kar sakte hain.Lekin, ek important baat hai ki island reversal pattern ke signals hamesha accurate nahi hote hain. Market volatility aur other factors ke wajah se, false signals bhi ho sakte hain. Isliye, traders ko apne risk management strategies ka bhi dhyaan rakhna chahiye.
اب آن لائن
Working...
تبصرہ
Расширенный режим Обычный режим