Explaination Of Bearish long legged doji
-
SkydiversSenior Member
- Mar 2023
- 1172
- 239
- 367
- 476 USD
-
<a href="https://www.instaforex.org/ru/?x=ruforum">InstaForex</a> -
SkydiversSenior Member
- Mar 2023
- 1172
- 239
- 367
- 476 USD
Bearish Long Legged Doji ek mumtaz candlestick pattern hai jo technical analysis mein use kiya jata hai share market aur financial markets mein price movement aur trends ko samajhne ke liye. Candlestick patterns, price charts mein candlestick bars ki madad se price movement ko visually represent karte hain. In patterns ka istemal traders aur investors price ki direction aur reversal points ka pata lagane ke liye karte hain. Bearish Long Legged Doji ek bearish reversal pattern hai, jo market mein uptrend ke baad dikhai deta hai aur bearish trend ki shuruat ko indicate karta hai. Is pattern mein candlestick ki body ke size chota hota hai aur dono taraf shadows (ya wicks) lambi hoti hain. Iski body bilkul ya kareeb-kareeb kisi specific price level ke paas hoti hai, aur iski shadows us price level se bahar extend hoti hain. Candlestick mein 3 main components hote hain: body, upper shadow (ya upper wick), aur lower shadow (ya lower wick). Agar candlestick bearish hai toh body, open price se close price ke beech mein hoti hai. Jabki bullish candlestick mein, body close price se open price ke beech hoti hai. Bearish Long Legged Doji pattern mein, body ke size chota hota hai ya kareeb-kareeb kisi specific price level ke barabar hota hai. Iska matlab hai ki opening price aur closing price ek doosre ke kareeb hote hain, jisse body ki length kam hoti hai. Lekin is pattern ki khaas baat hoti hai uski lambi shadows. Upper shadow, candlestick ke top se extend hota hai aur lower shadow, candlestick ke bottom se extend hota hai. Is pattern mein upper aur lower shadows ki lambai barabar hoti hai ya kareeb-kareeb barabar hoti hai, jisse candlestick ek crucifix ya plus sign jaisa dikhta hai. Isliye ise Long Legged Doji kaha jata hai. Agar body ka size chota hai toh isko Long Legged Gravestone Doji kaha jata hai, aur agar body ka size bada hai toh isko Long Legged Dragonfly Doji kaha jata hai. Bearish Long Legged Doji pattern ko samajhne ke liye ek example dekhte hain, Imagine karein ki ek stock ka price chart hai, jismein consecutive days ke candlesticks dikh rahe hain. Dusra last day ka candlestick Bearish Long Legged Doji pattern hai. Opening Price: $100 Closing Price: $100 High Price: $105 Low Price: $95
 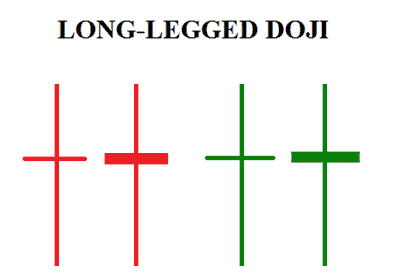 Is candlestick mein body ke size bahut chota hai, kyunki opening price aur closing price ek doosre ke kareeb hain. Body almost aik line ki tarah dikhti hai. Upper shadow, high price ($105) se start hota hai aur body tak extend hota hai, jisse upper shadow ki lambai $5 hai. Lower shadow, low price ($95) se start hota hai aur body tak extend hota hai, jisse lower shadow ki lambai bhi $5 hai. Is example mein, Bearish Long Legged Doji pattern dikh raha hai. Yeh pattern bearish reversal signal hai, kyunki uptrend ke baad dikhai deta hai. Price ke upar se niche move hone ki wajah se market sentiment change ho rahi hai aur bearish trend shuru hone ki chances hai. Traders aur investors is pattern ko samajh kar apni trading strategies mein incorporate karte hain. Jab Bearish Long Legged Doji pattern dikhe, toh log apni existing long positions ko close kar sakte hain ya short positions enter kar sakte hain, expecting ki price down jayega. Lekin, ek pattern ko samajhne se pehle, dusri technical indicators aur price patterns ka bhi analysis karna zaroori hai. Candlestick patterns ek tool hote hain, lekin unki accuracy ko confirm karne ke liye aur dusre signals ko samajhne ke liye, comprehensive analysis ki zaroorat hoti hai.
Believe in yourself and your abilities. When you fight for your dreams, you can achieve anything.
Is candlestick mein body ke size bahut chota hai, kyunki opening price aur closing price ek doosre ke kareeb hain. Body almost aik line ki tarah dikhti hai. Upper shadow, high price ($105) se start hota hai aur body tak extend hota hai, jisse upper shadow ki lambai $5 hai. Lower shadow, low price ($95) se start hota hai aur body tak extend hota hai, jisse lower shadow ki lambai bhi $5 hai. Is example mein, Bearish Long Legged Doji pattern dikh raha hai. Yeh pattern bearish reversal signal hai, kyunki uptrend ke baad dikhai deta hai. Price ke upar se niche move hone ki wajah se market sentiment change ho rahi hai aur bearish trend shuru hone ki chances hai. Traders aur investors is pattern ko samajh kar apni trading strategies mein incorporate karte hain. Jab Bearish Long Legged Doji pattern dikhe, toh log apni existing long positions ko close kar sakte hain ya short positions enter kar sakte hain, expecting ki price down jayega. Lekin, ek pattern ko samajhne se pehle, dusri technical indicators aur price patterns ka bhi analysis karna zaroori hai. Candlestick patterns ek tool hote hain, lekin unki accuracy ko confirm karne ke liye aur dusre signals ko samajhne ke liye, comprehensive analysis ki zaroorat hoti hai.
Believe in yourself and your abilities. When you fight for your dreams, you can achieve anything.
-
Realone98Senior Member
- Nov 2022
- 3124
- 34
- 245
- 1 607 USD
InstaSpot: کسی بھی EPS اور بینک سے منافع واپس لیں، اور EPS اور cryptocurrencies کے تبادلے پر 7% تک کمائیں۔
Assalamu Alaikum Dosto!Long-legged Doji Candle
Long-legged doji, ek single-bar Japanese candlestick pattern hai (jo technical analysis mein istemal hota hai) aur ye market ke faislay ki tafteesh ko ishara deta hai. Ye candlestick pattern doji candles ki family mein aata hai, aur is ke naam is ke khas appearance se mila hai. Is mein lambi upper aur lower shadows (ya wicks) ke darmiyan aik chhota body hota hai. Tasavvur se, ye aik cross ya plus sign ki tarah nazar aata hai, jo buyers aur sellers ke darmiyan ek balance ke halat ko dikhata hai.
Key Points- Long-legged doji candlestick ka sab se aham khasiyat ye hai ke is ke bari upper aur lower shadows se market ke uncertainty ko pesh karti hai.
- Ye ek moassar tareeqa pesh karti hai precise stop-loss placement ka, jo acha risk-to-reward ratio ke sath trading ke mauqe banata hai.
- Long-legged doji bohat versatile hai. Is ki quwatein mukhtalif crypto assets par aur har wakt ke candlestick charts par numaya ho sakti hain, jis se ye diverse trading styles jaise ke day trading, swing trading, aur long-term investing mein istemal ki ja sakti hai.
Long-legged doji candlestick structure
Long-legged doji market ke intense indecision aur potential price reversal ki aik lamha ko darust karta hai. Is ke lambay shadows ye ishara dete hain ke prices ek trading session ke doran mazeed fluctuation guzar chuki hain, lekin closing price opening price ke qareeb hai. Is balance ne bullish aur bearish forces ke darmiyan ek jang ki alamat hai, jis mein asset ki direction par control ke liye aik lalkara hai.
Ek forex, stock ya crypto trader ke tor par, long-legged doji candle ko samajhna ahem hai. Ye pattern aik mashhoor signal hai ke maujooda trend momentum kho sakta hai aur aik price reversal hone ka imkan hai. Lekin trading faislon ko banane se pehle is pattern ko bade market context ke andar dekhein aur doosre technical indicators ko mad-e-nazar rakhein. Long-legged doji pattern tab sab se taqatwar hota hai jab ye ek mustaqil trend ke baad ata hai, potential trend reversal ya significant retracement ko ishara kar sakti hai.
Long-Legged Doji Ko Pehchanna
Long-legged doji candlestick pattern ko qeemat wale insights hasil karne wale crypto traders ke liye isay price fluctuations ke liye aik ahem hunar hai. Long-legged doji candles ko har crypto candlestick chart par paaya ja sakta hai, aur ye tamam chart time frames par dekhi ja sakti hain. Is makhsoos candlestick pattern ko pehchanne ke liye traders ko iske aham features par tawajjo deni chahiye.- Extended Shadows (ya Wicks): Long-legged doji candlestick ka markazi pehchan ye hai ke is ke lambi upper aur lower shadows hote hain, jis se is pattern ko chart par numaya hone wale aik lambay range ke hisse banata hai. Ye lambi wicks dikhate hain ke trading period ke doran prices mein wazeh volatility hoti hai.
- Small Body: Long-legged doji candlestick ka markazi body aam taur par choti hoti hai aur overall chart pattern ke darmiyan mein hoti hai. Iska matlab hai ke opening aur closing prices aik dosre ke qareeb hote hain, jo market ke indecision ko dikhata hai.
- Colorless: Candle ki rang (chahe woh filled ho ya hollow ho) long-legged dojis ko pehchane mein itni ahmiyat nahi rakhti. Isse zyada ahem hai ke aap ek chota candle body dekhein.
- Surrounding Trends: Pehchan ke tajwez ke aquracy ko behtar banane ke liye, traders ko long-legged doji candle ko mukhtalif context mein dekhein chahiye. Ye aksar aik mustaqil uptrend ya downtrend ke baad ata hai, potential trend reversal ya significant retracement ka ishara karte hue.
- Confirmation: Long-legged doji candlestick ki dikhawat aik aham signal hai, lekin traders ko faislon ke liye sirf is par yaqeen na karain. Aik potential reversal ko tasdeeq karne ke liye doosre technical indicators jaise trend lines, moving averages, aur volume ko mad-e-nazar rakhein.
Long-legged doji ko pehchanne ke hunar ko mazbooti se barhakar, crypto traders market sentiment mein tabdeeliyon ko behtar andaza laga sakte hain aur behtar trading faislon ko kar sakte hain.
Trading
Long-legged doji candlestick ko trading karna aik maqsadpesh tareeqe se karna chahiye jo is ke khasiyat aur potential effects ko mad-e-nazar rakhta hai. Neche di gai hai aik guide ke tor par long-legged doji pattern ko effectively trade karne ke liye. Sab se pehle, bari trend ke context ko tafteesh karein. Long-legged doji candle ki dikhawat fauran action lene ke bajaye ehtiyaat ka sabab banna chahiye. Aapko is pattern ke mukammal hone ka intezar karne ki zarurat hoti hai, jis doran aap doji ke hone se pehle price trends ko tafteesh kar sakte hain.
Next, doji ke high ya low ke qareeb support aur resistance talash karein. Agar market aik downtrend mein hai aur long-legged doji support ke qareeb banti hai, to is se potential bullish reversal ka ishara hota hai. Dusri taraf, agar market uptrend mein hai aur doji resistance ke qareeb aati hai, to ye ek potential bearish reversal ka ishara kar sakti hai.
Long-Legged Doji Ke Pros aur Cons
Long-legged doji candlestick pattern ke fawaid aur mehdoodiyat ko samajh kar aap behtar trading faislon ko kar sakte hain.- Advantages:
- Market Indecision Ki Isharat: Long-legged doji ki primary quwat market indecision ko zahir karne mein hoti hai. Lambi upper aur lower wicks ye dikhate hain ke trading period ke doran buyers aur sellers dono ko considerable influence rakhta hai, jis se aik standoff hasil hota hai. Ye potential trend reversal ya trend ki kamzori ke liye aik ahem manhane ka zariya ban sakta hai.
- Early Reversal Signal: Jab long-legged doji candlestick aik mustaqil uptrend ke baad ya support ke qareeb ya aik mustaqil downtrend ke baad near support aati hai, to ye potential trend reversal ka early signal ho sakta hai. Traders jo sahi context mein is pattern ko pa lete hain, woh market ke aham shift se pehle apni position bana sakte hain.
- Tafseelat Ke Mukhtalif Time Frames Mein Istemal: Long-legged doji ke asar kisi khas time frame par mehdood nahi hoti. Is pattern ko mukhtalif time frames par pehchana ja sakta hai, chunacha is ki adaptability traders ko is ke principles ko mukhtalif trading styles mein istemal karne ki ijazat deti hai, jaise ke day traders, swing traders, aur long-term investors ke liye ek ahem tool banti hai.
- Disadvantages:
- False Signals: Jaise ke kai technical candlestick patterns, long-legged doji false signals peda karne mein mehdood nahi hoti. Market conditions, news events, ya sudden price spikes is pattern ke mutazir anasir ko pareshan kar sakte hain, jin se nakaarane trading results hasil hoti hain.
- Confirmation Ki Zarurat: Sirf candlestick pattern ki dikhawat par bharosa karna risky ho sakta hai. Traders ko trading faislon se pehle doosre technical indicators, trend analysis, ya price action se tasdeeq hasil karne ki zarurat hoti hai. Kabhi kabhi isse entry ko delay kar sakti hai aur pattern par amal karne ki jald bazi kam ho sakti hai.
- Subjectivity: Long-legged doji ko pehchanna hamesha seedha nahi hota, kyun ke is ki visual dikhawat mutabadil ho sakti hai. Traders is ke lambay aur aksrat ko mukhtalif tarikon se samjhein, jis se analysis aur trading decisions mein izafon ki surat mein farq ho sakta hai.
Long-legged doji candlestick pattern jab bhi aik early signal aur potential reversals ke liye ahem insights pesh kar sakti hai, traders ko chaukasi se rehna chahiye, sahi risk management istemal karna chahiye, aur apni analysis ko is ke asar ko ziyada banane ke liye doosre indicators ke sath mukhtalif karna chahiye.
Long-Legged Doji vs Others Doji Patterns
Candlestick patterns ke duniya mein, long-legged doji apni khasiyat ke liye mashhoor hai. Long-legged doji aur is ke mutasaddirin ke darmiyan farqat samajhna aik trader ko behtar aur soch samajh kar faislay karne mein madadgar ho sakti hai.
Classic doji pattern ke mukablay mein, jis mein upper aur lower wicks tajwez ke sath hote hain, long-legged doji mein wicks lambe hoti hain, jo ke izhar-e-ray aur uncertainty ko zahir karte hain. Ye farq long-legged doji ko numaya hone wale ziyada bare market shifts ki taraf ishara karne ke ikhtiyar deta hai.
Dragonfly doji aur gravestone doji ke baraks, jo ke baray aur lambay upper shadows hote hain, long-legged doji balance qaim karti hai, jo ke bulls aur bears ke darmiyan barabar mawazna dikhata hai. Ye darmiyan position aksar control ke liye barh jata hai, traders ki tawajjo ko qubool karta hai aur possible trend reversals ki taraf ishara karta hai.
Char-price doji ke mukablay mein, jahan open, close, high, aur low prices ek hi level par hote hain, long-legged doji ke upper aur lower wicks dono hoti hain. Char-price doji bas ye batata hai ke market dead hai aur thori si price movement hai, jabke long-legged version buyers aur sellers ke darmiyan lalkara dikhata hai.
Long-legged doji ko doosre doji formations ke sath mawazna karke, crypto traders market sentiment ko behtar samajh sakte hain aur achi tarah se soch samajh kar trading strategies tayar kar sakte hain. Jabke long-legged doji uncertainty aur potential trend shifts ko zahir karta hai, isse doosre doji formations ke sath juxapoz karna traders ko price action aur technical analysis ke behtareen context ke andar iski ahmiyat tasdeeq karne mein madadgar hoti hai. -
1saniaSenior Member

- Feb 2022
- 697
- 236
- 85
- 299 USD
Long-Legged Doji Candlestick Pattern: A Comprehensive Guide
Tehqeeqat: Long-Legged Doji ek ahem candlestick pattern hai jo traders ke liye market ke indecision aur ane wale reversals ko signal karne ki salahiyat ke liye mashhoor hai. Is mukammal rehnumai mein, hum Long-Legged Doji candlestick pattern ke tasavvur, wujood, tawil, samajh, aur iski amli istemalat par ghor karenge. Is pattern ko samajhna traders ko aitmaad ke saath trading faislay karne aur maali asaratein samajhne mein madad deta hai.
Candlestick Patterns Samajhna: Long-Legged Doji pattern ki tafseelat par ghusne se pehle, candlestick patterns ka aam tasawwur hona zaroori hai. Candlestick charts aik makhsoos waqt ke doraan ke price movements ko tasweer mein pesh karte hain, har candlestick mein kholne, buland, past, aur band price shamil hoti hai. Ye patterns market ke jazbat ko tasweer mein pesh karte hain, traders ko mumkinah price movements ke liye tayyar karke faislay karne mein madad karte hain. Candlestick patterns mukhtalif shaklon mein aate hain, har aik ke liye market analysis aur samajh ke alag ma'ani hoti hain.
Long-Legged Doji Pattern Ki Jhalak: Long-Legged Doji aik single candlestick pattern hai jo aik chhote se haqiqi jism ke sath lambi ooper aur neechay ki roshniyan wali patli sair ki taraf dikhata hai. Ye banta hai jab kholne aur band hone wali keemat ek dosre se mukhtalif hoti hai, aik bareek ya adhura jism ka natija hota hai, jabke roshniyan jism ke ooper aur neechay lambi hoti hain. Long-Legged Doji tawazun ke doran aik period ko darust karta hai jab kharidari aur farokhtari dono ka mukhalefa hota hai, halanki koi bhi kisi taraf ka khasa nahi bana pata.
Long-Legged Doji Pattern Ka Wujood:
Long-Legged Doji pattern ki tashkeel aam tor par ahem support ya resistance levels par hoti hai, jo potential trend reversals ya continuation ko darust karta hai. Traders tasawwur karte hain:- Barabar Kholne Aur Band Hone Wali Keemat: Long-Legged Doji pattern banta hai jab kholne aur band hone wali keemat ek dosre se mukhtalif hoti hai, aik chhota ya adhura asli jism ka natija hota hai. Ye barabari kharidar aur farokhtari ke darmiyan tawazun ki ishara deti hai, jahan kisi bhi group ko trading session ke doran mustaqbil mehfooz nahi kar sakta.
- Lambi Ooper Aur Neechay Ki Roshniyan: Long-Legged Doji ka pehchanne wala aham feature iske ooper aur neechay lambi roshniyan hain, jo jism ke ooper aur neechay phail jati hain. Ye lambi roshniyan ahem price fluctuations ko dikhate hain, jo session ke doran shiddat se kharidari aur farokhtari dabao ko zahir karte hain.
- Market Ka Mahol: Long-Legged Doji pattern ka ahamiyat barh jati hai jab ye ek lambi doray uptrend ya downtrend ke doraan hota hai, jaise hi ye potential trend reversals ya continuations ko darust karta hai.
Long-Legged Doji Pattern Ki Tabeer:
Long-Legged Doji pattern ka asar dar tabeer hone ke liye kai factors ka ghor karna zaroori hai, jaise:- Market Ka Mahol: Traders Long-Legged Doji ke tashkeel hone se pehle mojooda market trends aur price action ka tawajjo dena zaroori hai. Pattern ka asar doran ki significance ka farq uptrend, downtrend, ya consolidation phase mein hone par hota hai.
- Volume Analysis: Long-Legged Doji pattern ke sath sath trading volume ka jayeza lena pattern ki ehmiyat ko tasdeeq dene mein madadgar ho sakta hai. Pattern ke tashkeel ke doran trading volume mein izafa barhne ka matlab hai ke market mein shirakat mein izafa hua hai aur iski reliability ko barhata hai.
- Tasdeeqi Signals: Traders aksar Long-Legged Doji pattern ki tasdeeq ke liye doosre technical indicators ya chart patterns ka intezar karte hain. Additional confirmation pattern ki prediction quwat mein izafa karti hai aur kamiyabi ke trades ki imkanaat ko barhati hai.

Trading Mein Strateegiati Asarat:
Long-Legged Doji pattern traders ke liye kai strategic asaratein pesh karta hai:- Reversal Signal: Ek reversal pattern ke tor par, Long-Legged Doji market jazbat aur trend ki raah ka potential tabadla darust karta hai. Traders pattern ke zahir hone ko signal samajhte hain takay wo mojooda positions se nikal saken ya naye trades ke liye intekhab kar saken.
- Continuation Signal: Kuch cases mein, Long-Legged Doji pattern mojooda trend ke chalne ka continuation darust karta hai na ke ek reversal. Traders zayada se zayada market ke mahol ke context mein pattern ko dekhte hain takay wo iska future price movements par kya asar darust karta hai samajh sakein.
- Risk Management: Long-Legged Doji pattern trading mein asar dar risk management ka tareeqa hai. Traders pattern ki tashkeel ke doran potential nuqsan ko had tak mehdood karne ke liye stop-loss orders lagate hain. Iske ilawa, wo pattern ki reliable hone aur tasdeeqi darajat ke mutabiq apne positions ka size adjust karte hain.
-
5GhazanSenior Member
- Jan 2024
- 615
- 1489
- 3100
- 216 USD
Explaination Of Bearish long legged doji
Bearish long-legged doji, ek candlestick pattern hai jo market mein bearish reversal ko darust karta hai. Ye pattern, ek lambi wick ke saath ek choti body wali doji candle ko darust karta hai. Is pattern ko samajhne ke liye, neeche di gayi tafseelat ka mutala karen:
1. Banawat (Structure):- Bearish long-legged doji pattern mein, candle ki body choti hoti hai jabke uski wick lambi hoti hai. Yeh batata hai ke price movement dono taraf se hua hai lekin candle ke close price open price ke qareeb hi hoti hai.
2. Bearish Reversal Signal (Bearish Tabdeeli Ka Nishan):- Bearish long-legged doji pattern bearish reversal signal hai. Is pattern ko dekh kar traders ko ye samajh aata hai ke market mein bearish momentum badh raha hai aur ab price neeche jane ka chance hai.
3. Sentiment (Jazbat):- Bearish long-legged doji pattern market mein bearish sentiment ko darust karta hai. Is pattern ko dekh kar traders sell ki position enter kar sakte hain ya phir existing long positions ko close kar sakte hain.
4. Market Dynamics (Market Ki Tabdeeliyan):- Is pattern ka dekhna traders ko ye batata hai ke buyers aur sellers ke darmiyan aik taqreeban barabar muqabla hai. Is tarah ka price action bearish reversal ko indicate karta hai.
5. Confirmation (Tasdeeq):- Bearish long-legged doji pattern ko confirm karne ke liye, traders ko doosre technical indicators aur confirmatory signals ka istemal karna chahiye. Is tarah se, pattern ki sahiyat aur reliability ko barhaya ja sakta hai.
6. Trading Strategy (Tijarat Ke Mansoobe):- Bearish long-legged doji pattern ko dekh kar traders short position enter kar sakte hain ya phir existing long positions ko close kar sakte hain. Stop-loss aur target levels set karne ke liye bhi is pattern ka istemal kiya ja sakta hai.
7. Practical Example (Amli Misal):- Bearish long-legged doji pattern ko samajhne ke liye, traders ko real-time forex charts aur past price action ka mutala karna chahiye. Is pattern ke mukhtalif examples ko dekh kar traders iski sahiyat ko samajh sakte hain.
8. Risk Management (Khatra Nigrani):- Hamesha yaad rakhein ke har trading decision ke liye risk management ka khayal rakha jana chahiye. Stop-loss aur target levels ko sahi taur par set karke, nuksan se bacha ja sakta hai.
9. Continued Monitoring (Jari Nazar):- Market mein tabdeeliyon ko dekhte rahein aur bearish long-legged doji pattern ki sahiyat aur asar ko samajhte rahein. Is tarah se, aap trading decisions ko improve kar sakte hain aur market trends ko behtar taur par samajh sakte hain.
Bearish long-legged doji pattern ek mufeed tool hai market mein bearish reversal ko detect karne ke liye. Lekin, jaise har pattern ki tarah, is pattern ki sahiyat ko confirm karne ke liye, doosre indicators aur analysis techniques ka istemal kiya jana chahiye.
-
Zohaib_AliSenior Member
- Dec 2022
- 845
- 66
- 190 USD
InstaSpot: کسی بھی EPS اور بینک سے منافع واپس لیں، اور EPS اور cryptocurrencies کے تبادلے پر 7% تک کمائیں۔
Bearish Long Legged DojiBearish Long Legged Doji Candlestick Pattern, jo ke technical analysis mein istemal hota hai, ek specific type ka candlestick pattern hai jo ek market trend reversal ko indicate karta hai. Is pattern ko samajhne ke liye, hume candlestick charts par focus karna hota hai jo ki price movements ko represent karte hain. Yeh pattern traders ko market ke direction ke bare mein useful insights provide karta hai.
Identification:
Bearish Long Legged Doji candlestick pattern ko identify karne ke liye, humein kuch key elements ko dekhna hota hai:- Body Size: Is pattern mein candle ka body size bahut chhota hota hai, jise doji kehte hain.
- Wicks: Candle ke upper aur lower sides par lambi wicks hoti hain, jo ki body ke comparison mein lambi hoti hain.
- No Real Body: Candle ka body almost nonexistent hota hai ya bahut chhota hota hai, jisse wicks zyada prominent nazar aate hain.
- Closing Price: Candle ka closing price open price ke kafi near hota hai, jisse ek line ki tarah lagta hai.
Advantages:
Bearish Long Legged Doji pattern ka istemal karne ke kuch advantages hain:- Trend Reversal Indicator: Yeh pattern market ke trend reversal ko indicate karta hai. Jab ek uptrend ke baad yeh pattern form hota hai, toh yeh bearish reversal ka signal deta hai.
- Market Sentiment: Is pattern ko dekh kar traders market sentiment ka analysis kar sakte hain. Agar ek bearish long legged doji candle form hota hai, toh yeh indicate karta hai ke buyers aur sellers ke beech mein equilibrium hai aur market mein uncertainty hai.
- Entry/Exit Points: Traders is pattern ka istemal karke apne entry aur exit points decide kar sakte hain. Agar trend reversal ka signal milta hai, toh traders apne positions ko adjust kar sakte hain ya naye positions le sakte hain.
- Risk Management: Is pattern ke samajhne se traders apni risk management strategies ko improve kar sakte hain. Agar ek bearish long legged doji pattern form hota hai, toh traders apni stop-loss orders set karke apne losses ko minimize kar sakte hain.
Explanation:
Bearish Long Legged Doji pattern ka explanation yeh hai ke jab market mein uncertainty aur indecision hoti hai, tab yeh pattern form hota hai. Is pattern mein candle ka body bahut chhota hota hai aur wicks lambi hoti hain, jo ki indicate karta hai ke buyers aur sellers ke beech mein balance hai aur kisi ek taraf ka dominance nahi hai. Candle ka closing price open price ke kafi near hota hai, jisse ek line ki tarah lagta hai.
Jab market mein ek uptrend ke baad yeh pattern form hota hai, toh yeh bearish reversal ka signal deta hai. Yeh indicate karta hai ke uptrend khatam ho sakta hai aur market mein bearish momentum shuru ho sakta hai. Traders is pattern ko dekh kar apne trading strategies ko adjust karte hain. Agar ek bearish long legged doji candle form hota hai, toh traders apne positions ko close karke short positions le sakte hain ya apne stop-loss orders set karke apne losses ko minimize kar sakte hain.
Yeh pattern market ke sentiment ka bhi indicator hai. Jab yeh pattern form hota hai, toh yeh indicate karta hai ke market mein uncertainty hai aur traders confused hain ke market ka direction kya hoga. Is situation mein, traders cautious hote hain aur apni positions ko monitor karte hain.
Conclusion:
Bearish Long Legged Doji candlestick pattern ek powerful tool hai jo traders ko market trends aur sentiment ka analysis karne mein madad karta hai. Is pattern ka istemal karke traders apne entry aur exit points decide kar sakte hain aur apni risk management strategies ko improve kar sakte hain. Yeh pattern market mein uncertainty aur indecision ko indicate karta hai aur bearish reversal ke signals provide karta hai. Traders ko is pattern ko samajh kar apne trading decisions ko better banana chahiye.
-
SuperMan23Senior Member
- Mar 2024
- 481
- 162
- 27
- 94 USD
Explaination Of Bearish long legged doji kia hy
Bearish Long-Legged Doji ek bearish reversal candlestick pattern hai jo market sentiment ke change ko darust karta hai. Yeh pattern typically uptrend ya sideways market ke baad dekha jata hai aur bearish reversal ki sambhavna ko indicate karta hai.
Is pattern ko identify karne ke liye, niche diye gaye characteristics ko dekha jata hai:- Long-Legged Doji Candlestick: Bearish Long-Legged Doji candlestick ek single candlestick se milta hai. Ismein open aur close price barabar ya kareeb hota hai aur do lambi shadows (ya wicks) hote hain, jo candlestick ke upper aur lower sides se extend hote hain. Yeh shadows usually upper aur lower price extremes ko darust karte hain, indicating ki price movement ke dauran buyers aur sellers dono active the.
- No or Small Body: Candlestick ka body chhota hota hai, jo open aur close price ke beech ka range ko darust karta hai. Ismein typically koi significant price movement nahi hoti, jo ki indecision aur market equilibrium ko indicate karta hai.
- Context: Bearish Long-Legged Doji typically uptrend ya sideways market ke baad dekha jata hai. Is pattern ko dekhte hue traders bearish reversal ki sambhavna ko samajhte hain.
Bearish Long-Legged Doji pattern bearish reversal ko suggest karta hai. Is pattern ko confirm karne ke liye, traders usually next candlestick ka price action dekhte hain. Agar next candlestick bearish momentum show karta hai aur price neeche jaata hai, toh Bearish Long-Legged Doji pattern ki validity increase hoti hai.
Traders typically Bearish Long-Legged Doji pattern ko identify karke short positions lete hain ya existing long positions ko close karte hain, expecting ki bearish trend shuru hone wala hai. Lekin, jaise har candlestick pattern ke saath, confirmation aur risk management ka istemal zaroori hai.
-
5RajpotSenior Member
- Dec 2023
- 365
- 243
- 189
- 155 USD
Explaination Of Bearish long legged doji kia hy
Bearish Long-Legged Doji, as the name suggests, is a candlestick pattern observed in financial charts that indicates potential bearish reversal in the market. Let's break down the components and the implications of this pattern in detail:- Bearish: It suggests a downward or negative sentiment in the market. This means that the prevailing trend might reverse or that there could be a potential downturn in prices.
- Long-Legged: This refers to the length of the candlestick's upper and lower shadows or wicks. In a Long-Legged Doji, these shadows are relatively long compared to the body of the candlestick. It indicates significant volatility and indecision in the market during the period represented by the candlestick.
- Doji: A Doji candlestick is one where the opening and closing prices are very close to each other, resulting in a very small or non-existent body. This reflects market indecision or equilibrium between buyers and sellers.
Putting it all together, a Bearish Long-Legged Doji forms when:- The opening and closing prices are very close to each other, resulting in a small or non-existent body (indicating indecision).
- The candlestick has long upper and lower shadows, indicating high volatility during the trading period.
- It appears after an uptrend, suggesting potential exhaustion of bullish momentum and a possible reversal to a downtrend.
The psychology behind this pattern is that despite the market attempting to push prices higher (indicated by the long upper shadow), sellers manage to push prices back down, resulting in a close near the opening price. This inability to sustain higher prices despite the effort signifies weakness and potential reversal.
Traders often interpret the appearance of a Bearish Long-Legged Doji as a signal to be cautious about further upward movement and to watch for potential bearish reversal signals. However, like any technical analysis tool, it's essential to consider other factors such as volume, trend strength, and support/resistance levels before making trading decisions based solely on this pattern.
-
Jana5Senior Member
- Feb 2024
- 220
- 93
- 68
- 72 USD
InstaSpot: کسی بھی EPS اور بینک سے منافع واپس لیں، اور EPS اور cryptocurrencies کے تبادلے پر 7% تک کمائیں۔
Explaination Of Bearish long legged doji kia hy
Bearish Long-Legged Doji ek candlestick pattern hai jo market mein potential reversal ke indication provide karta hai, specifically bearish trend ke against. Is pattern kaafi interesting hota hai kyunki iska formation market mein indecision ko highlight karta hai, jahan par buyers aur sellers ke beech mein tug of war hota hai. Chaliye, is pattern ko tafseel se samjhein:- Formation:
- Bearish Long-Legged Doji ek single candlestick pattern hota hai.
- Is pattern mein candlestick ke upper aur lower shadows, yaani ki wicks, normal se zyada lambi hoti hain.
- Candlestick ka body bahut chhota hota hai, jo indicate karta hai ki opening price aur closing price ke darmiyan mein negligible difference hai.
- Candlestick ke upper aur lower wicks, ya shadows, indicate karte hain ki during the trading session, price ne significant movement kiya, lekin by the end of the session, price wahi pe close hua jahan se start hua tha.
- Interpretation:
- Bearish Long-Legged Doji formation bearish trend ke against hota hai aur reversal ke indication provide karta hai.
- Is pattern ka formation indecision ko show karta hai market mein, jahan par bulls aur bears ke beech mein balance hota hai.
- Long upper aur lower shadows indicate karte hain ki during the session, price ne upar aur neeche significant levels tak jaane ki koshish ki thi, lekin end mein wapas original level pe aayi.
- Iska interpretation yeh hai ki bears initially price ko niche push karne ki koshish karte hain, lekin phir bulls intervene karte hain aur price ko wapas upar le jaate hain, ending mein price wahi pe close hoti hai jahan se start hui thi, indicating a struggle between buyers and sellers.
- Confirmation aur Trading Strategies:
- Bearish Long-Legged Doji ko confirm karne ke liye, traders usually wait karte hain for follow-up candlesticks, especially if the next candlestick is bearish.
- Agar ek bearish candlestick following the Bearish Long-Legged Doji pattern ke baad form hoti hai, toh ye bearish reversal ke liye strong confirmation provide karta hai.
- Traders is pattern ko dekhkar apne existing long positions ko close kar sakte hain aur short positions enter kar sakte hain, expecting a reversal in the bearish direction.
Bearish Long-Legged Doji ek powerful candlestick pattern hai jo traders ko market sentiment ka change indicate karta hai aur potential reversal points identify karne mein madad karta hai. Is pattern ko sahi tareeke se interpret karke, traders apni trading strategies ko improve kar sakte hain aur market trends ka better understanding develop kar sakte hai
-
MGALI512Senior Member
- Nov 2023
- 376
- 205
- 198
- 136 USD
Explaination Of Bearish long legged doji
Bearish Long-Legged Doji ek candlestick pattern hai jo chart analysis mein use hota hai, particularly financial markets jaise ke stocks, forex, ya commodities mein price action ko interpret karne ke liye. Chaliye isko detail mein samjhein:- Candlestick Pattern: Candlestick patterns chart par price action ko represent karte hain. Har candlestick ek specific time frame ko represent karta hai, jismein price ki movement ko open, high, low, aur close ke through depict kiya jata hai. Candlestick patterns traders ko price movement ka insight dete hain aur future ke price trends ko predict karne mein madad karte hain.
- Bearish Long-Legged Doji: Bearish Long-Legged Doji ek reversal pattern hai jo market mein potential trend reversal ko indicate karta hai. Yeh pattern typically uptrend ke baad dikhta hai aur bearish reversal ke indication ke taur par samjha jata hai. Yeh ek single candlestick pattern hota hai.
- Characteristics:
- Doji Body: Bearish Long-Legged Doji ka main feature hai uski small body jo ki indicate karta hai ke opening price aur closing price ek dusre ke bohot qareeb hain. Iska matlab hai ke buyers aur sellers ke darmiyan equilibrium hai.
- Long Upper and Lower Shadows (Legs): Is pattern mein doji body ke upper aur lower shadows ya legs bohot lambi hoti hain, indicating ke during the trading period, price significant highs aur lows tak gaya tha, lekin phir end mein wapas close hua. Yeh longer shadows price volatility aur uncertainty ko represent karte hain.
- Bearish Bias: Is pattern ko bearish mana jata hai kyunki despite of the significant highs aur lows, price ultimately down close hota hai, indicating ke sellers ne control regain kiya hai aur market down jaane ki possibility hai.
- Interpretation:
- Jab Bearish Long-Legged Doji uptrend ke baad appear karta hai, toh ye ek potential reversal signal hota hai. Iska matlab hai ke uptrend weaken ho raha hai aur bearish momentum build ho sakta hai.
- Traders typically is pattern ke confirmation ke liye next candlestick ka wait karte hain. Agar next candlestick bearish hai aur doji ke low ko break karta hai, toh ye bearish reversal ka strong indication ho sakta hai.
- Agar confirmation milta hai, toh traders bearish positions enter kar sakte hain ya phir existing long positions ko close kar sakte hain.
Overall, Bearish Long-Legged Doji ek bearish reversal pattern hai jo traders ko potential downtrend ke onset ke liye alert karta hai. Is pattern ko samajhna aur recognize karna traders ke liye important hota hai taake wo market ke direction ko anticipate kar sakein aur apne trading strategies ko accordingly adjust kar sakein.
-
<a href="https://www.instaforex.org/ru/?x=ruforum">InstaForex</a> -
PantsSenior Member
- Jun 2024
- 1172
- 5
- 11
- 138 USD
### Bearish Long Legged Doji Kya Hai?
Forex aur stock trading mein, candlestick patterns market ke potential reversals aur trend changes ko identify karne mein madadgar hote hain. In patterns mein se ek important pattern hai “Bearish Long Legged Doji,” jo market ke indecision aur potential bearish trend ke reversal ko signal karta hai. Is post mein, hum Bearish Long Legged Doji pattern ko detail mein samjhenge aur iski trading significance ko explore karenge.
**Bearish Long Legged Doji Ka Structure:**
Bearish Long Legged Doji ek specific candlestick pattern hai jo market ki uncertainty aur potential trend reversal ko highlight karta hai. Is pattern ko pehchaanne ke liye, candlestick chart ko closely observe karna padta hai.
1. **Pehchaan:**
Bearish Long Legged Doji ek candlestick pattern hai jiska body chhota aur shadows (wicks) kaafi lambi hoti hain. Yeh candlestick market ke high aur low points ke beech significant price movement ko dikhati hai, lekin closing price opening price ke paas hoti hai.
2. **Appearance:**
Pattern mein, candlestick ka body center ke paas hota hai, aur upper aur lower shadows lambi hoti hain. Is pattern ka appearance market mein confusion aur indecision ko reflect karta hai, jahan buyers aur sellers dono strong positions mein hain lekin market ka direction clear nahi hai.
**Pattern Ka Interpretation:**
1. **Market Indecision:**
Bearish Long Legged Doji market ke indecision ko represent karta hai. Jab yeh pattern form hota hai, to iska matlab hai ke market mein buying aur selling pressure ka balance hai aur market ki direction clear nahi hai.
2. **Potential Reversal:**
Agar Bearish Long Legged Doji pattern bearish trend ke baad form hota hai, to yeh potential bearish reversal signal hota hai. Yeh pattern indicate karta hai ke market ne high aur low points ke beech significant movement kiya hai, lekin closing price near the open price hai, jo ki sellers ke dominance ko suggest karta hai.
**Trading Strategy:**
1. **Confirmation:**
Bearish Long Legged Doji ke signal ko confirm karne ke liye, additional indicators aur price action signals ka use zaroori hai. Aap RSI, MACD ya moving averages ko use karke pattern ki confirmation kar sakte hain. Agar pattern ke baad market downward movement show karta hai, to yeh bearish confirmation ho sakta hai.
2. **Entry Point:**
Entry point tab hota hai jab Bearish Long Legged Doji ke baad price lower side par move karti hai aur bearish signals generate karti hai. Is point par aap short positions open kar sakte hain.
3. **Stop-Loss Aur Take-Profit:**
Stop-loss ko Doji ke high ke upar set karna chahiye taake price unexpected movement se bach sake. Take-profit levels ko previous support levels ke mutabiq set kiya jata hai, taake aap apne profits ko capture kar sakein aur losses ko limit kar sakein.
**Conclusion:**
Bearish Long Legged Doji ek important candlestick pattern hai jo market ke indecision aur potential bearish trend reversal ko indicate karta hai. Is pattern ko samajh kar aur additional confirmation signals ke saath trading strategies ko apply karke, traders market ke movements ko accurately capture kar sakte hain aur informed trading decisions le sakte hain. Yeh pattern market ke complex dynamics ko understand karne mein madad karta hai aur trading strategies ko enhance karta hai.
اب آن لائن
Working...
تبصرہ
Расширенный режим Обычный режим