"Bullish kicker" ek prakar ka Japanese candlestick pattern hota hai jo technical analysis me use hota hai share market aur other financial instruments ke price movements ko predict karne ke liye. Is pattern ka use predominantly uptrend ya bullish trend ke reversal points ko identify karne me hota hai."Bullish kicker" pattern ek specific price sequence ko represent karta hai jisme do consecutive candles hote hain. Niche diye gaye steps me is pattern ki formation ko explain kiya gaya hai: Pehla Candle (Bearish): Is pattern ki formation ka pehla candle bearish hota hai, yaani ki is candle ka closing price uski opening price se kam hota hai. Ye candle existing trend ko reflect karta hai, jisme price down ja raha hota hai. Dusra Candle (Bullish): Dusra candle pehle candle se higher opening price ke sath start hota hai aur iski price throughout the day ya time period me increase hoti hai. Is candle ka closing price pehle candle ki opening price se bhi jyada hota hai."Bullish kicker" pattern ki formation se pata chalta hai ki pehle bearish trend ke baad buyers (khareedne wale) market me strong aaye hain aur price me substantial increase hua hai, jo ki uptrend ya bullish trend ka sign ho sakta hai. Is pattern ko dekhte hue traders ka assumption hota hai ki market ab upward direction me move karega.Lekin, jaise har technical analysis pattern me hota hai, "bullish kicker" bhi ek specific context me hi effective hota hai. Market ke other factors aur indicators ko bhi consider karna mahatvapurna hai pattern ke sahi interpretation ke liye. Is pattern ke alawa bhi kai aur candlestick patterns hote hain jo traders market analysis me use karte hain.
-
shan512Senior Member

- Jul 2023
- 113
- 32
- 4
- 127 USD
-
<a href="https://www.instaforex.org/ru/?x=ruforum">InstaForex</a> -
KHANG07Senior Member
- Mar 2023
- 204
- 03279601327
- 196
- 174 USD
INTRODUCE OF BULLISH KICKER CANDLESTICKS ,,, AOA, Ummidi karts hon Ap San Khariat Say Hon gy AJ ham BULLISHNESS kicker CANDLESTICKS Pattren downtrend movemet ky liye bhot mashor Trendiness show up karty hen our explained i tra hum continue rakhey geh tu hume kameyabi milen gi bullish kicker MARKETS mein ek achcha candlestick hai jisko Ham jitna achcha follow karenge itna zyada Ham market mein isko work mein use karenge to hamen kamyabi milegi agar Aapke candles ka use Nahin aata hai to uske liye aapko demo account ka use karna chahie demo account mein Ham Inka jab use karte hain to hamari practis ho jaati hai aur iski vajah se Ham market se Faida bhi le sakte hain aapko pata hai ki market mein kam karne ke liye Kitna jyada hamen knowledgeable increase hota hai knowledge hamare pass jitna jyada Hoga mark market ko acchi Tarah time denge to kamyabi milegi extra work agar Ham market mein karenge jyada high risk lenge to hamen ismein kamyabi Nahi milegi important hota hai ki Ham market ko acchi tarike se time de Delhi ismein struggle Karen to aasani se hamen Market se kamyabi Mil jaatiBULLISHES KICKERS CANDLE FORMATION,, Ess BULLISHNESS kicker's CANDLE PATTERN ko itmal Mei ota hai ma aap khairiyat se hon geh ur market mn acha kam kr rhe hon geh hume pta ha forex hamre Liye acha Business ha jis mn hum free mn kam kr k kameyab ho sakte hein hum is mn without experyience aur knowledge ke agar kam krein tu kameyabi ni milti ha is liye lazmi hota ha k hum phaly se hi is mn acha kam Karen tu asani se Kameyabi mil jaati ha Technical analysis ur fundamentally Analysis ko hume fallowing kr k kam krna hota ha os k bad hi hume is mn kamela milen gi Jo log markets mein achcha kam karte hain regular market ko time dete Hain vahi is Forex hamesha usi kami ko success deta hai jo ismein acha kam karta hai bura hamen Market mein apna science Friend's karna hota hai to fir bhi hamen ismein kamyabi milati hai.rket mein hamen regular apna time spend the karna hota hai to aasani se Ham kamyab ho sakte hain Jo log acha time dete Hain regular market mein apna time spend karte hain vah aasani se ismein kamyab ho sakte hain har
-
Usama846Junior Member
- Mar 2023
- 23
- 2
- 4
figure out I tra mumble continue rakhey geh tu hume kameyabi milen gi bullish kicker market mein ek achcha candle hai jisko Ham jitna achcha follow karenge itna jyada Ham market mein isko work mein use karenge to hamen kamyabi milegi agar aapko light ka use Nahin aata hai to uske liye aapko demo account ka use karna chahie demo account mein Ham Inka jab use karte hain to hamari practis ho jaati hai aur iski vajah se Ham market se fayda bhi le sakte hain aapko pata hai ki market mein kam karne ke liye Kitna jyada hamen data increase hota hai data hamare pass jitna jyada Hoga mark market ko acchi Tarah time denge to kamyabi milegi extra work agar Ham market mein karenge jyada high bet lenge to hamen ismein kamyabi Nahin milegi huge hota hai ki Ham market ko acchi tarike se time de Delhi ismein fight Karen to aasani se hamen market se kamyabi Mil jaati hai ismein hamen specific assessment aur fundamental assessment ko follow karke kam karna hota hai ismein hamen pointer ko dekhna hota hai to aasani se Ham kamyab ho sakte hain demo account hamari practis ke liye behtarin online record hai jismein Ham jyada se jyada kam Karen market ko follow Kar Explanation Rujhan ke bawajood aik Bullish kicker fire zahir ho skti hai r yeh aik mazboot Bullish sign hai. Yahan yeh hai ke aap kis terhan bullish kicker ki shnakht kar skte hain.
  Sb se phly plan aik negative fire se shuru hota hai doosri mother batii ka farq oopar ki taraf hota hai aur pichlle disturbance ke qareeb se oopar khilta hai. Yeh seedha chalta rehta hai aur aik taiz mother batii ke top standard khatam hota hai. Is khlaa ko doosri shama ki batii se pur nahi kya jana chahiye candle mein aik choti ya ghair mojood nichli wick hoti hai. Hit koi tajir kisi khaas stock outline standard Bullish kicker patteren ko pehchanta hai to aap Bullish kicker patteren ke samnay anay ke baad agli fire mein tijarat mein daakhil ho skty hain. Stop nuqsaan pichli mother batii ke nichale hissay standard rakha jana chahiye.
-
sultan77Senior Member
- Apr 2023
- 714
- 34
- 3
**Bullish Kicker Candlestick Pattern: An Explanation** Bullish Kicker candlestick pattern ek powerful reversal pattern hai jo traders ko bullish trend ki potential signals provide karta hai. Yeh pattern do candlesticks se bana hota hai aur ek downtrend ko indicate karta hai, jahan ek bearish candlestick ek strong bullish candlestick ke sath followed hota hai. **Explanation:** Bullish Kicker pattern mein pehle candlestick bearish (downward) hota hai, jahan price downward move karta hai. Is bearish candlestick ke baad ek doosra candlestick aata hai jo strong bullish (upward) hota hai, jahan price upward move karta hai. Yeh bullish candlestick pehle candlestick ke open price se higher open hota hai, indicating a sudden shift in market sentiment from bearish to bullish. **Types of Bullish Kicker Patterns:** 1. **Bullish Marubozu Kicker:** Is type mein pehle candlestick bearish hota hai, lekin doosre candlestick ek bullish marubozu hota hai, jahan open price aur close price ek hi level par hote hain. 2. **Bullish Closing Marubozu Kicker:** Is type mein pehle candlestick bearish hota hai, aur doosre candlestick ek bullish closing marubozu hota hai, jahan close price upper end par hota hai. **Benefits of Bullish Kicker Patterns:** 1. **Trend Reversal Indicator:** Bullish Kicker pattern traders ko potential bearish trend reversal ke signals provide karta hai, indicating a shift towards a bullish trend. 2. **Early Entry Points:** Traders bullish kicker pattern ki madad se early entry points confirm kar sakte hain, jisse unka potential for profit increase hota hai. 3. **Confirmation of Sentiment Shift:** Bullish kicker pattern strong reversal ki confirmation deta hai, jahan bearish sentiment suddenly bullish sentiment mein change hota hai. **Drawbacks of Bullish Kicker Patterns:** 1. **False Signals:** Kabhi-kabhi bullish kicker patterns false signals bhi de sakte hain, jahan actual trend reversal nahi hota. 2. **Market Volatility:** Market volatility ke dauran bullish kicker pattern ka interpretation mushkil ho sakta hai. 3. **Confirmation Required:** Bullish kicker pattern ko confirm karne ke liye other technical indicators aur price action analysis ki zaroorat hoti hai. **Conclusion:** Bullish Kicker candlestick pattern traders ke liye valuable tool hai jo potential trend reversal signals ko detect karne mein madad deta hai. Lekin traders ko false signals aur market volatility ka bhi dhyan dena chahiye. Bullish kicker pattern ko interpret karne ke liye other technical indicators aur analysis ki zaroorat hoti hai. Is pattern ki madad se traders apne entry aur exit points improve kar sakte hain, lekin proper research aur practice zaroori hai. Bullish kicker pattern traders ko market movements aur trend changes ko better samajhne mein madad deta hai. Overall, is pattern ka istemal traders ki analysis skills aur trading decisions ko enhance karne mein madadgar ho sakta hai, lekin iska istemal karte waqt confirmation aur risk management ka dhyan dena zaroori hai. -
awaiskhan54Senior Member
- May 2023
- 360
- 41
- 992
- 138 USD
bullish kicker candle stick pattern
clarify i tra Hume kameyabi milen gi continue rakhey geh tu Market mein isko work mein use karenge to hamen kamyabi milegi, market mein isko work mein use karenge to bullish kicker market mein ek achcha candlestick hai jisko If you use a candlestick but no demo account, you can still practice and the market is open if you use a demo account. If you use a demo account but no candlestick, you can still practice and the market is open if you use a demo account. Market mein kam karne ke liye, aapko pata hai Knowledge hamare pass jitna jyada Hoga kitna jyada hamen enhance hota hai Tarah time denge to kamyabi milegi extra job mark market ko If the Ham Market is at great risk, then Hamen Isein Kamyabi Nahin Milegi Important Hota Hai About the Time De Delhi About the Ham Market ismein aasani se hamen market se kamyabi mil jaati hai Karen to ismein struggle Aasani se Ham kamyab ho sakte hain, ismein hamen technical analysis aur fundamental analysis ko follow karke kam karna hota hai, ismein hamen indication ko dekhna hota hai In order to practice, a demo account is required. Ham jyada se jyada kam Karen market ko follow Kar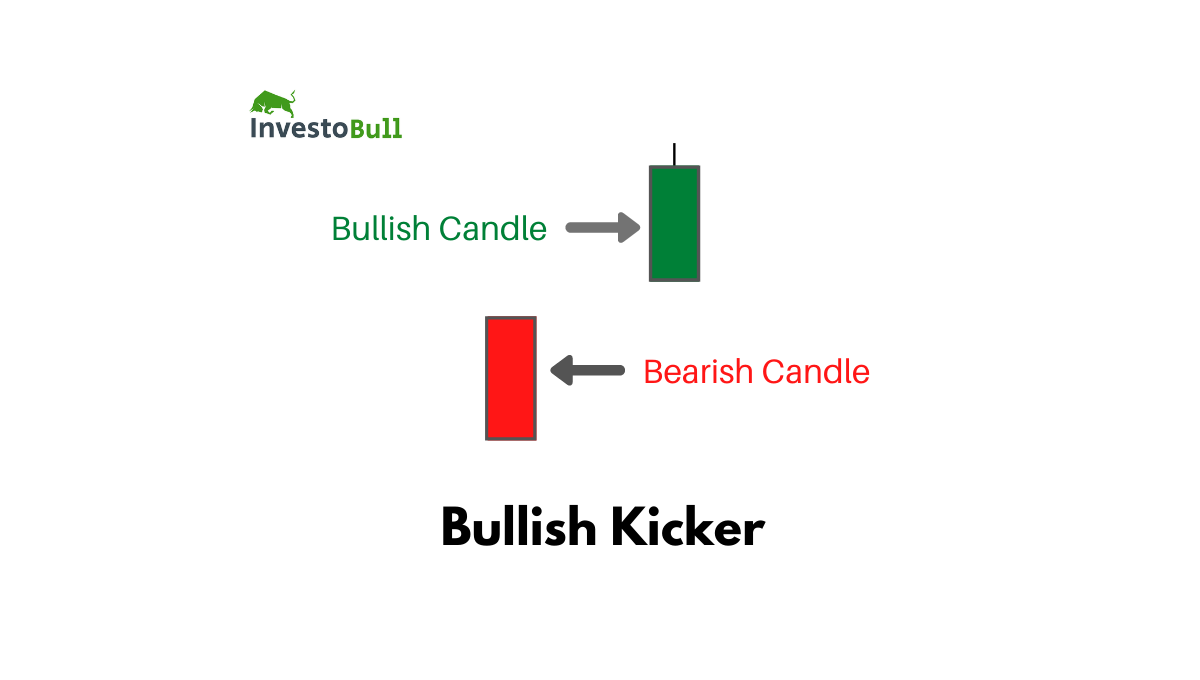 Basis Is pattern's Friday the thirteenth kuch is hote?Change in trend.Bullish Kicker pattern is a trend reversal pattern; according to the math, when this pattern is present, the market's trend will change. Trading ko buying kay mawaqay milte hain traders ko downtrend se uptrend ki taraf shift hone ke karan.Strong Signal is in evidence right now.When a pattern is repeated over a period of time, it is considered to be a strong bullish indicator. The price's direction is obvious, and traders can see where the price is moving by looking at it.Stop Loss and Entry.Bullish Kicker pattern traders' entry point and stop-loss level are both important factors to consider. The typical entry point is when a bullish candle is at its highest point and the stop-loss is when a bearish candle is at its lowest point. Since stop-loss levels are tight and price movement has a strong possibility for upward movement, traders who use patterns have higher risk-reward ratios.Tasdeeq.Traders' use of technical indicators such as moving averages, RSI, and price charts has provided conclusive signals for the Bullish Kicker pattern, which has been confirmed.
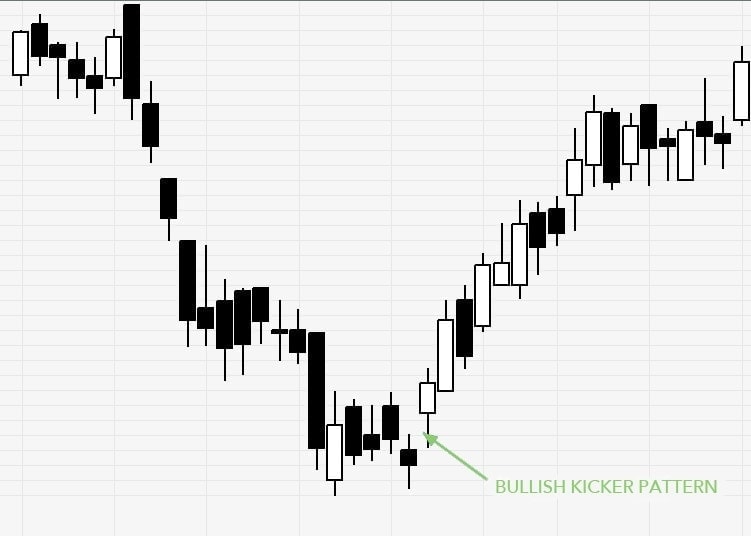
-
1azazJunior Member
- Jan 2022
- 0
make sense of I tra murmur proceed rakhey geh tu hume kameyabi milen gi bullish kicker market mein ek achcha candle hai jisko Ham jitna achcha follow karenge itna jyada Ham market mein isko work mein use karenge to hamen kamyabi milegi agar aapko candle ka use Nahin aata hai to uske liye aapko demo account ka use karna chahie demo account mein Ham Inka poke use karte hain to hamari practis ho jaati hai aur iski vajah se Ham market se fayda bhi le sakte hain aapko pata hai ki market mein kam karne ke liye Kitna jyada hamen information increment hota hai information hamare pass jitna jyada Hoga mark market ko acchi Tarah time denge to kamyabi milegi additional work agar Ham market mein karenge jyada high gamble lenge to hamen ismein kamyabi Nahin milegi significant hota hai ki Ham market ko acchi tarike se time de Delhi ismein battle Karen to aasani se hamen market se kamyabi Mil jaati hai ismein hamen specialized examination aur major investigation ko follow karke kam karna hota hai ismein hamen pointer ko dekhna hota hai to aasani se Ham kamyab ho sakte hain demo account hamari practis ke liye behtarin online record hai jismein Ham jyada se jyada kam Karen market ko follow Kar BULLISH KICKER Candle Example ID. ota hai mama aap khairiyat se hon geh ur market mn acha kam kr rhe hon geh hume pta ha forex hamre Liye acha business ha jis mn murmur free mn kam kr k kameyab ho sakte hein murmur is mn without experience aur information ke agar kam krein tu kameyabi ni milti ha is liye lazmi hota ha k murmur phaly se hello there is mn acha kam Karen tu asani se Kameyabi mil jaati ha Tecnical investigation ur major examination ko hume neglected kr k kam krna hota ha os k awful greetings hume is mn kameyabi milen gi Jo log market mein achcha kam karte hain customary market ko time dete Hain vahi is Forex hamesha usi kami ko achievement deta hai jo ismein achcha kam karta hai bura hamen market mein apna science companion karna hota hai to fir bhi hamen ismein kamyabi milati hai.rket mein hamen normal apna time spend karna hota hai to aasani se Ham kamyab ho sakte hain Jo log achcha time dete Hain standard market mein apna time spend karte hain vah aasani se ismein kamyab ho sakte hain har banna market mein kamyab hona Chahta hai Lekin asal mein vahi Banda jyada kamyab hota hai Jo isko achcha time Deta hai ordinary apna time spend karta hai vah aasani se ismein kamyab ho sakta hai actually work market mein significant hota hai koi bhi work market mein Ham karenge to aasani se Ham kamyab ho sakte hain yah ek significant internet based business hai hamen achcha t -
Nehanoor5Junior Member
- Feb 2023
- 17
- 5
- 14 USD
Aslamoalekum kesay hein ap sab members mein umed karti hon ap sab kheryt say hon gay or apki posting achi ja rhii hogi. Aj ka jo topic zer e behas hy uska name bullish kicker candlestick pattern hy. Isy dekhty hein ky yh kia hy or hmen kia malomat faraham karta hai. Bullish kicker pattern Bullish Kicker Candlestick pattern mein do consecutive candles hoti hain, jahan pe pehli candle bearish girawat ki taraf hoti hai aur dusri candle usi se opposite direction mein strong bullish baraavat ki taraf move karte hue open hoti hai. Yeh pattern am tor pr trend reversal ko zahir karta hai, jab market ka trend downward se upward shift karta hai.Bullish Kicker Candlestick pattern forex trading mein ek ahem maqam rakhta hai kyunki yeh trend reversal ko signal karta hai. Jab market downtrend mein hota hai aur Bullish Kicker pattern nazar aata hai, to yeh dikhata hai ke bearish trend khatam ho raha hai aur ab market ki taraf se bullish trend movement shuru ho rahi hai. Traders is pattern ki madad se market ki tabdili ka pata lagate hain aur sahi waqt par trading decisions lete hain. Isi tarah se Bullish Kicker Candlestick pattern trading strategy mein ahem hissa ada karta hai.Bullish Kicker Candlestick pattern forex trading mein ek bullish reversal signal deta hai. Jab yeh pattern nazar aata hai, to iska matlab hota hai ke market ka trend downward girawat ki taraf se upward baraavat ki taraf badalne wala hai. Pehli candle bearish hoti hai aur dusri candle usse mukhalif simat mein strong bullish move karte hue open hoti hai. Yeh signal traders ko batata hai ke ab market mein bullish movement ki umeed hai aur unhe long positions lene ka mauka mil sakta hai. Isi tarah se Bullish Kicker Candlestick pattern trading mein ek powerful tool ban bhee sakta hai.Forex trading mein Bullish Kicker Candlestick pattern baki patterns se isliye alag hota hai kyunki yeh trend reversal ko signal karta hai, jabkay baki sahii patterns trend continuation ya reversal dono ko neshandahi kar sakte hain. importance Bullish Kicker pattern mein do consecutive candles hoti hain, jahan pe pehli candle bearish girawat ki taraf hoti hai aur dusri candle usi sey zara hat ky alag simat mein mein strong bullish baraavat ki taraf move karte hue open hoti hai. Isse market ka mood badalne ki indication hoti hai.Dusri taraf, trend continuation patterns ya trend continuation patterns mein, market ka trend wahi rukh jari rehta hai jo pehle se tha. In patterns mein, traders ko yeh maloom hota hai ke market ka trend wahi rehne wala hai aur woh current trend ke sath trading decisions le sakte hain.Isliye Bullish Kicker Candlestick pattern baki patterns se different hota hai kyunki iska focus trend reversal par hota hai, jabki baki patterns market ke current trend ko jari rakhne ya uske continuation par zyada zor dete hain. -
1azazJunior Member
- Jan 2022
- 0
make sense of I tra murmur proceed rakhey geh tu hume kameyabi milen gi bullish kicker market mein ek achcha candle hai jisko Ham jitna achcha follow karenge itna jyada Ham market mein isko work mein use karenge to hamen kamyabi milegi agar aapko candle ka use Nahin aata hai to uske liye aapko demo account ka use karna chahie demo account mein Ham Inka poke use karte hain to hamari practis ho jaati hai aur iski vajah se Ham market se fayda bhi le sakte hain aapko pata hai ki market mein kam karne ke liye Kitna jyada hamen information increment hota hai information hamare pass jitna jyada Hoga mark market ko acchi Tarah time denge to kamyabi milegi additional work agar Ham market mein karenge jyada high gamble lenge to hamen ismein kamyabi Nahin milegi significant hota hai ki Ham market ko acchi tarike se time de Delhi ismein battle Karen to aasani se hamen market se kamyabi Mil jaati hai ismein hamen specialized examination aur major examination ko follow karke kam karna hota hai ismein hamen pointer ko dekhna hota hai to aasani se Ham kamyab ho sakte hain demo account hamari practis ke liye behtarin online record hai jismein Ham jyada se jyada kam Karen market ko follow Kar BULLISH KICKER Candle Example ID. ota hai mama aap khairiyat se hon geh ur market mn acha kam kr rhe hon geh hume pta ha forex hamre Liye acha business ha jis mn murmur free mn kam kr k kameyab ho sakte hein murmur is mn without experience aur information ke agar kam krein tu kameyabi ni milti ha is liye lazmi hota ha k murmur phaly se hello is mn acha kam Karen tu asani se Kameyabi mil jaati ha Tecnical investigation ur key examination ko hume decrepit kr k kam krna hota ha os k terrible hey hume is mn kameyabi milen gi Jo log market mein achcha kam karte hain customary market ko time dete Hain vahi is Forex hamesha usi kami ko achievement deta hai jo ismein achcha kam karta hai bura hamen market mein apna science companion karna hota hai to fir bhi hamen ismein kamyabi milati hai.rket mein hamen normal apna time spend karna hota hai to aasani se Ham kamyab ho sakte hain Jo log achcha time dete Hain customary market mein apna time spend karte hain vah aasani se ismein kamyab ho sakte hain har banna market mein kamyab hona Chahta hai Lekin asal mein vahi Banda jyada kamyab hota hai Jo isko achcha time Deta hai ordinary apna time spend karta hai vah aasani se ismein kamyab ho sakta hai actually work market mein significant hota hai koi bhi work market mein Ham karenge to aasani se Ham kamyab ho sakte hain yah ek significant web-based business hai hamen achcha t -
Asim5Senior Member
- Aug 2023
- 830
- 33
- 173
- 325 USD
"Bullish Kicker" pattern ko pehchaanne ke liye, neeche diye gaye steps ko follow kar sakte hain:Pehli Candle (Bearish Candle): Yeh candle price mein girawat ko represen"Bullish Kicker" candlestick pattern, jo ke technical analysis mein istemal hota hai, ek bullish reversal pattern hai. Is pattern mein do consecutive candles hote hain, jinmein se pehli candle bearish hoti hai (price girti hai), aur dusri candle usse immediately follow karti hai jo bullish hoti hai (price bhadti hai). Ye pattern market mein trend reversal ki possibility indicate karta hai, yani ke bearish trend se bullish trend ki taraf murne ki sambhavna hoti hai. "Bullish Kicker" pattern ko pehchaanne ke liye, neeche diye gaye steps ko follow kar sakte hain:- Pehli Candle (Bearish Candle): Yeh candle price mein girawat ko represent karti hai. Is candle ki body bearish (selling) sentiment ko show karti hai.
- Dusri Candle (Bullish Candle): Dusri candle pehli candle ke baad directly appear hoti hai. Is candle ki body bullish (buying) sentiment ko indicate karti hai aur pehli candle ki body se ziada extend hoti hai.
- Pehli Candle (Bearish Candle): Yeh candle qeemat mein kami ko dikhata hai. Iski body bechnay (bearish) sentiment ko zahir karti hai.
- Dusri Candle (Bullish Candle): Dusri candle pehli candle ke turant baad nazar aati hai. Iski body kharidnay (bullish) sentiment ko zahir karti hai aur pehli candle ki body se ziada extend hoti hai.
-
UmerdonaSenior Member
- Apr 2021
- 1963
- 483
- 2787
- 540 USD
What is bullish kicker candle stick pattern:? INTRODUCTION&EXPLANATION: sirr,, [/h]Assalamualaikum all members. Kesy hy ap sab. Umeed krti ho ap sb thk hogy. Ajka hmara discussion ka topic Bullish Kicker Candlestick Pattern ky bary my hy. Ab isy Dekhty hy ky ye kia hy r hmy kia information deta hy. Bullish Kicker Candlestick Pattern: sirr,, Bullish kicker aik do candle stick patteren hai jo aam tor par numaya kami ke baad bantaa hai lekin yeh oopar ke rujhan ke baad bhi zahir ho sakta hai. Bullish Kicker candle stick patteren my Bullish kicker aik brri Bullish candle stick pr mushtamil hota hai jis ki qayadt oopar ki taraf aik gap aur bearish candle se hoti hai. Is ki mutabqat is waqt barh jati hai jab yeh ziyada khareeday hue ya ziada frokht hony walay ilaqon mein hota hai. Agar ap ko up trend ke bad taizi se kicker nazar aata hai to yeh is baat ki alamat ho sakti hai ke market mein ab bhi up trend ko jari rakhnay ke liye kaafi taaqat hai.THANKS TO ALL MY SWEET MEMBERS........,,,,,,,,,,,,,,,, -
1azazJunior Member
- Jan 2022
- 0
get a handle on I tra mumble continue rakhey geh tu hume kameyabi milen gi bullish kicker market mein ek achcha flame hai jisko Ham jitna achcha follow karenge itna jyada Ham market mein isko work mein use karenge to hamen kamyabi milegi agar aapko light ka use Nahin aata hai to uske liye aapko demo account ka use karna chahie demo account mein Ham Inka jab use karte hain to hamari practis ho jaati hai aur iski vajah se Ham market se fayda bhi le sakte hain aapko pata hai ki market mein kam karne ke liye Kitna jyada hamen data increase hota hai data hamare pass jitna jyada Hoga mark market ko acchi Tarah time denge to kamyabi milegi extra work agar Ham market mein karenge jyada high bet lenge to hamen ismein kamyabi Nahin milegi critical hota hai ki Ham market ko acchi tarike se time de Delhi ismein fight Karen to aasani se hamen market se kamyabi Mil jaati hai ismein hamen specific assessment aur essential assessment ko follow karke kam karna hota hai ismein hamen pointer ko dekhna hota hai to aasani se Ham kamyab ho sakte hain demo account hamari practis ke liye behtarin online record hai jismein Ham jyada se jyada kam Karen market ko follow Kar Bullish Kicker Candle Model: Bullish kicker aik do candle patteren hai jo aam zenith standard numaya kami ke baad bantaa hai lekin yeh oopar ke rujhan ke baad bhi zahir ho sakta hai. Bullish Kicker candle patteren my Bullish kicker aik brri Bullish flame pr mushtamil hota hai jis ki qayadt oopar ki taraf aik opening aur negative light se hoti hai. Is ki mutabqat is waqt barh jati hai punch yeh ziyada khareeday conceal ya ziada frokht hony walay ilaqon mein hota hai. Agar ap ko up design ke dreadful taizi se kicker nazar aata hai to yeh is baat ki alamat ho sakti hai ke market mein stomach muscle bhi up design ko jari rakhnay ke liye kaafi taaqat hai. Explanation Rujhan ke bawajood aik Bullish kicker fire zahir ho skti hai r yeh aik mazboot Bullish sign hai. Yahan yeh hai ke aap kis terhan bullish kicker ki shnakht kar skte hain. Sb se phly plan aik negative fire se shuru hota hai doosri mother batii ka farq oopar ki taraf hota hai aur pichlle upheaval ke qareeb se oopar khilta hai. Yeh seedha chalta rehta hai aur aik taiz mother batii ke top standard khatam hota hai. Is khlaa ko doosri shama ki batii se pur nahi kya jana chahiye flame mein aik choti ya ghair mojood nichli wick hoti hai. Hit koi tajir kisi khaas stock graph standard Bullish kicker patteren ko pehchanta hai to aap Bullish kicker patteren ke samnay anay ke baad agli fire mein tijarat mein daakhil ho skty hain. Stop nuqsaan pichli mother batii ke nichale hissay standard rakha jana chahiye. -
Azaz1Member
- Jan 2022
- 34
- 71
- 336
- 491 USD
"Bullish kicker candlestick pattern" ek technical analysis mein use hone wala pattern hai jo ek possible trend reversal ya existing uptrend ki continuation ko darshata hai. Yeh pattern do candlesticks se bana hota hai aur yeh ek strong bullish signal ke roop mein consider hota hai. Niche is pattern ki vistar se vyakhya di gayi hai: Pehla Candlestick: Pehla candlestick ek bada bearish (downward) candle hota hai jo apni close ke paas band hota hai. Yeh darshata hai ki trading period ke dauran majboot bechne ki dabav hai. Dusra Candlestick: Dusra candlestick ek bada bullish (upward) candle hota hai jo pehle candle ki close se kafi upar khulta hai. Fir yeh upar badhta hai aur pehle candle ki high se upar band hota hai. Is sudden shift se bearish sentiment se bullish sentiment ki taraf hone ka yeh pramukh gun hai.Bullish kicker pattern yeh sanket deta hai ki majboot bechne ki dabav ke baad, market sentiment ab achanak se majboot kharidne ki taraf badal gaya hai. Iska matlab hai ki downtrend ka ant ho sakta hai aur ek potential uptrend ya bullish move aane wala hai.Traders aur analysts candlestick patterns jaise bullish kicker ko anya technical indicators aur analysis methods ke saath milkar samajhne ki koshish karte hain taki unhe soojh-boojh se trading decisions lene mein madad mile. Yah mahatvapurn hai ki jab bhi trading decisions lene ja rahe hain to sirf in patterns par poora nirbhar na karein, kyun ki market anishchit hoti hai aur vibhinn factors se prabhavit hoti hai. -
Zartash5Junior Member
- Aug 2022
- 0
- 206
- 62
- 116 USD
The "Bullish Kicker" is a candlestick pattern in technical analysis that is considered a strong bullish reversal signal. This pattern consists of two consecutive candles, with the first being a bearish (downward) candle and the second being a larger bullish (upward) candle. The Bullish Kicker pattern signifies a rapid shift in sentiment from bearish to bullish. Here's how the Bullish Kicker pattern is identified: Bearish Candle (Day 1): The first day's candle is a bearish candle, indicating a downtrend or bearish sentiment in the market. Bullish Candle (Day 2): The second day's candle is a larger bullish candle that completely engulfs the previous day's bearish candle. This indicates a strong reversal in sentiment, as the price gaps up and rises significantly above the previous day's close. The Bullish Kicker pattern is considered a powerful reversal pattern because it reflects a sudden shift in market sentiment, often due to a significant fundamental development, news announcement, or market event. Traders interpret this pattern as a sign that the previous downtrend is likely to reverse, and they may consider taking bullish positions based on this signal. As with any technical pattern, it's important to use additional tools and indicators to confirm the pattern's reliability. Not all Bullish Kicker patterns will lead to substantial price reversals, so combining this pattern with other forms of technical and fundamental analysis can provide a more comprehensive trading strategy. Also, remember that while candlestick patterns can be useful, no pattern is infallible, and risk management is essential in any trading strategy. -
1azazJunior Member
- Jan 2022
- 0
figure out I tra mumble continue rakhey geh tu hume kameyabi milen gi bullish kicker market mein ek achcha flame hai jisko Ham jitna achcha follow karenge itna jyada Ham market mein isko work mein use karenge to hamen kamyabi milegi agar aapko light ka use Nahin aata hai to uske liye aapko demo account ka use karna chahie demo account mein Ham Inka jab use karte hain to hamari practis ho jaati hai aur iski vajah se Ham market se fayda bhi le sakte hain aapko pata hai ki market mein kam karne ke liye Kitna jyada hamen data increase hota hai data hamare pass jitna jyada Hoga mark market ko acchi Tarah time denge to kamyabi milegi extra work agar Ham market mein karenge jyada high bet lenge to hamen ismein kamyabi Nahin milegi critical hota hai ki Ham market ko acchi tarike se time de Delhi ismein fight Karen to aasani se hamen market se kamyabi Mil jaati hai ismein hamen specific assessment aur essential examination ko follow karke kam karna hota hai ismein hamen pointer ko dekhna hota hai to aasani se Ham kamyab ho sakte hain demo account hamari practis ke liye behtarin online record hai jismein Ham jyada se jyada kam Karen market ko follow Kar BULLISH KICKER Candle Model ID. ota hai mom aap khairiyat se hon geh ur market mn acha kam kr rhe hon geh hume pta ha forex hamre Liye acha business ha jis mn mumble free mn kam kr k kameyab ho sakte hein mumble is mn without experience aur data ke agar kam krein tu kameyabi ni milti ha is liye lazmi hota ha k mumble phaly se hey is mn acha kam Karen tu asani se Kameyabi mil jaati ha Tecnical assessment ur head examination ko hume ignored kr k kam krna hota ha os k terrible good tidings hume is mn kameyabi milen gi Jo log market mein achcha kam karte hain ordinary market ko time dete Hain vahi is Forex hamesha usi kami ko accomplishment deta hai jo ismein achcha kam karta hai bura hamen market mein apna science friend karna hota hai to fir bhi hamen ismein kamyabi milati hai.rket mein hamen conventional apna time spend karna hota hai to aasani se Ham kamyab ho sakte hain Jo log achcha time dete Hain ordinary market mein apna time spend karte hain vah aasani se ismein kamyab ho sakte hain har banna market mein kamyab hona Chahta hai Lekin asal mein vahi Banda jyada kamyab hota hai Jo isko achcha time Deta hai standard apna time spend karta hai vah aasani se ismein kamyab ho sakta hai as a matter of fact work market mein huge hota hai koi bhi work market mein Ham karenge to aasani se Ham kamyab ho sakte hain yah ek critical electronic business hai hamen achcha t -
<a href="https://www.instaforex.org/ru/?x=ruforum">InstaForex</a> -
yamankhanMember
- Feb 2023
- 60
- 27
- 56
- 11 USD
Bullish kicking candlestickpattern two days candles ka pattern inversion design hai, jiss fundamental pehli flame aik typical negative candle hoti hai, jo costs primary negative pattern continuation aur selling pressure dekhati hai. Is patteren ko yaad rakhen, aayiyae aik misaal len. misaal ke pinnacle standard, punch koi khilari girtay shade foot baal ko zameen se takaraane se pehlay laat maarta hai. isi terhan, chand negative candle ke baad, aik barri taizi ki light stuck achanak aik expand up ke sath boycott jaye gi. isi liye usay kukkar patteren kaha jata hai . yeh hamesha sifarish ki jati hai ke exchanging mein kisi aik mother batii ke patteren standard inhisaar nah karen. kyunkay market jhutay namonon se bhari hui hai aur tijarat ki nafsiat kamyabi ke rastay mein aik aur barri rukawat hai. is liye aap ko hamesha dosray takneeki ko shaamil karna chahiye . Subtleties tamam merchants ke liye jaruri hai ki vah single example per greetings inhe sawar na Karen Kyunki single example kabhi bhi dependable nahi hote isiliye unke sath Kisi dusre design ya pointers ki madad se market ko investigation karna jaruri hota hai Kyunki man market Mein various examples chal rahe hote Hain. No doubt murmur on importance conjunctions ko share karenge jo ki is subject ko samajhne ke liye bahut jaruri hai. increment karne ke liye ek ki level ke taur per kam karta hai cost hamesha inhin ki level Se mauses Hoti Hai aur kickerpattern mein pahle hey yah bullish pattern inversion design mein hoti hai isiliye Ham Indore specialized apparatuses ka istemal karte Hain aur inmein se bullish pattern inversion ki likelihood zada hoti hai. Aur poke cost over sold zone ki taraf girti hai aur yah thirty se kam ki taraf Chali jaati Hai to is point se dobara yah increment Hoti Hai Kyunki jasy cost specialty aati Hai To fir Uske badhane ke chances jyada hote hain Kyunki cost waves ki surat mein abs and downs Mein chalti Hai. Exchanging BullishKickerpattern forex exchanging mein ek significant candlestickpattern hai. Yeh design cost activity tajziya mein istemal kiya jata hai aur bullish market inversion ko show karta hai.Bullish Kickerpattern mein do continuous candles hote hain. Pehli candle negative descending pattern mein hoti hai aur dusri light uski hadod ke bahar open hoti hai. Dusri candle bullish uper ki trf pattern mein close hoti hai aur pehli light ki significant level ko outperform karti hai. Yeh patternbullish force areas of strength for ka hai aur upswing ka sign deta hai.Bullish Kickerpattern ki significance is baat standard hai ki yeh ek solid bullish inversion ky isharay muhaya karta hai. Is design ko samajhna aur shanakht karna merchants ke liye bht muffeed hota hai, kyunki isse unhe market mein aane rib pattern change ki malomat milti hai. Agaar dealer is design ko sahi tarike se shanakht kar leta hai, toh usse beneficial exchanging ky mawaqay mil sakti hain.Yeh design kisi bhi time period standard aur kisi bhi waqat money ky joray ke liye ho sakta hai. Lekin jaise har specialized investigation instrument aur design ka hai, iska bhi 100 percent ensure nahi hota ki yeh hamesha sahi hoga. Isliye brokers ko hamesha legitimate gamble the executives ke saath is design ko istemal karna chahiye aur dusre specialized markers aur examination instruments ke saath joor karke exchanging choices lena chahiye
اب آن لائن
Working...
تبصرہ
Расширенный режим Обычный режим