Rectangle chart patterns:
-
AyubRanaSenior Member

- Sep 2020
- 1091
- 23
- 537
- 88 USD
-
<a href="https://www.instaforex.org/ru/?x=ruforum">InstaForex</a> -
AyubRanaSenior Member
- Sep 2020
- 1091
- 23
- 537
- 88 USD
Assalama alaikum dear members! Umeed ha ap sb thk hn gy or pak forex forum se acha knowledge gain kar rhy hn gy. dear members aj ki post main hum rectangle chart pattern ko study karen gy or dekhen gy k ye kb bnta ha or es ko kesy trade kia jay. What is Rectnagle pattern? Dear members rectangle pattern aik continuation pattern ha. Continuation pattern wo hota ha jo k js trend main bnta ha us trend k continue hony ki nishani hota ha.mtlb k agr bullish trend main bny to market bullish hi move karti habor bearish main bny to market bearish hi move karti ha. How it is formed? members jb ksi trend main trading volume km ho or volatility km ho jy market main to market aik support or resistance k darmyan range karny lg jati ha. mtlb k support or resistance k darmyan hi move karti ha or estrha aik rectangle ki shkl bnti ha. es pattern main jb market support ko touch kary to wapis resistance ki trf aa jati ha or resistance se support ki trf or jb tk rectangle ka breakout na ho esa chlta rhta ha. How to trade Rectangle? Dear members jb market rectangle pattern main chli jy to ap es main trade karny k lye rectangle k support or resistance areas se rejection ki confirmation k bad trade kar skty hain. support se ap buy ki trade le skty hain or resistance tk TP rkh skty hain. or es mai apka SL support or resistance hn ge jahan se ap trade karen gy usi k mutabiq. Breakout of rectangle: Dear members jb market rectangle se bhr nkl jati ha or es k bhr closing dy dyti ha to esko rectangle ka breakout kaha jata ha. Or es main trade leny k lye apko breakout ki confirmation ka wait karna chahye. breakout ki phli cobfirmation ye ha k market bary time frame main rectangle k bhr candle close kary or wapis breakout k bad es support ya resistance ko test kary jska breakout kia ha. to retest py ap es main sell ya buy ki trade le skty hain brealout k mutabiq mtlb agr support ka breakout hoa ha to ye bearish breakout ha or sell ki entry len. agr resistance ka breakout hoa ha to ye bullish breakout ha or buy ki entry len. -
sultan77Senior Member
- Apr 2023
- 714
- 34
- 3
Rectangle chart pattern forex market mein ek price consolidation pattern hai, jahan price range horizontal lines ke beech mein remain karta hai. Rectangle pattern ek continuation pattern bhi ho sakta hai, jahan price trend ko temporarily consolidate karta hai, ya phir ek reversal pattern bhi ho sakta hai, jahan price trend ko reverse karta hai. Chaliye is pattern ko detail mein samajhte hain: Rectangle Chart Pattern ki Khasiyat: 1. Price Consolidation: Rectangle pattern mein price horizontal lines ke beech mein consolidate hota hai. Yahan ek upper resistance line aur ek lower support line hoti hai, jinhe connect karke rectangle shape create hoti hai. 2. Sideways Price Movement: Rectangle pattern sideways price movement ko darshata hai, jahan price range-bound hota hai. Yeh price range high aur low levels ke beech mein remain karta hai. Pattern ki Interpretation: Rectangle pattern ka interpretation price consolidation aur potential breakout points ke aas paas hota hai. Agar price rectangle pattern ke andar remain kar raha hai, tab market consolidation phase mein hai aur price range-bound hai. Traders breakout ke liye wait kar sakte hain, jahan price upper resistance level ya lower support level ko break karta hai, indicating a potential trend continuation or reversal. Trading Strategies: 1. Breakout Trading: Agar price rectangle pattern ke upper resistance level ya lower support level ko break karta hai, tab traders us direction mein trade karte hain. Agar price upper resistance level ko break karta hai, toh traders long position enter kar sakte hain. Agar price lower support level ko break karta hai, toh traders short position enter kar sakte hain. 2. Stop-Loss: Traders ko breakout level ke thik niche stop-loss level set karna chahiye, taki wo unwanted losses se bacha sake, agar price breakout ko false signal prove karta hai. 3. Take-Profit: Traders ko target levels set karna zaroori hai, jahan wo apne profits book kar sakte hain. Iske liye previous swing high aur swing low levels, Fibonacci retracements, aur trend analysis ka istemal kiya ja sakta hai. Rectangle Chart Pattern ke Fayde: 1. Price Consolidation: Rectangle pattern price consolidation ko darshata hai, jisse traders ko trend reversal ya continuation points ko identify karne mein madad milti hai. 2. Breakout Opportunities: Pattern breakout ke liye potential trading opportunities create karta hai. Agar price resistance level ya support level ko break karta hai, tab traders trend continuation ya reversal mein trade kar sakte hain. 3. Risk Management: Stop-loss aur take-profit levels ko set karke traders apna risk management implement kar sakte hain. Conclusion : Rectangle chart pattern forex market mein price consolidation ko represent karta hai. Yeh ek continuation ya reversal pattern ho sakta hai. Rectangle pattern ke andar price range-bound hota hai, jahan price upper resistance level aur lower support level ke beech remain karta hai. Breakout ke samay traders trade enter karte hain. Is pattern ka sahi istemal karke traders price consolidation phase ko identify kar sakte hain aur breakout points ko capture karke profitable trades kar sakte hain. -
Duaa_786Senior Member
- Oct 2022
- 558
- 9
- 56
- 1 678 USD
What is long haul Exchanging taweel mudti tijarat, basorat deegar position exchanging ke naam se jana jata hai, aik tijarti andaaz se morad hai jis mein tajir aik taweel muddat tak kisi position standard Faiz rahay ga. position ki tijarat chand hafton se le kar do saal tak kahin bhi chal sakti hai. ziyada tar taweel mudti tijarti tajir bunyadi tajzia standard bohat ziyada inhisaar karte hain, kyunkay woh ziyada tar is market ke mustaqbil ke nuqta nazar se fikar mand hotay hain jis ki woh tijarat kar rahay hain. woh intra day utaar charhao se itnay ziyada fikar mand nahi hain aur is ke bajaye taweel mudti rujhan ko chalanay walay bunyadi awamil standard tawajah markooz karte hain. un ke taweel mudti nuqta nazar ki wajah se, taweel mudti tajir - apne tajziye ke liye aam peak standard rozana, hafta waar aur yahan tak ke mahana diagram ko dekhen ge . Key takeways taweel mudti tijarat se morad tijarat ka aik aisa andaaz hai jahan aik tajir aik taweel muddat ke liye position standard Faiz hota hai - ghaliban kayi saal. ziyada tar logon ke liye, kharidne aur holding ki aik ghair fa-aal taweel mudti hikmat e amli doulat peda karne ka behtareen choice hai. aap ko yeh maloom karna hoga ke aap ke liye kya behtar hai. qaleel mudti jhool ki hikmat e amli aap ki taweel mudti hikmat amlyon ke liye aik behtareen tanawu ka aala ho sakti hai . Significant Long haul Exchanges: Regarded people group individuals generally recall that drawn out exchanging ke liye account me huge total ka hona bhaut zauri hota hai q ki es exchanging me now and again misfortune jiana hota hai aur agar account little ho ga tu nahi mil pati wanted outcome. Long haul Exchanging Me hame bahut zida intezar karna bhag hai aur ho sakta hai ke ye intezar hafte se bhi zia time leis waja se hame apne little record pe kabhi bhi long haul exchanging nahi karne chaheye long haul exchanging aam tawar pe solid record holder hey You can endure the gamble, yet assuming the record is little, you probably shouldn't involve it for long haul exchanging. We need to keep up with the security and volume of the record and do long haul exchanging. Long haul exchanging implies making arrangements for what's to come. Long haul exchanging is a drawback of long haul exchanging. Surefire Benefit CO B MISS CARE Children HIN.SS LEYE Little Parcels I KEY Exchanging ON Regular routine IS THE Critical Best option FOR Little Record HOLDERS. Long haul exchanging me stocks long haul ke liye hold sharpen ki waja se to the point position pay target pohanch jata hai.jis ki market ki all over ko sambhana bhaag hai to os ki market me passage ki ja shaki. Specialized Investigation. Specialized Investigation Lambe Arse Tak Karobar Karne Mein Ahem Hai. I will assist you with understanding business sector patterns and cost designs utilizing value diagrams, markers and oscillators. Apparatuses, for example, candle graphs, moving midpoints or relative strength record (RSI) give market bearing and cost development data. -
younisfxSenior Member
- Apr 2021
- 1344
- 244
- 1807
- 236 USD
RECTANGLE CHART PATTERN DEFINITION Ek rectangle chart pattern Hota Hai Jab price parallel support aur resistance level Se munslik Hoti Hai Ek rectangle buying aur seller KundaGaon Ke Darmiyan consolidation ya indecision ki period ko show Karta Hai Jab vah Bari Bari ghoson ko throwing hai lekin donon mein se koi bhi dominated Hasil nahin karta hai price akher kar breaking se pehle kie bar support aur resistance level ki test kregi vahan se price ka trend break out ki direction ho sakta hai Chahe vah Upar ki taraf Ho ya niche ki taraf hanmain sirf is time tak waite karna hoga Jab Tak ke unmen se ek level break aur go along for the ride Ek market ka rectangle is time banta hai Jab pric down Trend ke dauran thori der ke liye consolidate Ho Jaati Hai Aisa isliye hota hai Kyunki seller ko mumkna Taur per pair ko niche Le jaane se pahle apni Saansen pause aur catch ki need hoti hai Agar hamare pass support level se bilkul niche Ek short order Hota Hai To Ham is trade per Achcha profit Kama sakte hain ''SIGNIFICANT'' SUPPORT AUR RASISTANCE Is example Mein price ne rectangle chart pattern Ke Niche ko Broke Diya aur niche ko shoot down karna continude Rakha izafee ke baad price thori der ke liye consolidate hone ke liye ruk gai Yahan Ek rectangle Ki Ek Aur example hai is bar Ek Bullish chart pattern hai Agar hamare pass resistance level ke upar Ek Long order Hota To Ham trade per Kuchh peace pakar lete bilkul ISI Tarah Jis Tarah Bearish rectangle pattern ki example mein Ek Baar Pair Breaks ke bad yah aamtaur per Ek move Karega Jo iski previous range ke size se kam hai Kis Tarah rectangle pattern ke upar pair ko torne ke bad price Puri Tarah Upar Jaati Hai
 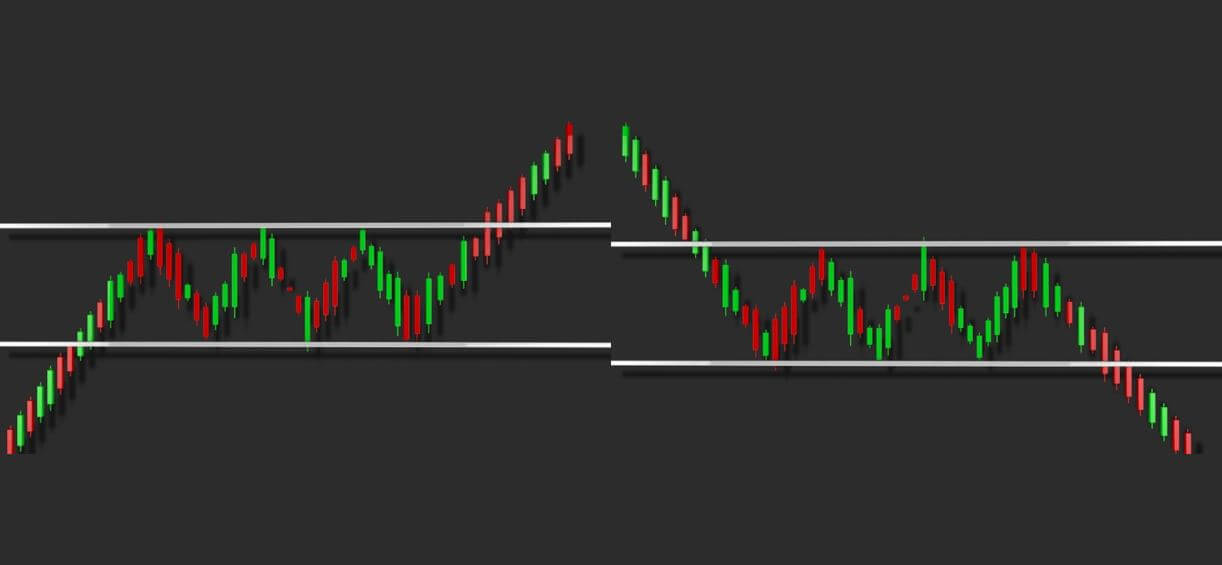 THE RECTANGLE IN CLASSICAL TECHNICAL ANALYSIs Rectangle Ek classical technical analysis ka pattern hai Jise horizontal lines ke zriye showing Kiya gaya hai journey weekend Jo significant support aur resistance ko zahar Karti Hai support per khareed kar yah resistance per bech kar ya formation se break out ka wait Karke aur measuring principal ko use Karke successfully se trade ki Ja sakti hai
-
AsimAyazSenior Member
- May 2022
- 186
- 27
- 153
- 86 USD
Describe Rectangle Chart Pattern: Rectangular ak chart pattron hai jub kimat mutvazi himayat or satha sy munsalik hoti haii rectangulor khredaro or ferokat kundgan k mabain estkam ya adam estkam ki mudat ki nomaish karta hai kio k ye trading sai sy krty hai lakin nahi es pr galba hasil hai kimat test bi akhir torny sy pahlly kai bar himayat or muzhamt ki satha hoti hai waha sy kimat ki break out ki simat mai rujhan paida kr skti hai chay woh ulta hu ya manfi pahlo sy Details: RectangleChartPattern ya Muharika Aik forex trading mein ahem chartpattern hai. Is pattern ka istemal forex market mein prices ka analysis karne ke liye kiya jata hai. Rectanglechartpatternrectangle ke shape ko resemble karta hai jahan price bars ke highs aur lows parallel lines banate hain. Ye pattern price consolidation aur price breakouts ki indication deta hai. Rectanglepattern ki samajh aapko trading decisions lene mein madad kar sakti hai. Rectanglepattern usually price continuation ya reversal trend ke indicators ke taur par consider kiya jata hai. Agar ek trend mein rectanglepattern ban raha hai, to ye price ko consolidate kar raha hai aur ek trend continuation ki indication deta hai. Agar rectanglepattern trend reversal ke baad ban raha hai, to ye trend reversal ka indication deta hai. Rectanglepattern ka formation price consolidation ke time hota hai. Price consolidation ek aisa phase hota hai jab market mein buyers aur sellers ke beech balance hota hai aur price range mein limited movement hota hai. Is phase mein traders uncertainty aur indecision ko indicate karta hai. Rectanglepattern ki samajh kar aap price ka behavior predict kar sakte hain. Rectanglepattern ko identify karne ke liye aapko price bars ki highs aur lows ko connect karna hota hai. Jab aap highs aur lows ko connect karte hain, to rectangle shape ban jata hai jahan price confined hota hai. Is pattern mein rectangle ke upper aur lower lines ko resistance aur support levels ke taur par consider kiya jata hai. 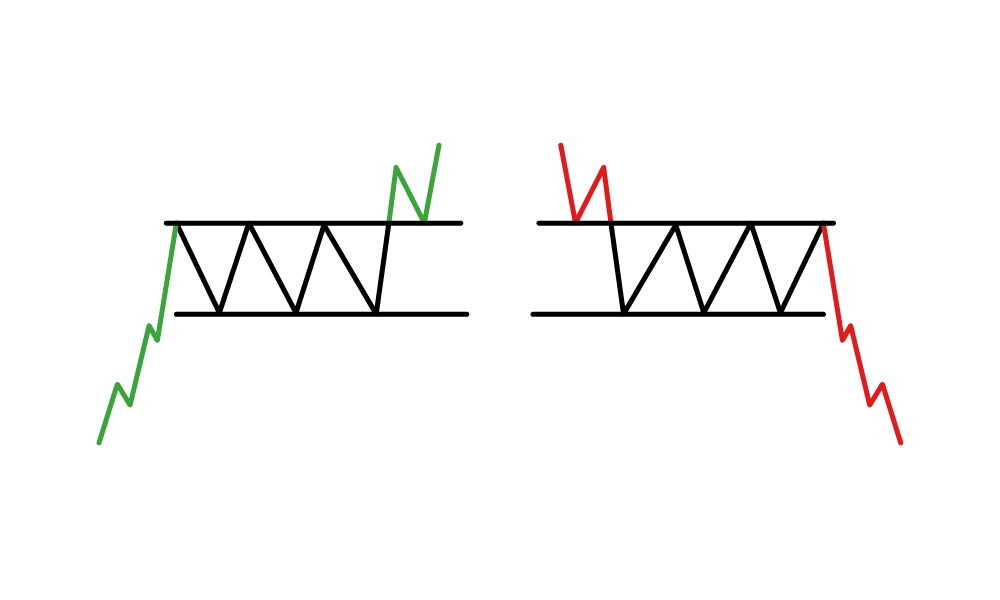 Trading point of View: A rectangle ki tasHkeel technical analysis Mein price ke pattern ki ek example hai rectangle ka chapter Samjha jata hai Jab graph paper per chart hand se Rakhe Jaate the to simple moving average ko hand se ya large clunky adding machine ke istemal se barkrar Rakhna parta hai pattern ki recognition ka matlab pattern ki prediction and ISI Tarah profit Ki Tijarat hoti hai price ke bahut se pattern Hindsi adadu shumar per mabni hai ascending descending and symmetrical triangle pennants and wedge hain jismein Head and Shoulder paya jata hai Kisi bhi situation Mein yah Ek Aisa pattern Hota Hai Jo traders ki indecision ko zahar karta hai jismein bulls and bear yaksa taur per powerful Mein Hote Hain Jyada Tare technique expert Kahate Hain rectangle reversal Hota Hai yah Upar Ja niche Ek trend ko khatm karta hai
 Thank YOU
-
<a href="https://www.instaforex.org/ru/?x=ruforum">InstaForex</a> -
MksaeedMember
- Mar 2023
- 66
- 458
- 1
Rectangle Chart Pattren Introduction Dear member forex market main jitna bhe pattren banty han in ki madad sa markrt ko technicaly analysis kiya jata ha rectangle pattren ki bat karen to ye support or ristance ki waja sa create hota ha market kisi range main movemkarti rehti ha 1 sport sa ristance tak to pher jab ham in levels ko line ki madad sa milaty han to rectangle chart pattren banta ye bahut strong pattren hota ha aen ham dekhty han ka is ko kasy verify karna ha or trade kasy karni ha. Rectangle pattren Formation Rectangle pattern main typically do horizontal parallel lines draw ki jati hain jinhe support aur resistance lines kehte hain. Support line price ki neechay ki taraf draw ki jati hai jabki resistance line price ki oopar ki taraf draw ki jati hai. Rectangle pattern main price bars in lines ke between range-bound hoti hain aur kisi particular trend ko indicate nahi karti hain.Rectangle pattern ki pehchan karne ke liye aapko price bars ke andar multiple touches ya bounces dekhne hote hain jahan price support aur resistance lines ke paas multiple baar touch karti hai. Ye touches roughly same level par honi chahiye indicating a strong support or resistance level. Rectangle pattern ko confirm karne ke liye, aapko breakout ka wait karna hota hai, jab price bars rectangle ke bahar move karte hain aur kisi ek direction main trend shuru karte hain. How To Trade Rectangle Pattren Rectangle pattern breakout ke baad traders isko trading opportunities ke liye istemal karte hain. Agar price rectangle ke upar breakout karta hai toh long positions enter kiye jate hain aur agar price rectangle ke neeche breakout karta hai toh short positions enter kiye jate hain. Stop loss aur target levels ko bhi properly define kiya jata hai taki risk management ka dhyan rakha ja sake.Rectangle pattern ke breakout ke baad, price usually breakout direction main continue karta hai aur traders is opportunity ka fayda uthate hain. However, ek baar breakout ho jane ke baad, false breakouts bhi ho sakte hain isliye stop loss aur risk management strategies ka istemal zaruri hota hai.Rectangle pattern forex market main common aur reliable pattern hai, jise traders apne trading strategies main istemal karte hain
اب آن لائن
Working...
تبصرہ
Расширенный режим Обычный режим