Best Support and resistance Indicator
-
Sara_ali_traderSenior Member

- Sep 2021
- 1332
- 181
- 625
- 902 USD
-
<a href="https://www.instaforex.org/ru/?x=ruforum">InstaForex</a> -
Sara_ali_traderSenior Member
- Sep 2021
- 1332
- 181
- 625
- 902 USD
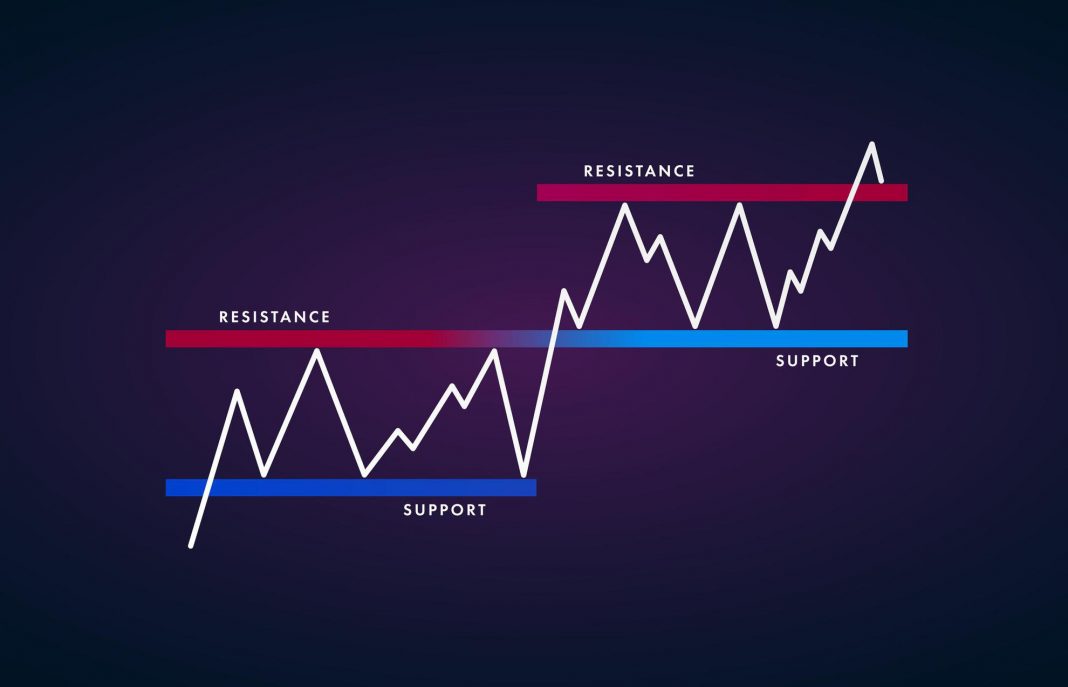
Introduction support or resistance indicator aik technical indicator hey jo keh candle stick chart par support zone or resistance zone ko reversal kar day ga yeh frex market mein strong support zone ko talash karnay kay ley chonay ka tayon kartay hein support or resistance indicator forex trading mein bet indicator hein en zones k daste tr par draining karnay kay bajay yeh indicator zones ke khod he zones ke planning kar kay apnay ap ko bacha saktay hein Indicator strong support or resistance zones kaisay meltay hein aik darst support or resistance zone ke chand khasoseyat hein price hamaisha support zone say oper ke taraf ochalte hey jab keh yeh resistance zone ko nechay ke taraf ochaltee hey dosree taraf jab support ya resistance zone ka breakout ho jata hey to price ka trend break out ke taraf ho jata hey Support Zone jab price 2 say 3 bar kese aik direction ko ochalte hey to yeh aik acha support zone ban jata hey important point yeh hey keh ap price ke wazah swing bonce mein talash karna chihay price ko chonay ya ochalnay kay ley aik katee hove market ke shape mein nahi hona chihay price hamaisha swing ya wave ke sorat mein movement karte hey Resistance Zone jab price bearish ke direction kay sath ochal kay sath 2 say 3 bar ochalte hey to forex market mein aik darst resistance zone ban jata hey yahan par price ka ochal swing ya wave ke sorat mein he hona chihay ap ko kate hova market say bachna chihay lahza support zone aik indicator hey or en parameter ko chart par talash karna chihay or bad serf darust ya zyada imkan wallay parameter ko talash karna chihay support or resistance zone breakout es parameter mein hum support ya resistance zone ko talash kar saken gay bad mein hum trend ke direction mein trade ko open kar saken gay mesal kay tor par jab price resistance zone ko breakout kar day ge to buy ke trade ko open karna chihay or recently swing low kay nechay stop loss rakhen resistance indicator breakout honay kay bad breakout candle ka label bhe reversal kar day ga dosree taraf jab price bare bearish candle stick kay sath support zone ko break kar dayte hey to aik bearish ka trend tashkeel pa jay ga Breakout candle stick kay bad indicator sel ya breakout ka label ready kar sakay ga recently swing high kay sath sell ke trade open karen Conclusion best support or resistance indicator jo dosray technical tools or indicator kay sath mel kar estamal karta hey darust zone ko draw keya jay ager koi trader indicator nahe jor raha hey to es trader kay nakam honay kay bohut zyada imkan hotay hein kunkeh trading bohut zyada imkan ka matlab hey kunkeh trading tamam imkanat ko barhanay kay baray mein hey or higher winning jes kay baray mein profitable trade hote heyTable of ContentIntroduction Indicator support or resistance zone kaisay meltay hein Support zone Resistance zone Support or Resistance zone Breakout Conclusion 
 bhali kay badlay bhali
 -
<a href="https://www.instaforex.org/ru/?x=ruforum">InstaForex</a> -
adnanheavyMember
- May 2023
- 85
- 3
- 5
InstaSpot: کسی بھی EPS اور بینک سے منافع واپس لیں، اور EPS اور cryptocurrencies کے تبادلے پر 7% تک کمائیں۔
Explanation of best support and resistance indicator?
Sabse behtareen support aur resistance indicator ka tajziya karne ke liye, sabse pehle yeh samajhna zaroori hai ke support aur resistance levels ko kaise pehchana jata hai. Ye levels market mein price ke movement ke darmiyan aksar prominent hote hain aur traders inko identify karke trading decisions lete hain. Yeh kuch indicators hain jo support aur resistance levels ko pehchanne mein madadgar ho sakte hain:
Horizontal Support aur Resistance Lines
Yeh asaan lines hote hain jo price chart par draw kiye jate hain aur un points ko represent karte hain jahan price ke movement mein tezi se badlav aya tha, ya phir price ne ek level ko touch kiya tha lekin usay cross nahi kiya tha. Yeh levels manually traders dwaara identify kiye jate hain.
Moving Averages
Moving averages, jaise ke simple moving average (SMA) ya exponential moving average (EMA), dynamic support aur resistance levels ke taur par kaam kar sakte hain. Traders in moving averages ke bounces aur breaks ko dekhte hain taake potential support aur resistance zones ko pehchan sakein.
Pivot Points
Pivot points pichle din ke high, low, aur close prices ke basis par calculate kiye jate hain, aur yeh current trading day ke liye potential support aur resistance levels pradaan karte hain. Various methods hain pivot points calculate karne ke liye, jaise ke classic method, Camarilla method, aur Fibonacci method.
Bollinger Bands
Bollinger Bands mein ek simple moving average (middle band) hota hai, jismein upper aur lower bands volatility-based support aur resistance levels ko darust karte hain. Jab price upper band ke paas aati hai, woh resistance ka kaam karta hai, jabki lower band support ka kaam karta hai.
Fibonacci Retracement Levels
Fibonacci retracement levels previous price movement ke basis par calculate kiye jate hain aur woh potential support aur resistance levels provide karte hain. Fibonacci retracement levels traders ke beech mein popular hote hain aur unko price reversals aur trend extensions ke liye istemal kiya jata hai.
In indicators ko istemal karke traders support aur resistance levels ko identify karte hain, lekin yaad rahe ke har ek trader ka apna tareeqa hota hai aur koi bhi indicator ek universal solution nahi hai. Aapko apni trading style aur preferences ke mutabiq sahi indicator chunna hoga.


Working...
تبصرہ
Расширенный режим Обычный режим