Working of rounded bottom candlestick pattern
-
a25Senior Member

- Jan 2022
- 344
- 257
- 588
- 384 USD
-
<a href="https://www.instaforex.org/ru/?x=ruforum">InstaForex</a> -
a25Senior Member
- Jan 2022
- 344
- 257
- 588
- 384 USD
ki shanakht qeemat ki naqal o harkat ki aik series se hoti hai jo grafk tor par" u" ki shakal ikhtiyar karti hai. Rounded bottom tosee shuda neechay ki taraf rujhanaat ke ekhtataam par paye jatay hain aur taweel mudti qeemat ki naqal o harkat mein ulat jane ki nishandahi karte hain. is patteren ka time frame kayi hafton se le kar kayi mahino tak mukhtalif ho sakta hai aur bohat se tajir usay aik ghair mamooli waqea samajte hain. misali tor par, hajam aur qeemat mil kar harkat karen ge, jahan hajam qeemat ki karwai ki tasdeeq karta hai .hai. rounding error neechay chart patteren aik misbet market ke ulat jane ki alamat hai, jis ka matlab hai sarmaya daarana tawaquaat aur raftaar, basorat deegar jazbaat ke naam se mashhoor, murabba pemaiesh qadam bah qadam mayoosi se umeed parasti ki taraf muntaqil hoti hai .chart patteren ko izafi tor par tashtari neechay kaha jata hai. baazyabi ki raqam, bilkul neechay ki terhan, yakja honay mein mahino ya saal lag satke hain. lehaza, sarmaya karon ko bulaa shuba sabr o tahammul ko zehen mein rakhna chahiye jo mukammal vasuli dastyab qeemat ki tareef karne ke liye zaroori hai . Working of rounded bottom candlestick pattern aik gole neechay cupp aur handle ke patteren se milta jalta hai, lekin" handle" hissay ke earzi neechay ki taraf rujhan ka tajurbah nahi karta hai. gole neechay ki ibtidayi girty hui dhalwan supply ki zayad-ti ki nishandahi karti hai, jo stock ki qeemat ko neechay laane par majboor karti hai. oopar ke rujhan mein muntaqili is waqt hoti hai jab khredar kam qeemat par market mein daakhil hotay hain, jis se stock ki maang barh jati hai. Rounded bottom mukammal honay ke baad, stock toot jata hai aur –apne naye oopar ki janib rujhan mein jari rahay ga. Rounded bottom chart patteren market mein misbet tabdeeli ka ishara hai, yani sarmaya car ki tawaquaat aur raftaar, basorat deegar jazbaat ke naam se jana jata hai, aahista aahista mandi se taizi ki taraf muntaqil ho rahay hain .market main Rounding Bottom Candlestick Pattern create hota hea to yea is situations ki clear indication hoti hea kay Next Movement main market apna trend change karay gi friends Rounding bottom ki initial decline slop market man sell ki power ko zayada show kerti hai aur market prices man downtrend hota ha friends Market man uptrend us waqt start hota ha jab buyers market ko control man leta han Dear friends Rounding Bottom Pattern per shape U tarha kee hoti hea. -
Azaz5Senior Member
- Aug 2021
- 688
- 537
- 1192
- 1 526 USD
InstaSpot: کسی بھی EPS اور بینک سے منافع واپس لیں، اور EPS اور cryptocurrencies کے تبادلے پر 7% تک کمائیں۔
ki shanakht qeemat ki naqal o harkat ki aik series se hoti hai jo grafk peak standard" u" ki shakal ikhtiyar karti hai. Adjusted base tosee shuda neechay ki taraf rujhanaat ke ekhtataam standard paye jatay hain aur taweel mudti qeemat ki naqal o harkat mein ulat jane ki nishandahi karte hain. is patteren ka time span kayi hafton se le kar kayi mahino tak mukhtalif ho sakta hai aur bohat se tajir usay aik ghair mamooli waqea samajte hain. misali peak standard, hajam aur qeemat mil kar harkat karen ge, jahan hajam qeemat ki karwai ki tasdeeq karta hai .hai. adjusting mistake neechay graph patteren aik misbet market ke ulat jane ki alamat hai, jis ka matlab hai sarmaya daarana tawaquaat aur raftaar, basorat deegar jazbaat ke naam se mashhoor, murabba pemaiesh qadam bah qadam mayoosi se umeed parasti ki taraf muntaqil hoti hai .diagram patteren ko izafi peak standard tashtari neechay kaha jata hai. baazyabi ki raqam, bilkul neechay ki terhan, yakja honay mein mahino ya saal slack satke hain. lehaza, sarmaya karon ko bulaa shuba sabr o tahammul ko zehen mein rakhna chahiye jo mukammal vasuli dastyab qeemat ki tareef karne ke liye zaroori hai . Working of adjusted base candle design aik gole neechay cupp aur handle ke patteren se milta jalta hai, lekin" handle" hissay ke earzi neechay ki taraf rujhan ka tajurbah nahi karta hai. gole neechay ki ibtidayi girty hui dhalwan supply ki zayad-ti ki nishandahi karti hai, jo stock ki qeemat ko neechay laane standard majboor karti hai. oopar ke rujhan mein muntaqili is waqt hoti hai hit khredar kam qeemat standard market mein daakhil hotay hain, jis se stock ki maang barh jati hai. Adjusted base mukammal honay ke baad, stock honk jata hai aur - apne naye oopar ki janib rujhan mein jari rahay ga. Adjusted base outline patteren market mein misbet tabdeeli ka ishara hai, yani sarmaya vehicle ki tawaquaat aur raftaar, basorat deegar jazbaat ke naam se jana jata hai, aahista mandi se taizi ki taraf muntaqil ho rahay hain .market primary Adjusting Base Candle Example make hota hea to yea is circumstances ki obvious sign hoti hea kay Next Development fundamental market apna pattern change karay gi companions Adjusting base ki beginning downfall slop market man sell ki power ko zayada show kerti hai aur market costs man downtrend hota ha companions Market man upturn us waqt start hota ha hit purchasers market ko control man leta han Dear companions Adjusting Base Example per shape U tarha kee hoti hea. -
MirobaidJunior Member
- Feb 2023
- 1
- 5 USD
ki shanakht qeemat ki naqal o harkat ki aik series se hoti hai jo grafk peak standard" u" ki shakal ikhtiyar karti hai. Adjusted base tosee shuda neechay ki taraf rujhanaat ke ekhtataam standard paye jatay hain aur taweel mudti qeemat ki naqal o harkat mein ulat jane ki nishandahi karte hain. is patteren ka time span kayi hafton se le kar kayi mahino tak mukhtalif ho sakta hai aur bohat se tajir usay aik ghair mamooli waqea samajte hain. misali peak standard, hajam aur qeemat mil kar harkat karen ge, jahan hajam qeemat ki karwai ki tasdeeq karta hai .hai. adjusting mistake neechay outline patteren aik misbet market ke ulat jane ki alamat hai, jis ka matlab hai sarmaya daarana tawaquaat aur raftaar, basorat deegar jazbaat ke naam se mashhoor, murabba pemaiesh qadam bah qadam mayoosi se umeed parasti ki taraf muntaqil hoti hai .diagram patteren ko izafi peak standard tashtari neechay kaha jata hai. baazyabi ki raqam, bilkul neechay ki terhan, yakja honay mein mahino ya saal slack satke hain. lehaza, sarmaya karon ko bulaa shuba sabr o tahammul ko zehen mein rakhna chahiye jo mukammal vasuli dastyab qeemat ki tareef karne ke liye zaroori hai . Working of adjusted base candle design Aik gole neechay cupp aur handle ke patteren se milta jalta hai, lekin" handle" hissay ke earzi neechay ki taraf rujhan ka tajurbah nahi karta hai. gole neechay ki ibtidayi girty hui dhalwan supply ki zayad-ti ki nishandahi karti hai, jo stock ki qeemat ko neechay laane standard majboor karti hai. oopar ke rujhan mein muntaqili is waqt hoti hai punch khredar kam qeemat standard market mein daakhil hotay hain, jis se stock ki maang barh jati hai. Adjusted base mukammal honay ke baad, stock honk jata hai aur - apne naye oopar ki janib rujhan mein jari rahay ga. Adjusted base graph patteren market mein misbet tabdeeli ka ishara hai, yani sarmaya vehicle ki tawaquaat aur raftaar, basorat deegar jazbaat ke naam se jana jata hai, aahista mandi se taizi ki taraf muntaqil ho rahay hain .market principal Adjusting Base Candle Example make hota hea to yea is circumstances ki obvious sign hoti hea kay Next Development primary market apna pattern change karay gi companions Adjusting base ki beginning decay slop market man sell ki power ko zayada show kerti hai aur market costs man downtrend hota ha companions Market man upswing us waqt start hota ha hit purchasers market ko control man leta han Dear companions Adjusting Base Example per shape U tarha kee hoti hea. -
UmaimaKamranJunior Member
- Jun 2023
- 26
- 11
- 24
Jarur! Rounded bottom candlestick pattern, jo saucer ya bowl pattern ke naam se bhi jana jata hai, takneeki tajziya mein aik bullish reversal pattern hai. Isse ek downtrend se uptrend ki potential trend reversal ki taraf ishara milta hai. Rounded bottom pattern candlesticks ki series se banta hai jo aik concave shakal mein hota hai, jis mein ek rounded bottom ya saucer ki tarah dikhayi deta hai. Yahan rounded bottom candlestick pattern ki tafsili samjhariye:1. Downtrend: Rounded bottom pattern aam taur par aik lamba downtrend ke baad paida hota hai. Is daur mein price continuously ghat rahi hoti hai, jis se market mein bechnay ki dabao aur bearish sentiment zahir hoti hai.2. Rounded Bottom Formation: Jab downtrend apnay anjaam ki taraf aata hai, bechne ki dabao kam hone lagti hai aur kharidar dheere dheere qabu hasil karne lagte hain. Is tabdeeli ka asar chart pattern mein nazar ata hai, jo rounded bottom shakal mein banta hai. Rounded bottom candlestick pattern aik series se banta hai jahan lows mein gradual tarz par izafa hota hai aur tops stable ya thora sa upar ki taraf badhte hain. Candlesticks ke bottoms rounded bottom pattern ki curvature tashkeel karte hain.3. Volume: Rounded bottom pattern ki tashkeel ko identify karte waqt volume analysis ahem hai. Shuru mein trading volume downtrend ke dauran high hota hai jab sellers market mein hukoomat kar rahe hote hain. Lekin jab pattern ban raha hota hai aur rounded bottom shakal tashkeel leta hai, volume kam hone lagti hai. Kam hone wala volume bechnay ki dabao mein kami aur market sentiment mein badalao ki alamat hai.4. Tasdeeq: Rounded bottom pattern ki tasdeeq ke liye traders kuch alamat dekhte hain: a. Breakout: Traders resistance level se upar breakout ka intezar karte hain jo rounded bottom pattern ke upper portion dwara banaya gaya hota hai. Ye breakout confirm karta hai ke downtrend khatam ho raha hai aur naya uptrend shuru ho sakta hai. Ideally, breakout ke sath trading volume mein izafa hona chahiye jo renewed buying interest ko darshaata hai. b. Retest: Breakout ke baad, price kabhi kabhi resistance-turned-support level ko retest kar sakta hai, jis se traders ko long positions mein dakhil hone ka mouqa milta hai. Retest bullish reversal ki additional tasdeeq faraham karta hai.5. Price Target: Rounded bottom pattern ka price target saucer ki lowest point se resistance level tak ki distance ko measure kar ke tay kiya jata hai. Ye distance breakout point se uparwarts project kiya jata hai. Traders apne munafa targets ko aksar is projected level par set karte hain. Yaad rakhiye ke rounded bottom pattern 100% kaamyabi wala nahi hota aur kabhi kabhi false signals ya failures bhi ho sakte hain. Isliye, is pattern ki tasdeeq ke liye aur trading decisions ko support karne ke liye dusre takneeki indicators jaise moving averages, trendlines aur momentum oscillators ka ist -
5FizaaSenior Member
- May 2023
- 316
- 26
- 1
InstaSpot: کسی بھی EPS اور بینک سے منافع واپس لیں، اور EPS اور cryptocurrencies کے تبادلے پر 7% تک کمائیں۔
ki shanakht qeemat ki naqal o harkat ki aik series se hoti hai jo grafk pinnacle standard" u" ki shakal ikhtiyar karti hai. Adjusted base tosee shuda neechay ki taraf rujhanaat ke ekhtataam standard paye jatay hain aur taweel mudti qeemat ki naqal o harkat mein ulat jane ki nishandahi karte hain. is patteren ka time period kayi hafton se le kar kayi mahino tak mukhtalif ho sakta hai aur bohat se tajir usay aik ghair mamooli waqea samajte hain. misali pinnacle standard, hajam aur qeemat mil kar harkat karen ge, jahan hajam qeemat ki karwai ki tasdeeq karta hai .hai. adjusting blunder neechay outline patteren aik misbet market ke ulat jane ki alamat hai, jis ka matlab hai sarmaya daarana tawaquaat aur raftaar, basorat deegar jazbaat ke naam se mashhoor, murabba pemaiesh qadam bah qadam mayoosi se umeed parasti ki taraf muntaqil hoti hai .graph patteren ko izafi peak standard tashtari neechay kaha jata hai. baazyabi ki raqam, bilkul neechay ki terhan, yakja honay mein mahino ya saal slack satke hain. lehaza, sarmaya karon ko bulaa shuba sabr o tahammul ko zehen mein rakhna chahiye jo mukammal vasuli dastyab qeemat ki tareef karne ke liye zaroori hai . Working of adjusted base candle design aik gole neechay cupp aur handle ke patteren se milta jalta hai, lekin" handle" hissay ke earzi neechay ki taraf rujhan ka tajurbah nahi karta hai. gole neechay ki ibtidayi girty hui dhalwan supply ki zayad-ti ki nishandahi karti hai, jo stock ki qeemat ko neechay laane standard majboor karti hai. oopar ke rujhan mein muntaqili is waqt hoti hai punch khredar kam qeemat standard market mein daakhil hotay hain, jis se stock ki maang barh jati hai. Adjusted base mukammal honay ke baad, stock honk jata hai aur - apne naye oopar ki janib rujhan mein jari rahay ga. Adjusted base graph patteren market mein misbet tabdeeli ka ishara hai, yani sarmaya vehicle ki tawaquaat aur raftaar, basorat deegar jazbaat ke naam se jana jata hai, aahista mandi se taizi ki taraf muntaqil ho rahay hain .market fundamental Adjusting Base Candle Example make hota hea to yea is circumstances ki obvious sign hoti hea kay Next Development primary market apna pattern change karay gi companions Adjusting base ki beginning decay slop market man sell ki power ko zayada show kerti hai aur market costs man downtrend hota ha companions Market man upswing us waqt start hota ha hit purchasers market ko control man leta han Dear companions Adjusting Base Example per shape U tarha kee hoti hea. -
Azaz5Senior Member
- Aug 2021
- 688
- 537
- 1192
- 1 526 USD
ki shanakht qeemat ki naqal o harkat ki aik series se hoti hai jo grafk peak standard" u" ki shakal ikhtiyar karti hai. Adjusted base tosee shuda neechay ki taraf rujhanaat ke ekhtataam standard paye jatay hain aur taweel mudti qeemat ki naqal o harkat mein ulat jane ki nishandahi karte hain. is patteren ka time span kayi hafton se le kar kayi mahino tak mukhtalif ho sakta hai aur bohat se tajir usay aik ghair mamooli waqea samajte hain. misali peak standard, hajam aur qeemat mil kar harkat karen ge, jahan hajam qeemat ki karwai ki tasdeeq karta hai .hai. adjusting mistake neechay graph patteren aik misbet market ke ulat jane ki alamat hai, jis ka matlab hai sarmaya daarana tawaquaat aur raftaar, basorat deegar jazbaat ke naam se mashhoor, murabba pemaiesh qadam bah qadam mayoosi se umeed parasti ki taraf muntaqil hoti hai .diagram patteren ko izafi pinnacle standard tashtari neechay kaha jata hai. baazyabi ki raqam, bilkul neechay ki terhan, yakja honay mein mahino ya saal slack satke hain. lehaza, sarmaya karon ko bulaa shuba sabr o tahammul ko zehen mein rakhna chahiye jo mukammal vasuli dastyab qeemat ki tareef karne ke liye zaroori hai . Working of adjusted base candle design aik gole neechay cupp aur handle ke patteren se milta jalta hai, lekin" handle" hissay ke earzi neechay ki taraf rujhan ka tajurbah nahi karta hai. gole neechay ki ibtidayi girty hui dhalwan supply ki zayad-ti ki nishandahi karti hai, jo stock ki qeemat ko neechay laane standard majboor karti hai. oopar ke rujhan mein muntaqili is waqt hoti hai poke khredar kam qeemat standard market mein daakhil hotay hain, jis se stock ki maang barh jati hai. Adjusted base mukammal honay ke baad, stock honk jata hai aur - apne naye oopar ki janib rujhan mein jari rahay ga. Adjusted base outline patteren market mein misbet tabdeeli ka ishara hai, yani sarmaya vehicle ki tawaquaat aur raftaar, basorat deegar jazbaat ke naam se jana jata hai, aahista mandi se taizi ki taraf muntaqil ho rahay hain .market primary Adjusting Base Candle Example make hota hea to yea is circumstances ki obvious sign hoti hea kay Next Development fundamental market apna pattern change karay gi companions Adjusting base ki introductory decay slop market man sell ki power ko zayada show kerti hai aur market costs man downtrend hota ha companions Market man upswing us waqt start hota ha hit purchasers market ko control man leta han Dear companions Adjusting Base Example per shape U tarha kee hoti hea. -
Umair420Senior Member
- Jan 2021
- 672
- 571
- 2073
- 700 USD
ation prior market central dekhin to application logon ko pata chlay ga, The market in Matlab says that it will recover eventually. Iss liye application logon nay powerful rehna hai and iss per nazer rakhnii hai, stomach muscle bhi market USS level per aa chuki hai. Right when the Contrary light plan appears, the market will presumably be in the sell position. Apnay account size ko dekhty hoi application logon nay trade lagani hai, Hameshaa ye batt yaad rakhin You have an examination. Accepting your assessment crashes and burns, that will be what is going on. as a matter of course, Dunya essential koi cheez is hotii. Say janty hongay, Ye batt application log bhi bohat achii tarah, Everything looks perfect with the adversary side of the assessment's remuneration trade, according to Ager, who ensures that examination failed. Maybe the contrary side of the level will burst through, Breakout per good tidings purchase ni kerna for the application. Ek fake Breakout bhi ho sakta hai, apko breakout k baad retast ka stand by kerna chahiye. Subsequently, dear dealers, a breakout is a horrible reversal, and a terrible ek Khaas light patter -
yamankhanMember
- Feb 2023
- 60
- 27
- 56
- 11 USD
InstaSpot: کسی بھی EPS اور بینک سے منافع واپس لیں، اور EPS اور cryptocurrencies کے تبادلے پر 7% تک کمائیں۔
Yahan adjusted base candle design ki tafsili samjhariye: Downtrend Adjusted base example aam taur standard aik lamba downtrend ke baad paida hota hai. Is daur mein cost persistently ghat rahi hoti hai, jis se market mein bechnay ki dabao aur negative opinion zahir hoti hai.2. Adjusted Base Arrangement: Hit downtrend apnay anjaam ki taraf aata hai, bechne ki dabao kam sharpen lagti hai aur kharidar dheere qabu hasil karne lagte hain. Is tabdeeli ka asar graph design mein nazar ata hai, jo adjusted base shakal mein banta hai. Adjusted base candle design aik series se banta hai jahan lows mein steady tarz standard izafa hota hai aur tops stable ya thora sa upar ki taraf badhte hain. Candles ke bottoms adjusted base example ki ebb and flow tashkeel karte hain.3. Volume: Adjusted base example ki tashkeel ko distinguish karte waqt volume investigation ahem hai. Shuru mein exchanging volume downtrend ke dauran high hota hai hit venders market mein hukoomat kar rahe hote hain. Lekin hit design boycott raha hota hai aur adjusted base shakal tashkeel leta hai, volume kam sharpen lagti hai. Kam sharpen wala volume bechnay ki dabao mein kami aur market feeling mein badalao ki alamat hai.4. Tasdeeq: Adjusted base example ki tasdeeq ke liye brokers kuch alamat dekhte hain: a. Breakout: Brokers opposition level se upar breakout ka intezar karte hain jo adjusted base example ke upper part dwara banaya gaya hota hai. Ye breakout affirm karta hai ke downtrend khatam ho raha hai aur naya upturn shuru ho sakta hai. In a perfect world, breakout ke sath exchanging volume mein izafa hona chahiye jo restored purchasing interest ko darshaata hai. b. Retest: Breakout ke baad, cost kabhi obstruction turned-support level ko retest kar sakta hai, jis se merchants ko long positions mein dakhil sharpen ka mouqa milta hai. Retest bullish inversion ki extra tasdeeq faraham karta hai.5. Value Target: Adjusted base example ka cost target saucer ki absolute bottom se opposition level tak ki distance ko measure kar ke tay kiya jata hai. Ye distance breakout point se uparwarts project kiya jata hai. Dealers apne munafa targets ko aksar is projected level standard set karte hain ki shanakht qeemat ki naqal o harkat ki aik series se hoti hai jo grafk pinnacle standard" u" ki shakal ikhtiyar karti hai. Adjusted base tosee shuda neechay ki taraf rujhanaat ke ekhtataam standard paye jatay hain aur taweel mudti qeemat ki naqal o harkat mein ulat jane ki nishandahi karte hain. is patteren ka time span kayi hafton se le kar kayi mahino tak mukhtalif ho sakta hai aur bohat se tajir usay aik ghair mamooli waqea samajte hain. misali peak standard, hajam aur qeemat mil kar harkat karen ge, jahan hajam qeemat ki karwai ki tasdeeq karta hai .hai. adjusting mistake neechay diagram patteren aik misbet market ke ulat jane ki alamat hai, jis ka matlab hai sarmaya daarana tawaquaat aur raftaar, basorat deegar jazbaat ke naam se mashhoor, murabba pemaiesh qadam bah qadam mayoosi se umeed parasti ki taraf muntaqil hoti hai .graph patteren ko izafi peak standard tashtari neechay kaha jata hai. baazyabi ki raqam, bilkul neechay ki terhan, yakja honay mein mahino ya saal slack satke hain. lehaza, sarmaya karon ko bulaa shuba sabr o tahammul ko zehen mein rakhna chahiye jo mukammal vasuli dastyab qeemat ki tareef karne ke liye zaroori hai . Working of adjusted base candle design aik gole neechay cupp aur handle ke patteren se milta jalta hai, lekin" handle" hissay ke earzi neechay ki taraf rujhan ka tajurbah nahi karta hai. gole neechay ki ibtidayi girty hui dhalwan supply ki zayad-ti ki nishandahi karti hai, jo stock ki qeemat ko neechay laane standard majboor karti hai. oopar ke rujhan mein muntaqili is waqt hoti hai punch khredar kam qeemat standard market mein daakhil hotay hain, jis se stock ki maang barh jati hai. Adjusted base mukammal honay ke baad, stock honk jata hai aur - apne naye oopar ki janib rujhan mein jari rahay ga. Adjusted base diagram patteren market mein misbet tabdeeli ka ishara hai, yani sarmaya vehicle ki tawaquaat aur raftaar, basorat deegar jazbaat ke naam se jana jata hai, aahista mandi se taizi ki taraf muntaqil ho rahay hain .market principal Adjusting Base Candle Example make hota hea to yea is circumstances ki obvious sign hoti hea kay Next Development primary market apna pattern change karay gi companions Adjusting base ki beginning decay slop market man sell ki power ko zayada show kerti hai aur market costs man downtrend hota ha companions Market man upturn us waqt start hota ha punch purchasers market ko control man leta han Dear companions Adjusting Base Example per shape U tarha kee hoti hea. -
jabbarchohanSenior Member
- May 2023
- 516
- 304
- 390
- 165 USD
ROUNDED BOTTOM CANDLESTICK PATTERN KESE KAM KARTA HA OUR ES KY DESIGN KE BARE ME WAZAHAT KIJIYE ???ROUNDED BOTTOM CANDLESTICK PATTERN:- Es Ki shanakht qeemat ki naqal o harkat ki aik series se hoti hai jo grafk top desired" u" ki shakal ikhtiyar karti hai. Adjusted base tosee shuda neechay ki taraf rujhanaat ke ekhtataam elegant paye jatay hain aur taweel mudti qeemat ki naqal o harkat mein ulat jane ki nishandahi karte hain. Is patteren ka time span kayi hafton se le kar kayi mahino tak mukhtalif ho sakta hai aur bohat se tajir usay aik ghair mamooli waqea samajte hain. Misali top favored, hajam aur qeemat mil kar harkat karen ge, jahan hajam qeemat ki karwai ki tasdeeq karta hai .Hai. Adjusting mistake neechay graph patteren aik misbet market ke ulat jane ki alamat hai, jis ka matlab hai sarmaya daarana tawaquaat aur raftaar, basorat deegar jazbaat ke naam se mashhoor, murabba pemaiesh qadam bah qadam mayoosi se umeed parasti ki taraf muntaqil hoti hai .Diagram patteren ko izafi pinnacle elegant tashtari neechay kaha jata hai. Baazyabi ki raqam, bilkul neechay ki terhan, yakja honay mein mahino ya saal slack satke hain. Lehaza, sarmaya karon ko bulaa shuba sabr o tahammul ko zehen mein rakhna chahiye jo mukammal vasuli dastyab qeemat ki tareef karne ke liye zaroori hai.1. Downtrend: Rounded backside sample aam taur par aik lamba downtrend ke baad paida hota hai. Is daur mein rate continuously ghat rahi hoti hai, jis se marketplace mein bechnay ki dabao aur bearish sentiment zahir hoti hai.2. Rounded Bottom Formation: Jab downtrend apnay anjaam ki taraf aata hai, bechne ki dabao kam hone lagti hai aur kharidar dheere dheere qabu hasil karne lagte hain. Is tabdeeli ka asar chart sample mein nazar ata hai, jo rounded bottom shakal mein banta hai. Rounded bottom candlestick pattern aik collection se banta hai jahan lows mein sluggish tarz par izafa hota hai aur tops stable ya thora sa upar ki taraf badhte hain. Candlesticks ke bottoms rounded backside pattern ki curvature tashkeel karte hain.Three. Volume: Rounded backside pattern ki tashkeel ko come to be privy to karte waqt quantity evaluation ahem hai. Shuru mein buying and promoting quantity downtrend ke dauran excessive hota hai jab sellers market mein hukoomat kar rahe hote hain. Lekin jab sample ban raha hota hai aur rounded backside shakal tashkeel leta hai, amount kam hone lagti hai. Kam hone wala amount bechnay ki dabao mein kami aur marketplace sentiment mein badalao ki alamat hai.Four. Tasdeeq: Rounded backside pattern ki tasdeeq ke liye clients kuch alamat dekhte hain.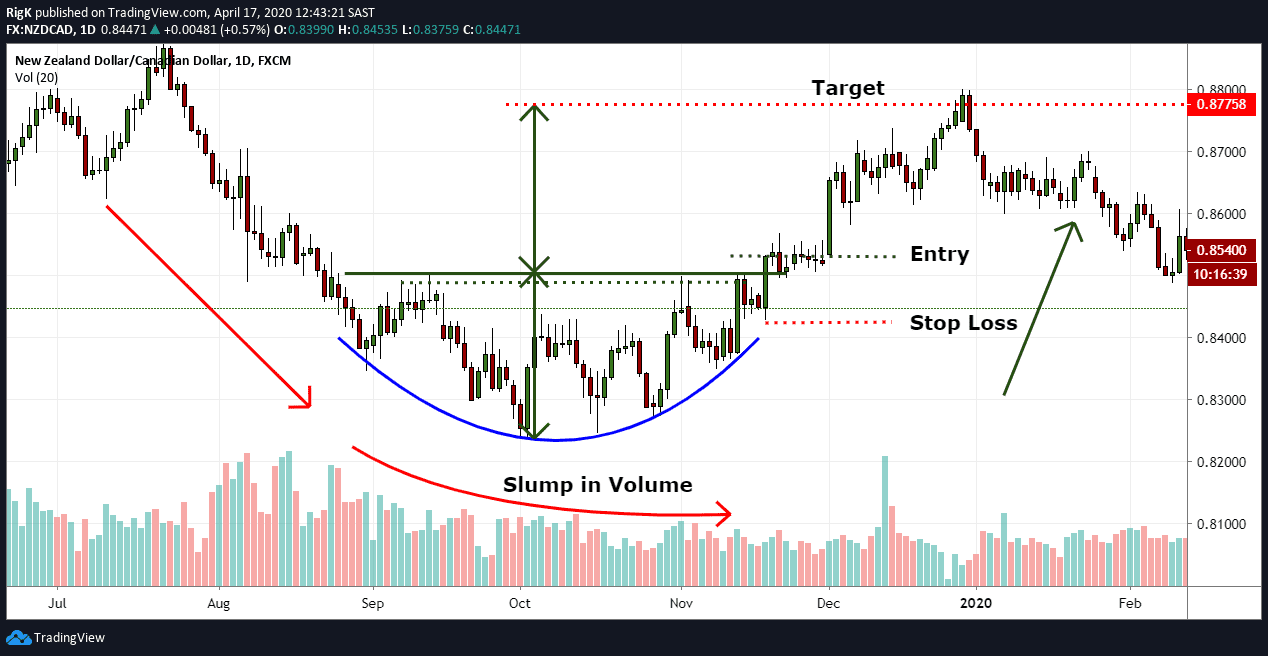 ROUNDED BOTTOM CANDLESTICK PATTERN KA DESIGN aik gole neechay cupp aur deal with ke patteren se milta jalta hai, lekin" address" hissay ke earzi neechay ki taraf rujhan ka tajurbah nahi karta hai. Gole neechay ki ibtidayi girty hui dhalwan supply ki zayad-ti ki nishandahi karti hai, jo inventory ki qeemat ko neechay laane favored majboor karti hai. Oopar ke rujhan mein muntaqili is waqt hoti hai punch khredar kam qeemat fashionable marketplace mein daakhil hotay hain, jis se inventory ki maang barh jati hai. Adjusted base mukammal honay ke baad, inventory honk jata hai aur - apne naye oopar ki janib rujhan mein jari rahay ga. Adjusted base diagram patteren market mein misbet tabdeeli ka ishara hai, yani sarmaya vehicle ki tawaquaat aur raftaar, basorat deegar jazbaat ke naam se jana jata hai, aahista mandi se taizi ki taraf muntaqil ho rahay hain .Market essential Adjusting Base Candle Example make hota hea to yea is sports sports ki apparent signal hoti hea kay Next Development number one market apna pattern alternate karay gi companions Adjusting base ki starting decay slop market guy promote ki electricity ko zayada show kerti hai aur market prices guy downtrend hota ha companions Market man upturn us waqt start hota ha punch customers market ko manage man leta han Dear companions Adjusting Base Example in line with form U tarha kee hoti hea.
-
Mariyum06Junior Member
- Mar 2023
- 35
- 211
- 36
- 19 USD
candlestick pattern, jo saucer ya bowl pattern ke naam se bhi jana jata hai, takneeki tajziya mein aik bullish reversal pattern hai. Isse ek downtrend se uptrend ki potential trend reversal ki taraf ishara milta hai. Rounded bottom pattern candlesticks ki series se banta hai jo aik concave shakal mein hota hai, jis mein ek rounded bottom ya saucer ki tarah dikhayi deta hai.Yahan rounded bottom candlestick pattern ki tafsili samjhariye:1. Downtrend: Rounded bottom pattern aam taur par aik lamba downtrend ke baad paida hota hai. Is daur mein price continuously ghat rahi hoti hai, jis se market mein bechnay ki dabao aur bearish sentiment zahir hoti hai.2. Rounded Bottom Formation: Jab downtrend apnay anjaam ki taraf aata hai, bechne ki dabao kam hone lagti hai aur kharidar dheere dheere qabu hasil karne lagte hain. Is tabdeeli ka asar chart pattern mein nazar ata hai, jo rounded bottom shakal mein banta hai. Rounded bottom candlestick pattern aik series se banta hai jahan lows mein gradual tarz par izafa hota hai aur tops stable ya thora sa upar ki taraf badhte hain. Candlesticks ke bottoms rounded bottom pattern ki curvature tashkeel karte hain.3. Volume: Rounded bottom pattern ki tashkeel ko identify karte waqt volume analysis ahem hai. Shuru mein trading volume downtrend ke dauran high hota hai jab sellers market mein hukoomat kar rahe hote hain. Lekin jab pattern ban raha hota hai aur rounded bottom shakal tashkeel leta hai, volume kam hone lagti hai. Kam hone wala volume bechnay ki dabao mein kami aur market sentiment mein badalao ki alamat hai.4. Tasdeeq: Rounded bottom pattern ki tasdeeq ke liye traders kuch alamat dekhte hain: a. Breakout: Traders resistance level se upar breakout ka intezar karte hain jo rounded bottom pattern ke upper portion dwara banaya gaya hota hai. Ye breakout confirm karta hai ke downtrend khatam ho raha hai aur naya uptrend shuru ho sakta hai. Ideally, breakout ke sath trading volume mein izafa hona chahiye jo renewed buying interest ko darshaata hai. b. Retest: Breakout ke baad, price kabhi kabhi resistance-turned-support level ko retest kar sakta hai, jis se traders ko long positions mein dakhil hone ka mouqa milta hai. Retest bullish reversal ki additional tasdeeq faraham karta hai.5. Price Target: Rounded bottom pattern ka price target saucer ki lowest point se resistance level tak ki distance ko measure kar ke tay kiya jata hai. Ye distance breakout point se uparwarts project kiya jata hai. Traders apne munafa targets ko aksar is projected level par set karte hain.candlestick pattern aik collection se banta hai jahan lows mein sluggish tarz par izafa hota hai aur tops stable ya thora sa upar ki taraf badhte hain. Candlesticks ke bottoms rounded backside pattern ki curvature tashkeel karte hain.Three. Volume: Rounded backside pattern ki tashkeel ko come to be privy to karte waqt quantity evaluation ahem hai. Shuru mein buying and promoting quantity downtrend ke dauran excessive hota hai jab sellers market mein hukoomat kar rahe hote hain. Lekin jab sample ban raha hota hai aur rounded backside shakal tashkeel leta hai, amount kam hone lagti hai. Kam hone wala amount bechnay ki dabao mein kami aur marketplace sentiment mein badalao ki alamat hai.Four. Tasdeeq: Rounded backside pattern ki tasdeeq ke liye clients kuch alamat dekhte hain.
ROUNDED BOTTOM CANDLESTICK PATTERN KA DESIGN aik gole neechay cupp aur deal with ke patteren se milta jalta hai, lekin" address" hissay ke earzi neechay ki taraf rujhan ka tajurbah nahi karta hai. Gole neechay ki ibtidayi girty hui dhalwan supply ki zayad-ti ki nishandahi karti hai, jo inventory ki qeemat ko neechay laane favored majboor karti hai. Oopar ke rujhan mein muntaqili is waqt hoti hai punch khredar kam qeemat fashionable marketplace mein daakhil hotay hain, jis se inventory ki maang barh jati hai. Adjusted base mukammal honay ke baad, inventory honk jata hai aur - apne naye oopar ki janib rujhan mein jari rahay ga. Adjusted base diagram patteren market mein misbet tabdeeli ka ishara hai, yani sarmaya vehicle ki tawaquaat aur raftaar, basorat deegar jazbaat ke naam se jana jata hai, aahista mandi se taizi ki taraf muntaqil ho rahay hain .Market essential Adjusting Base Candle Example make hota hea to yea is sports sports ki apparent signal hoti hea kay Next Development number one market apna pattern alternate karay gi companions Adjusting base ki starting decay slop market guy promote ki electricity ko zayada show kerti hai aur market prices guy downtrend hota ha companions Market man upturn us waqt start hota ha punch customers market ko manage man leta han Dear companions Adjusting Base Example in line with form U tarha kee hoti hea. -
chandiasahabSenior Member
- Feb 2022
- 218
- 167
- 117
- 178 USD
InstaSpot: کسی بھی EPS اور بینک سے منافع واپس لیں، اور EPS اور cryptocurrencies کے تبادلے پر 7% تک کمائیں۔
Working of rounded bottom candlestick patternki shanakht qeemat ki naqal o harkat ki aik series se hoti hai jo grafk tor par" u" ki shakal ikhtiyar karti hai. Rounded bottom tosee shuda neechay ki taraf rujhanaat ke ekhtataam par paye jatay hain aur taweel mudti qeemat ki naqal o harkat mein ulat jane ki nishandahi karte hain. is patteren ka time frame kayi hafton se le kar kayi mahino tak mukhtalif ho sakta hai aur bohat se tajir usay aik ghair mamooli waqea samajte hain. misali tor par, hajam aur qeemat mil kar harkat karen ge, jahan hajam qeemat ki karwai ki tasdeeq karta hai .hai. rounding error neechay chart patteren aik misbet market ke ulat jane ki alamat hai, jis ka matlab hai sarmaya daarana tawaquaat aur raftaar, basorat deegar jazbaat ke naam se mashhoor, murabba pemaiesh qadam bah qadam mayoosi se umeed parasti ki taraf muntaqil hoti hai .chart patteren ko izafi tor par tashtari neechay kaha jata hai. baazyabi ki raqam, bilkul neechay ki terhan, yakja honay mein mahino ya saal lag satke hain. lehaza, sarmaya karon ko bulaa shuba sabr o tahammul ko zehen mein rakhna chahiye jo mukammal vasuli dastyab qeemat ki tareef karne ke liye zaroori hai . -
sub125Member
- Jun 2023
- 75
- 17
- 17
Rounded bottom pattern aam taur par aik lamba downtrend ke baad paida hota hai. Is daur mein price continuously ghat rahi hoti hai, jis se market mein bechnay ki dabao aur bearish sentiment zahir hoti hai.2. Rounded Bottom Formation: Jab downtrend apnay anjaam ki taraf aata hai, bechne ki dabao kam hone lagti hai aur kharidar dheere dheere qabu hasil karne lagte hain. Is tabdeeli ka asar chart pattern mein nazar ata hai, jo rounded bottom shakal mein banta hai. Rounded bottom candlestick pattern aik series se banta hai jahan lows mein gradual tarz par izafa hota hai aur tops stable ya thora sa upar ki taraf badhte hain. Candlesticks ke bottoms rounded bottom pattern ki curvature tashkeel karte hain.3. Volume: Rounded bottom pattern ki tashkeel ko identify karte waqt volume analysis ahem hai. Shuru mein trading volume downtrend ke dauran high hota hai jab sellers market mein hukoomat kar rahe hote hain. Lekin jab pattern ban raha hota hai aur rounded bottom shakal tashkeel leta hai, volume kam hone lagti hai. Kam hone wala volume bechnay ki dabao mein kami aur market sentiment mein badalao ki alamat hai.4. Tasdeeq: Rounded bottom pattern ki tasdeeq ke liye traders kuch alamat dekhte hain: a. Breakout: Traders resistance level se upar breakout ka intezar karte hain jo rounded bottom pattern ke upper portion dwara banaya gaya hota hai. Ye breakout confirm karta hai ke downtrend khatam ho raha hai aur naya uptrend shuru ho sakta hai. Ideally, breakout ke sath trading volume mein izafa hona chahiye jo renewed buying interest ko darshaata hai. Working of rounded bottom candlestick pattern: ​ki shanakht qeemat ki naqal o harkat ki aik series se hoti hai jo grafk tor par" u" ki shakal ikhtiyar karti hai. Rounded bottom tosee shuda neechay ki taraf rujhanaat ke ekhtataam par paye jatay hain aur taweel mudti qeemat ki naqal o harkat mein ulat jane ki nishandahi karte hain. is patteren ka time frame kayi hafton se le kar kayi mahino tak mukhtalif ho sakta hai aur bohat se tajir usay aik ghair mamooli waqea samajte hain. misali tor par, hajam aur qeemat mil kar harkat karen ge, jahan hajam qeemat ki karwai ki tasdeeq karta hai .hai. rounding error neechay chart patteren aik misbet market ke ulat jane ki alamat hai, jis ka matlab hai sarmaya daarana tawaquaat aur raftaar, basorat deegar jazbaat ke naam se mashhoor, murabba pemaiesh qadam bah qadam mayoosi se umeed parasti ki taraf muntaqil hoti hai .chart patteren ko izafi tor par tashtari neechay kaha jata hai. baazyabi ki raqam, bilkul neechay ki terhan, yakja honay mein mahino ya saal lag satke hain. lehaza, sarmaya karon ko bulaa shuba sabr o tahammul ko zehen mein rakhna chahiye jo mukammal vasuli dastyab qeemat ki tareef karne ke liye zaroori hai .
-
sultan77Senior Member
- Apr 2023
- 714
- 34
- 3
"Rounded Bottom" pattern, Forex trading mein ek bullish reversal candlestick pattern hai. Is pattern mein price action ke through ek rounded bottom shape form hota hai, jo bearish trend ke baad bullish reversal ki possibility darshata hai. Chaliye, is pattern ko samjhein: 1. Downtrend: Rounded Bottom pattern bearish trend ke baad dikhai deta hai, jahan price pehle se neeche move kar raha hota hai. 2. Rounded Bottom Shape: Is pattern mein price action ek rounded bottom shape form karta hai. Yeh shape round, curve-like hota hai aur price ka gradual recovery aur reversal darshata hai. 3. Timeframe: Rounded Bottom pattern ka formation ek extended timeframe mein dekha ja sakta hai, jaise hafte, maheene, ya saal. Isme price mein gradual recovery hone ke liye samay lagta hai. 4. Confirmation: Rounded Bottom pattern ko confirm karne ke liye traders dusre technical indicators aur price action analysis ka istemal karte hain. Volumes, trend lines, aur support levels ki tasdeeq is pattern ki authenticity ko validate karne mein madadgar hoti hai. Rounded Bottom pattern ka interpretation: 1. Bullish Reversal Signal: Rounded Bottom pattern bullish trend reversal ka potential signal hai. Price ka gradual recovery aur rounded bottom shape indicate karte hain ki selling pressure kam ho rahi hai aur buyers ka dominance badh raha hai. 2. Trend Reversal Confirmation: Is pattern ke saath aur technical indicators ka istemal karke trend reversal ko confirm karna zaroori hai. Support levels ya resistance levels ka break, volume ki increase, aur dusre bullish reversal patterns ki presence is pattern ki validity ko validate karte hain. Conclusion: Rounded Bottom pattern Forex trading mein bearish trend ke reversal ka important signal hai. Yeh pattern gradual recovery aur bullish reversal ki possibility darshata hai. Traders ko is pattern ko samajhna aur sahi tareeke se interpret karna zaroori hai, takay woh market trends aur reversals ko samajh sake aur trading decisions ko sahi tareeke se le sake. Iske saath hi, dusre technical indicators aur price action analysis ki tasdeeq pattern ki authenticity ko confirm karne mein madadgar hoti hai. -
<a href="https://www.instaforex.org/ru/?x=ruforum">InstaForex</a> -
subhi126Member
- Jul 2023
- 34
- 27
- 11
InstaSpot: کسی بھی EPS اور بینک سے منافع واپس لیں، اور EPS اور cryptocurrencies کے تبادلے پر 7% تک کمائیں۔
Working of rounded bottom candlestick pattern aik gole neechay cupp aur handle ke patteren se milta jalta hai, lekin" handle" hissay ke earzi neechay ki taraf rujhan ka tajurbah nahi karta hai. gole neechay ki ibtidayi girty hui dhalwan supply ki zayad-ti ki nishandahi karti hai, jo stock ki qeemat ko neechay laane par majboor karti hai. oopar ke rujhan mein muntaqili is waqt hoti hai jab khredar kam qeemat par market mein daakhil hotay hain, jis se stock ki maang barh jati hai. Rounded bottom mukammal honay ke baad, stock toot jata hai aur –apne naye oopar ki janib rujhan mein jari rahay ga. Rounded bottom chart patteren market mein misbet tabdeeli ka ishara hai, yani sarmaya car ki tawaquaat aur raftaar, basorat deegar jazbaat ke naam se jana jata hai, aahista aahista mandi se taizi ki taraf muntaqil ho rahay hain .market main Rounding Bottom Candlestick Pattern create hota hea to yea is situations ki clear indication hoti hea kay Next Movement main market apna trend change karay gi friends Rounding bottom ki initial decline slop market man sell ki power ko zayada show kerti hai aur market prices man downtrend hota ha friends Market man uptrend us waqt start hota ha jab buyers market ko control man leta han Dear friends Rounding Bottom Pattern per shape U tarha kee hoti hea.ation prior market central dekhin to application logon ko pata chlay ga, The market in Matlab says that it will recover eventually. Iss liye application logon nay powerful rehna hai and iss per nazer rakhnii hai, stomach muscle bhi market USS level per aa chuki hai. Right when the Contrary light plan appears, the market will presumably be in the sell position. Apnay account size ko dekhty hoi application logon nay trade lagani hai, Hameshaa ye batt yaad rakhin You have an examination. Accepting your assessment crashes and burns, that will be what is going on. as a matter of course, Dunya essential koi cheez is hotii. Say janty hongay, Ye batt application log bhi bohat achii tarah, Everything looks perfect with the adversary side of the assessment's remuneration trade, according to Ager, who ensures that examination failed. Maybe the contrary side of the level will burst through, Breakout per good tidings purchase ni kerna for the application. Ek fake Breakout bhi ho sakta hai, apko breakout k baad retast ka stand by kerna chahiye. Subsequently, dear dealers, a breakout is a horrible reversal, and a terrible ek Khaas light patter
اب آن لائن
Working...
تبصرہ
Расширенный режим Обычный режим