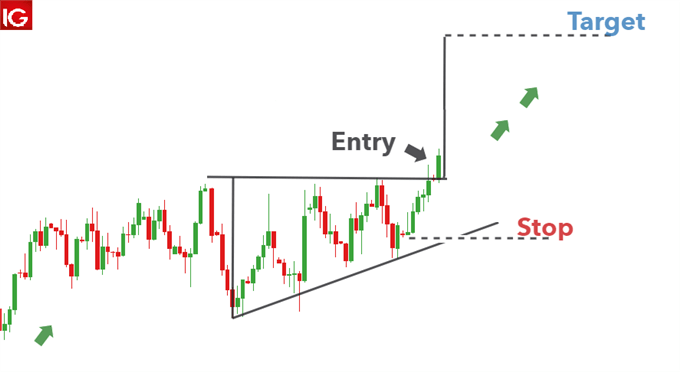
Ascending Triangle Pattern
Ascending Triangle Pattern ek continuation pattern hai jo market mein uptrend ke dauran dikhta hai. Yeh pattern typically ek consolidation phase ke doran banata hai jab price ek upward trend mein already hai. Niche is pattern ki kuch khasiyat di gayi hain:- Upper Trendline (Resistance): Pattern ka ek side horizontal ya nearly horizontal hota hai jo price ko ek ceiling ki tarah rokta hai. Yeh line typically two or more highs ko connect karta hai.
- Lower Trendline (Support): Dusra side upward sloping hota hai aur price ke higher lows ko connect karta hai. Yeh line upward trend ki strength ko dikhata hai.
- Consolidation Phase: Ascending triangle pattern mein price higher lows banata hai, lekin resistance level par ek consistent level par rukawat hoti hai.

Trading Strategy:
- Entry Point: Jab price trend ke upar se breakout karta hai aur upper trendline ko breach karta hai, tab traders long positions enter karte hain. Breakout volume ke saath ho toh pattern ki reliability badh jaati hai.
- Stop-loss: Stop-loss order typically lower trendline ke neeche lagaya jaata hai, jisse ki minor fluctuations ke against protection mil sake.
- Target: Price breakout ke equal to ya usse zyada distance tak move kar sakta hai, isliye traders target ko breakout ke distance se measure karte hain.
- Confirmation: Breakout ke baad agar price upward direction mein sustain karta hai toh, pattern ka confirmation hota hai.

Conclusion
Ascending triangle pattern bullish continuation pattern hai, isliye yeh uptrend ke mazboot hone ka indication deta hai. Lekin, ek mazboot entry aur exit strategy ke saath sahi tareeke se trade kiya jana chahiye.

تبصرہ
Расширенный режим Обычный режим