Bearish Thrusting Line Candlestick Pattern
-
Realone98Senior Member
- Nov 2022
- 3124
- 34
- 247
- 1 607 USD
-
<a href="https://www.instaforex.org/ru/?x=ruforum">InstaForex</a> -
Realone98Senior Member
- Nov 2022
- 3124
- 34
- 247
- 1 607 USD
Assalamu Alaikum Dosto!Bearish Thrusting Line PatternBearish thrusting line pattern main aik bullish candle bearish trend ki akhari candle par lower side se attack karke market main bearish trend ka khatma karne ki koshash karti hai, lekin kamyab nahi ho pati hai. Ye pattern two days candles par mushtamil hota hai, jiss main pehli candle aik long real body wali bearish candle hoti hai, jo k qeematon ko downward push karti hai. Pattern ki dosri candle aik bullish candle hoti hai, jo k open pehli candle se below gap main hoti hai, lekin close pehli candle k midpoint ya darmeyan se nechay ho jate hai. Ye position taqreeban ka 50% se below banta hai. Bearish thrusting line pattern ka opposite side ya top price par Incomplete dark cloud cover / bullish thrusting line pattern banta hai, jo k bullish trend continuation pattern hai.Candles FormationBearish thrusting line pattern main prices bearish trend k khatme karne k leye aik strong bullish attack hoti hai, jo nakam ho kar bearish trend continuation ka sabab banta hai. Ye pattern bullish aur bearish candles par mushtamil hota hai, jiss ki formation darjazel tarah se hoti hai; 1. First Candle: Bearish thrusting line pattern main pehli candle aik bearish candle hoti hai, ye candle price k downtrend ko show kar rahi hoti hai, jo k black ya red color ki candle hoti hai. Ye candle aik strong real body main banti hai, yanni candle ki real body shadow se ziada hoti hai. 2. Second Candle: Bearish thrusting line pattern ki dosri candle aik bullish candle hoti hai, jo k open to pehli candle k bottom par gap main hoti hai lekin close pehli candle k real body main hoti hai. Ye candle color main white ya green hoti hai, jo k bearish trend ka khatam karne ki nakami ki sorat me bearish trend continuation ka sabab banti hai.Explanation Bearish thrusting line pattern two days candles ka aik bearish trend continuation pattern hai, jo k "Belt-Hold Line Pattern" se mushabehat rakhta hai. Lekin Belt-Hold Line Pattern k bar akas ye pattern trend continuation ka kaam karta hai. Pattern ki pehli candle aik strong bearish candle hoti hai, jiss ko aik bullish candle follow karti hai. Bullish candle bearish candle k bottom par gap main open ho kar ussi k real body k darmeyan se below close hoti hai. Second candle ki closing point pehli candle k midpoint point se above nahi hona chaheye. Ye candle bullish meet line pattern ka bhi hum shakal hai. TradingBearish thrusting line pattern sellers ki market main pressure ki waja se banti hai, jiss main market main buyers ki aarzi dabao ka khatma karke prices k bottom ko bearish trend main continuation karwa deti hai. Bearish thrusting line pattern par trading se pehle aik confirmation black candle ka hona zarori hai, jo k dosri candle k baad real body main honi chaheye, jiss par sellers market main sell ki entry kar sakte hen. Aggar pattern k baad black candle banti hai to pattern ki reliability khatam ho jati hai. Stop Loss k leye pattern ka sab se above position muntakhib karen, jo k pehli candle ka top banega, se two pips above select karen. -
adnanheavyMember

- May 2023
- 85
- 3
- 5
InstaSpot: کسی بھی EPS اور بینک سے منافع واپس لیں، اور EPS اور cryptocurrencies کے تبادلے پر 7% تک کمائیں۔
Bearish Thrusting Line Trade Entry
sub sy pahle aapko pahle pattern ki tasdeek karne ki zarurat hai aisa hota hai Jab Teesri mombatti Banai jaati hai aur dusri mombatti ke Jism Ke Niche Band Ho Jaati Hai uska matlab yah hai ki Teesri mombatti ko bardasht karna chahie Jab yah mombatti dusri mombatti ke Jism Ke Niche Band Ho Jaati Hai To Hamen chart per Reet ke sansanikhed andaaz ki taddeek mil Jaati Hai is Mukam per aapko Mukhtar position kholne ke liye Azad aur vazay hai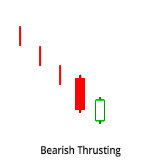
best thursing line stop loss
aapke testing line tasalsal ke pattern ke liye Munnasb Makam dusri mombatti ke upri mombatti se upar Hai Main Jaanta hun ke mazmoon ka staff nuksan ka hissa bahut kam hai lekin Buray Karm use Sanjeedgi se lain bagair Kisi top ke Tijarat Jaruri dard ka tajiya karne ka ek hi Tarika hai
profit target
Gundagardi ki Tej Raftar line hikmat Amali ke liye munafe ke hadaf ke kavad Vahi Hain Jo release ki sansanikhej line ke liye hain aapki Gundagardi se mutale Tijarat ka Sahi Rasta Talash karne ke liye tasvir karta hun ki aap kimat ke Amal ke kavad aur Waqt aur firok istemal Karen
conclusion
first time line Ek double shmadan namuna hai jo reach ki kimat ke rojanat se waqif hai ek durust pattern ko jawab dena chahie Pahli mombatti reach hai dusri mombatti khali hai aur vah Gundagardi hai dusri mombatti Pahli mombatti ke Jism ke vastunukta Ke Niche Se Band Ho Jaati Hai teen kism ke thursting line mombatti Ke namune Hain majbut tasal sul line Darmiyanni tasal sul line ulat tasasl sul line -
RashidshahzadaSenior Member
- Jul 2020
- 5693
- 218
- 4456
- 745 USD
BEARISH THRUSTING LINE CANDLESTICK PATTERN DEFINITION stock trader constantly in pattern ke Talash Mein Rahte Hain Jinke interpreted is direction ke Ishare ke Taur per ki Ja sakti hai Jo vah stock Dekh Rahe Hain Jo Aage Le Jaega thrusting line Ek aisa hi pattern hai Jahan second candles opens aur closes hoti hai vah pressure kharidne ki strength ke maloomat karti hai aur Aaya yah pressure continue Rahane ka imkan hai second candles previous candles per hone wale selling pattern mein Upar ki taraf Jaane Ki attempting kar rahi hai thrusting line actually two candlestick pattern ka ek pahlu hai candlestick pattern Ek rectangle Jiske donon Sheron per wick Ki Tarah phaili Hui Hai ek hi session Mein stock ki movement ko uski lowest price se uski highest price Tak dikhata hai two candle Stick ka pattern to cycles dikhata hai thrusting line Ek Two candle ka pattern hai LIMITATION OF THE THRUSTING LINE Kisi bhi case Mein thrusting Line ki price ki direction ke liye sirf short term out look frahim kar sakti hai pattern profit ka target provide nahi karta ke price kahan Tak Chal sakti hai trader ko un patterns ki buniyad per ki jaane wali Kisi bhi trade se nikalne ke liye right time ka signal dene ke liye Kisi Aur method per inHisar karna chahie Tamam thrusting line Is Tarah taiyar Nahin Hoti Jaise unke dekhne wale hope Karte Hain aur expect Karte Hain Ki vah Karenge
 TYPE OF THRUSTING LINE thrusting line analysis ki other form ke alava best tarike se use kiye Jaate Hain Jaise ke trend ka analysis digar price action signal are technical indicator thrusting line ke teen ways Hain continuation neutral and reversal Agar pahle candle first ke close se open hoti hai lekin second ke Kareeb ya usse thora Upar close hoti hai to pattern neutral hai agale session mein price zyada ya com ho sakti hai message ye hai ke bull Kuchh ground hasil kerne mein kamyab hogai lekin buyers wale zyada stroNg the ager second candle ki price first candle ke kareeb open hote hai
-
UpdatedSenior Member
- Apr 2023
- 933
- 4
BEARISH THRUSTING LINE CANDLESTICK PATTERNINTRODUCTION Bearish Thrusting Line, yaani "Udasi Bharnay Wali Line," ek candlestick pattern hai jo downtrend (behrangi) market mein bearish trend ki continuation ko indicate karta hai. Ye pattern, traders ko market ki direction ka pata lagane aur trading strategies banane mein madad karta hai. IDENTIFICATION Bearish Thrusting Line pattern ko identify karne ke liye, hume kuch important factors ko dekhna hota hai. Ye factors hain: Pehle wali candlestick: Thrusting Line pattern ki pehli candlestick bullish (upward) trend mein hoti hai. Ye candlestick generally strong bullish trend ki wajah se form hoti hai. Dusre wali candlestick: Thrusting Line pattern ki dusri candlestick, pehli candlestick ki taraf thrust (jabardasti) karte hue downward direction mein move karti hai. Ye candlestick pehli candlestick ki body mein enter karte hue close hoti hai. Price confirmation: Thrusting Line pattern mein dusri candlestick ki closing price, pehli candlestick ki body mein close hoti hai. Yani ki ye candlestick pehli candlestick ki bullish move ko confirm karti hai. TIPS FOR TRADERS Bearish Thrusting Line Candlestick Pattern ka istemal karte hue, traders bearish trend reversal ki possibility par focus karte hain. Yeh pattern bullish trend mein dikhta hai, isliye traders ko bearish trend ka expectation rakhna chahiye. Agar bearish thrusting line pattern sahi tareeke se pehchana jaye, toh iska istemal kiya ja sakta hai trading decisions ke liye. TRADING STRATEGY Jab hum Bearish Thrusting Line pattern ko identify kar lete hain, hum isko use karke trading strategy banate hain. Yahaan kuch steps hain jo aapko trading strategy banane mein madad karenge: Step 1: Pattern identification: Sabse pehle, aapko market charts par Bearish Thrusting Line pattern ko dhundhna hai. Ye pattern generally downtrend ya bearish market mein dikhai deta hai. Isko identify karne ke liye, pehli candlestick ki body ko upward move karte hue aur dusri candlestick ki body ko downward move karte hue dekhein. Step 2: Confirming the pattern: Pattern identification ke baad, aapko pattern ki confirmation ke liye dusri candlestick ki closing price ko check karna hai. Agar dusri candlestick ki closing price pehli candlestick ki body mein close hoti hai, toh pattern confirm hota hai. Step 3: Entry point: Pattern confirm hone ke baad, aapko entry point decide karna hai. Aap sell order place karenge jab market price pattern ki low se neeche jaaye. Isse aap market ke downward move mein entry kar sakte hain. Step 4: Stop loss: Stop loss ek important risk management tool hai. Jab aap entry point decide karte hain, toh aapko bhi stop loss level set karna chahiye. Stop loss, aapki trade ko protect karta hai agar market price aapki expectation ke against move kare. Aap stop loss level ko pattern ki high se thoda above set kar sakte hain. Step 5: Target point: Target point ka decide karna bhi important hai. Aap apni trade ko close karenge jab market price aapke favor mein move kare aur aapka target level achieve ho jaaye. Aap target point ko previous support level, Fibonacci retracement ya technical analysis ke tools se decide kar sakte hain. Step 6: Risk management: Apni trade mein risk management ko prioritize karna bahut zaroori hai. Aap apne trading capital ke ek fixed percentage ko risk karne ke liye decide kar sakte hain. Isse aap apne overall trading portfolio ko protect kar sakte hain. SUMMARY Bearish Thrusting Line Candlestick Pattern, ek mumkin bearish trend reversal signal hai jo candlestick charts mein dekha jata hai. Is pattern ko samajhna aur istemal karna traders ke liye zaroori hai taaki woh trading decisions mein iska sahi tajurba kar sakein. -
<a href="https://www.instaforex.org/ru/?x=ruforum">InstaForex</a> -
Aisha12Member
- Apr 2023
- 94
- 16
- 95
InstaSpot: کسی بھی EPS اور بینک سے منافع واپس لیں، اور EPS اور cryptocurrencies کے تبادلے پر 7% تک کمائیں۔
Bearish thrusting trend line: Bearish thrusting trendline forex market mein ek bearish pattern hai. Is pattern mein price initially down ki taraf move karti hai aur phir ek bullish candlestick banati hai. Lekin agle candlestick mein price phir se down move karti hai aur pehle ki candlestick ko penetrate kar ke neeche jaati hai.Ye pattern isliye "thrusting" kaha jata hai kyunki ye do candlesticks ke beech mein ek "thrust" ya push create karta hai. Bearish thrusting trendline mein second candlestick, pehle wale candlestick ko partially cover karta hai ya usko penetrate karta hai, jisse bearish momentum jari rehta hai. Details; Ye pattern bearish trend ko indicate karta hai aur traders ko ye suggestion deta hai ke price mein further downside movement possible hai. Traders is pattern ko dekh kar sell positions le sakte hain ya existing short positions ko hold kar sakte hain.Bearish Thrusting trendline forex mein ek technical analysis pattern hai. Is pattern mein price action ki downward trendline hoti hai, jo price ko neeche daba deti hai. Ye pattern normally downtrend ke beech mein develop hota hai aur bearish trend ko confirm karta hai. Bearish Thrusting pattern mein do consecutive candlesticks hote hain. Pehla candlestick bearish (girawat wala) hota hai, jo downward move karta hai. Dusra candlestick bhi bearish hota hai, lekin iski body pehle candlestick ki body mein andar tak jaati hai. Yani, ye candlestick pehle bearish candlestick ki range ko penetrate karke neeche chali jaati hai. Is pattern ko bearish thrusting kaha jata hai, kyun ki ismein bearish candlestick thrust (dhakka) deti hai aur price ko neeche push karti hai. Ye pattern selling pressure ko darshata hai aur bearish continuation ko suggest karta hai. Ye pattern dekhne ke liye, price chart aur candlestick analysis ka use kiya jata hai. Technical analysts is pattern ki madad se future price movement ko predict kar sakte hain aur trading decisions le sakte hain."Bearish thrusting trendline" forex mein ek technical analysis pattern hai jo bearish (downward) trend ko darshaata hai. Ye pattern do candlesticks se banta hai. Bearish thrusting trendline mein, pehla candlestick ek bearish candle hota hai jo neeche ki taraf jaata hai. Doosra candlestick bhi bearish hota hai, lekin iski body pehle candlestick ki body ke andar rehti hai. Iska matlab hai ki doosri candlestick mein selling pressure hai, lekin pehli candlestick ke low level se niche nahin jaati hai.Ye pattern bearish continuation pattern hai, jo indicate karta hai ki market mein downward trend continue ho raha hai. Is trendline ko dekh kar traders selling opportunities dhundte hain aur market ke further downward movement par trade karte hain. Bearish thrusting trendline ko identify karne ke liye, candlestick charts par dhyaan diya jaata hai. Traders ko is pattern ki confirmation ke liye dusre technical indicators aur price action analysis ka bhi sahara lena chahiye.

اب آن لائن
Working...
تبصرہ
Расширенный режим Обычный режим