Bullish Harami Candlestick Pattern
-
AynSenior Member

- Aug 2020
- 3050
- 1513
- 623
- 2 248 USD
-
<a href="https://www.instaforex.org/ru/?x=ruforum">InstaForex</a> -
AynSenior Member
- Aug 2020
- 3050
- 1513
- 623
- 2 248 USD
Dear traders mumkin hai ke aapne candlestick patterns ke baare mein suna ho, jo technical analysis mein istemaal hota hai share market ya anya financial market ke movement ko samajhne ke liye. Ek aham candlestick pattern hai "Bullish Harami." Yeh pattern market ke uptrend ke samay dikhta hai aur traders ko bullish reversal ki sambhavna dikhata hai. Is article mein hum "Bullish Harami" candlestick pattern ke baare mein samjhenge. Introduction of Bullish Harami candlestick pattern. Bullish Harami candlestick pattern ek do-candle pattern hai, jisme ek chhota candle large candle ke andar samaveshit hota hai. Is pattern mein pehla candle bearish hota hai, yani ki market down ja rahi hoti hai. Dusra candle, jo pehle candle se chhota hota hai, ise "inside candle" kehte hain. Is inside candle ka range pehle candle ke andar rehta hai. Is pattern ko "Bullish Harami" kaha jata hai kyun ki yahan par bearish movement ke baad ek bullish candle aata hai. Component of Bullish Harami candlestick pattern. Bullish Harami candlestick pattern mein do mukhya components hote hain.- Pehli Candle (Bearish Candle): Pehla candle bearish hota hai aur market mein downward movement ko darshata hai. Is candle ka body lamba hota hai aur upper shadow bhi ho sakta hai. Ye candle pehle trend ka hissa hota hai, jisme sellers dominate karte hain.
- Dusri Candle (Inside Candle): Dusra candle pehle candle se chhota hota hai aur iska range pehle candle ke andar rehta hai. Is candle ka body pehle candle se chhota hota hai. Is candle mein buyers active hote hain aur market mein reversal ki sambhavna dikhti hai.
- Bullish Confirmation: Agar Bullish Harami pattern ek strong support level ke paas ya trendline ke paas dikhe, toh yeh ek bullish reversal ke liye strong confirmation hai. Is situation mein traders ko long position lena chahiye, jiske baad price mein up-move ka expectation hota hai.
- Price Consolidation: Kabhi-kabhi Bullish Harami pattern market mein price consolidation ka indication bhi ho sakta hai. Yeh matlab hota hai ki market ko directionless phase mein hai aur kisi specific trend ki taraf move nahi kar rahi hai. Is situation mein traders ko price movement ka dhyan rakhna chahiye aur market ki agle move ke liye wait karna chahiye.
-
Realone98Senior Member
- Nov 2022
- 3125
- 34
- 244
- 1 607 USD
InstaSpot: کسی بھی EPS اور بینک سے منافع واپس لیں، اور EPS اور cryptocurrencies کے تبادلے پر 7% تک کمائیں۔
Assalamu Alaikum Dosto!Bullish Harami Candlestick PatternBullish harami candlestick pattern aik bullish trend reversal pattern hai, jo k prices k intehaye lower position ya bearish trend k baad banta hai. Ye pattern aik unique qissam ka hai aur bohut kam hi prices main nazzar atta hai. Ye pattern do candles par mushtamil hotta hai. Jiss main pehli candle aik bearish candle hoti hai jo market k current strong bearish trend ki alamat hotti hai, aur ye candle prices ko lower side par push karti hai. Pattern ki dosri candle aik small real body wali bullish candle hotti hai, jo k pehli candle ki real body main banti hai. Ye candle prices k current trend k khateme aur new bullish trend ka aik strong sihnal deti hai, jiss se market main buyers active ho jate hen. Ye pattern market ke trend ko predict karne ke liye istemal hota hai aur traders ko potential buying opportunities dikhane mein madadgar hota hai. Bullish Harami Candlestick Pattern ka matlab hota hai ki market mein uptrend ki possibility hai ya buyers market mein strong position par hain. Jab ye pattern form hota hai, to iska matlab hota hai ke market mei bearish sentiment kam ho rahi hai aur bullish sentiment barh rahi hai. Is pattern ko dekhte hue traders ko lagta hai ke market mei reversal hone ke chances hain, aur wo long positions (kharidari) le sakte hain ya short positions (bepari) cover kar sakte hain.Candles FormationBullish harami candlestick pattern prices k bottom par banne ki waja se aik strong bullish trend ki indication deta hai, jo k do candle ka aik simple sa pattern hai. Pattern ko dekh kar traders ya investors samajhte hain ke market mein bearish sentiment kamzor ho raha hai aur bullish sentiment barh raha hai. Yahan tak ke pattern ko ek trend reversal signal bhi samjha jata hai. Pattern main candles ki formation darjazzel tarah se hoti hai;- First Candle: Bullish harami candlestick pattern ki pehli candle aik strong real body wali bearish candle hoti hai, jiss ka color bhi bearish pattern k mutabiq black ya red hota hai. Ye candle prices k bottom ya low price main bearish trend ka mazeed izzafe ki koshash hoti hai. Pehli candlestick, bearish trend ko represent karti hai. Ismein normaly baraadari ya baraish (sellers) dominant hoti hai, aur iski closing price pehle din ki opening price se kam hoti hai.
- Second Candle: Bullish harami candlestick pattern main shamil dosri candle aik small real body wali hoti hai, jiss ka open aur close same point par nahi hona chaheye. Ye candle aik bullish trend wali banti hai, jiss ka color white ya green hota hai. Ye candle pehli candle k andar banti hai. Dusri candlestick, pehli candlestick ke baad ati hai. Ismein bull (khareedari karne wale) traders dominate karte hain, aur iski closing price pehli candlestick ki opening price ke qareeb hoti hai.
ExplainationBullish Harami pattern, market mein bearish trend (jab prices gir rahi hain) ke baad aik reversal signal provide karta hai. Is pattern ko pehchanne ke liye do candlesticks (mumkin hai ke kuch aur candlesticks bhi hon) ki zarurat hoti hai. Bullish harami candlestick pattern aik strong bullish trend reversal pattern hai, jo k dekhne main ulta bullish engulfing candlestick pattern ki tarah hotta hai, jo same bullish trend reversal k leye istemal hota hai. Ye pattern prices k downtrend ya low price area main bannta hai, jahan se ye trend reversal ka kaam karta hia. Bullish harami candlestick pattern do candles par mushtamil aik trend reversal pattern hai, jiss main pehli candle color main black ya red yanni bearish trend wali candle hoti hai, ye candle long real body main banne ki waja se bearish trend ki mazbotti ki alammat hotti hai. Jo prices ko mazeed downward ki taraf push karti hai. Pattern ki dosri candle aik small bearish candle hotti hai, jo k pehli candle k close price par open hone ki bajaye, ussi k real body main open aur close hoti hai. Ye candle pehli candle se size main lazmi small real body main honi chaheye, jo prices k bullish trend reversal ka sabbab bantte hen.TradingBullish harami candlestick pattern par trading karnne k leye market aap ko buy ki entry karnni paregi, lekin pattern par bagher trend confirmation k trade laggana bohut ziadda riski hai. Ye pattern banta to bearish trend main hai lekin ye zarori nahi k prices lazmi bullish reversal hongi. Pattern par trade se pehle dosre technical indicators se market ki trend confirmation karlen, aggar market ki confirmation price action jaise pattern k baad aggli candle bhi bullish banti hai to ye trend confirmation ho jati hai. Pattern tab samjha jata hai jab ye do candles ke baad aata hai, aur ye suggest karta hai ke bearish trend kamzor ho raha hai aur bullish momentum shuru ho sakta hai. Lekin, yeh pattern 100% confirmatory nahi hota, aur market analysis ke saath aur technical indicators ke saath istemal kiya jata hai trading decisions ke liye. Confirmation candle k baad market main buy ki entry karen aur Stop Loss k leye market ka sab se lower position, jo k umoman pehli candle ka lower position ya close price banega par se two pips below set karen. Yad rahe ke Bullish Harami pattern ek indicator hai, aur isay doosre technical analysis tools aur market information ke saath combine karna behtar hota hai trading decisions ke liye. Market mei risk hota hai, isliye trading karne se pehle achi tarah se research aur risk management ka khayal rakhna zaroori hai. -
Ibad845Junior Member
- Mar 2023
- 5
Bullish Harami Candle Example: Dear dealers mumkin hai ke aapne candle designs ke baare mein suna ho, jo specialized examination mein istemaal hota hai share market ya anya monetary market ke development ko samajhne ke liye. Ek aham candle design hai "Bullish Harami." Yeh design market ke upturn ke samay dikhta hai aur merchants ko bullish inversion ki sambhavna dikhata hai. Is article mein murmur "Bullish Harami" candle design ke baare mein samjhenge. Presentation of Bullish Harami candle design: Bullish Harami candle design ek do-light example hai, jisme ek chhota candle enormous candle ke andar samaveshit hota hai. Is design mein pehla light negative hota hai, yani ki market down ja rahi hoti hai. Dusra light, jo pehle flame se chhota hota hai, ise "inside candle" kehte hain. Is inside light ka range pehle flame ke andar rehta hai. Is design ko "Bullish Harami" kaha jata hai kyun ki yahan standard negative development ke baad ek bullish flame aata hai. Part of Bullish Harami candle design: Bullish Harami candle design mein do mukhya parts hote hain. Pehli Light (Negative Candle): Pehla flame negative hota hai aur market mein descending development ko darshata hai. Is flame ka body lamba hota hai aur upper shadow bhi ho sakta hai. Ye flame pehle pattern ka hissa hota hai, jisme dealers overwhelm karte hain. Dusri Flame (Inside Light): Dusra candle pehle candle se chhota hota hai aur iska range pehle candle ke andar rehta hai. Is candle ka body pehle candle se chhota hota hai. Is candle mein purchasers dynamic hote hain aur market mein inversion ki sambhavna dikhti hai. Understanding of Bullish Harami candle design: Poke Bullish Harami design dikhe, toh iska matlab hai ki negative pattern ke baad ek bullish inversion ho sakta hai. Yeh design brokers ko ye batata hai ki selling pressure kam ho gayi hai aur purchasing pressure badh rahi hai. Bullish Harami design ko affirm karne ke liye merchants ko kuch aur pointers aur devices ka bhi istemaal karna chahiye, jaise ki trendlines, moving midpoints, ya anya specialized markers. Yahan standard kuch potential situations hain punch Bullish Harami design dikhe: Bullish Affirmation: Agar Bullish Harami design areas of strength for ek level ke paas ya trendline ke paas dikhe, toh yeh ek bullish inversion ke liye solid affirmation hai. Is circumstance mein merchants ko long position lena chahiye, jiske baad cost mein up-move ka assumption hota hai. Value Solidification: kabhi Bullish Harami design market mein cost combination ka sign bhi ho sakta hai. Yeh matlab hota hai ki market ko aimless stage mein hai aur kisi explicit pattern ki taraf move nahi kar rahi hai. Is circumstance mein dealers ko cost development ka dhyan rakhna chahiye aur market ki agle move ke liye stand by karna chahiye.... -
<a href="https://www.instaforex.org/ru/?x=ruforum">InstaForex</a> -
Waqas110Senior Member
- Mar 2023
- 396
- 19
- 104
- 255 USD
Bullish Harami Candlestick Pattern ek prakar ka technical analysis pattern hai jo stock market aur financial markets me istemal hota hai. Ye pattern generally trend reversal ko darust karte hain, matlab jab market ki trend bearish (girawat ki or) se bullish (badhawat ki or) mai badal rahi hoti hai. Bullish Harami Candlestick Pattern ek do-stage pattern hota hai, jisme do candlesticks (mombatti ki tarah) shamil hote hain: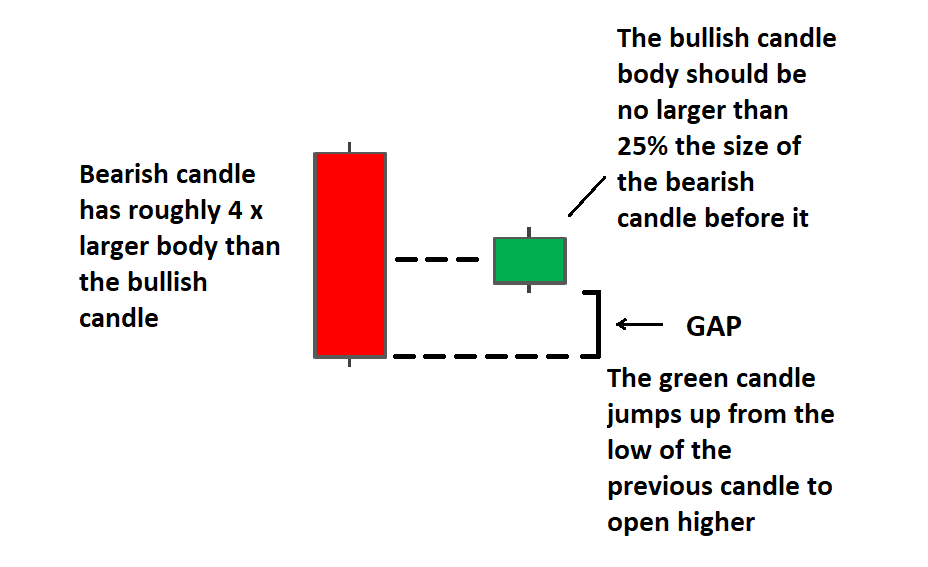 Pehla candlestick: Pehla candlestick bearish (girawat ki or) hota hai, yaani ki usme share ke price ki girawat hoti hai. Is candlestick ko "Mother Candle" kehte hain. Dusra candlestick: Dusra candlestick pehle candlestick ke andar hota hai, aur ye bullish (badhawat ki or) hota hai. Iski body pehle candlestick ki body ke andar hoti hai, jise "Harami" kehte hain. Isme price ki badhawat hoti hai. Bullish Harami Candlestick Pattern ka matlab hota hai ki bearish trend me ek chota sa pause aaya hai aur ab market me bullish sentiment aane ke chances hain. Is pattern ko confirm karne ke liye traders aur investors ko aur technical indicators ka istemal karna hota hai, jaise ki RSI (Relative Strength Index) ya moving averages. Yaad rahe ki candlestick patterns ek tool hain, aur market analysis ke dusre aspects ke saath milakar istemal kiye jaate hain, jaise ki fundamental analysis aur market sentiment. In patterns ko samajhna aur unka istemal karne ke liye market analysis ka accha gyaan aur practice ki aavashyakta hoti hai
اب آن لائن
Working...
تبصرہ
Расширенный режим Обычный режим