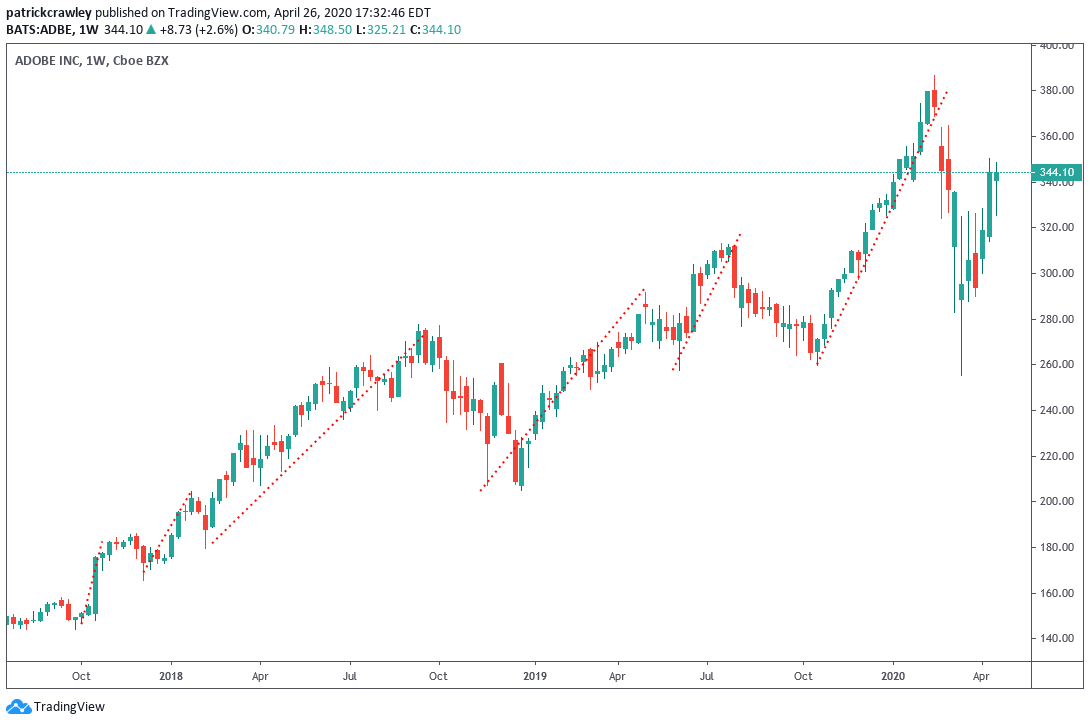
complete detail of trading with straight float pattern
`
X
new posts
-
#1 Collapse
-
<a href="https://www.instaforex.org/ru/?x=ruforum">InstaForex</a> -
#2 Collapse
Straight Float Chart PatternIntroduction Straight Float chart pattern ek technical analysis ka concept hai jo stock market traders aur investors istemaal karte hain. Is pattern ki identification ke liye hum stock ka price action dekhte hain, specifically yeh dekha jata hai ke stock ka price kis tarah se move kar raha hai. Agar stock ka price trend horizontally move kar raha hai, matlab keh price mein koi significant up ya down movement nahi ho raha hai, aur yeh trend kuch time se continue kar raha hai, to yeh straight float chart pattern kehlata hai. Use of Straight Float Chart Pattern Is pattern ka use traders aur investors is tarah se karte hain ke jab yeh pattern identify ho jata hai, to iska matlab hota hai ke market mein currently koi bhi major trend nahi hai, aur price ke direction mein koi clear signal nahi hai. Is situation mein traders usually wait karte hain ke market mein koi major news ya event aaye jis se market ka direction clear ho jaye. Straight Float Chart Pattern ki pehchaan Is pattern ko identify karne ke liye traders aur investors technical analysis tools jaise ke price charts aur indicators ka istemaal karte hain. Yeh pattern ki identification market mein successful trading aur investment ke liye important hai
  Trading Strategy Straight Float Chart Pattern ek technical analysis tool hai jo kay stock market mein istemaal kia jata hai. Is pattern ki madad se traders market ke trend ke baray mein maloomat hasil karte hain aur is ke hisaab se apni trading strategies banate hain. Is pattern mein, stock ki price ki ek straight line hoti hai, jo kay aam tor par kuch waqt kay liye stable rehti hai. Is waqt mein, trading volume kam hota hai aur market ki movement kam hoti hai. Lekin phir kuch waqt kay baad, price mein sudden increase ya decrease hota hai, jis se traders ko is ke baray mein khabar hojati hai.
  Agar aapko Straight Float Chart Pattern ka istemaal karna hai, to aapko kuch baaton ka khayal rakhna hoga. Pehle to aapko is pattern ko sahi tareeqay se identify karna hoga. Is ke liye aap ko technical analysis ke tools ka istemaal karna hoga. Aap ko market ke trends aur price movements ke baray mein maloomat honi chahiye aur sahi waqt pe trade karna chahiye.
  Ek acha trading strategy Straight Float Chart Pattern ke liye ye hai keh aap is pattern ke hisaab se stop-loss aur take-profit levels set karein. Is ke ilawa, aap ko market ke volatility aur risk management ke baray mein bhi maloomat honi chahiye. Is tarah aap apni trading decisions ko improve kar sakte hain aur market mein kam risk ke saath earn kar sakte hain. Summary In summary, Straight Float Chart Pattern ek powerful technical analysis tool hai jo traders ko market trends ke baray mein maloomat deta hai. Aap ko is pattern ko sahi tareeqay se identify karna hoga aur apni trading strategies ko is ke hisaab se set karna hoga. Saath hi, aap ko market ke risk aur volatility ke baray mein bhi maloomat honi chahiye
اب آن لائن
ہم مواصلات کے پلیٹ فارم کے طور پر فاریکس فورم فاریکس پاکستان کے آپ کے انتخاب کی تعریف کرتے ہیں۔
موجودہ وقت 03:22 PM (GMT+5)۔
Working...
X

تبصرہ
Расширенный режим Обычный режим