Mass Index Indicator kia hota hy Mass Index Indicat
-
malikfaisi811Junior Member

- Apr 2023
- 8
- 1
-
<a href="https://www.instaforex.org/ru/?x=ruforum">InstaForex</a> -
malikfaisi811Junior Member
- Apr 2023
- 8
- 1
Mass index indicator ko early 1990s ma develop kiya giya or trader esko trend reversal ko find karny kay laye use karty hain. Jb price range widen hoti hai to ye market kay reversal ki prediction karty hain. Ye indicator previous price range ko bi compare karta hai. Trader jb price ki widening or narrowing ko oberve karty hain to ye indicator es time par market reversal ka signal generate karta hai. Ye indicator mainly singular price par focus karta hai or volume movement par ye indicator categorize karta hai. Trader ko best result kay laye es indicator ko other direcrional indicators kay sath combine karna chahe.Mass Index Indicator text statistical tool hai jo train reversal ki accurate identification provide Karta Hai he told technical analysis Hota Hai.The indicator was developed by Donald Dorsey and it is based on the relationship between the high-low range and the volume of trading. Mass index donald dosi ne tayyar kya tha, w each o ne Anees isi ki dahai mein is ke hawalay se chhapa. index ka maqsad market ke duhraey jane walay namonon ko dekhna hai. is ka maqsad aik baar spot karna hai ke aik baar associ at un nrsng ke ilawa tang ya chaura ho ja toye .Companions kya haal hai aapki ummid karta hun aap sab khairiyat se honge Jahan rahen khush rahe aur mahfuj Rahe aaj jis point ko Ham talk about karenge vah Hai monitors marker mausam pointer kya hai kaise kam karte hain aur ham apni diagram no exchange haain sa benefit is marker ke assist se With hamming isko aaj read karenge aur comprehend karenge agar Ham isko comprehend karne mein kamyab ho Gaye To Ham Apne benefit reshiyo ko increment kar sakte hain -
Realone98Senior Member
- Nov 2022
- 3124
- 34
- 247
- 1 607 USD
Assalamu Alaikum Dosto!
Mass Index (Mass Indicator)
Maas Indicator, jis ko "Mass Index" bhi kaha jata hai, ek popular volatility indicator hai jo trading mein kisi bhi assets ki volitilety ko maloom karne k leye istemal hota hai. Yeh indicator zyadatar price reversals aur trend changes ko identify karne mein madad karta hai. Maas Indicator, Donald Dorsey ne develop kiya tha aur 1992 mein published kiya gaya tha. Yeh indicator volatility ko measure karta hai aur price movements ko analyze karke trading signals provide karta hai.
Calculation:
Maas Indicator ka calculation kuch steps par based hai. Yahan iska calculation method diya gaya hai:
- Pehle step mein, 9-day EMA (Exponential Moving Average) calculate kiya jata hai.
- Dusre step mein, 9-day EMA ko dobara 9-day EMA se divide kiya jata hai, jiske baad result ko "single EMA" kaha jata hai.
- Single EMA ko firse 9-day EMA se divide kiya jata hai, jiske baad result ko "double EMA" kaha jata hai.
- Double EMA ko single EMA se divide kiya jata hai, jiske baad result ko "Maas Index" kaha jata hai.
Maas Index ka calculation yeh samjhane ke liye hua hai ki kitna frequently price ranges expand ya contract karte hai. Isse price ki volatility aur potential trend reversals ko samajhne mein madad milti hai.
Interpretation and Use of Maas Indicator
Maas Indicator ke interpretation aur istemal ko samajhna trading mein crucial hai. Yeh indicator primarily price reversals aur trend changes ko identify karne mein istemal hota hai. Niche diye gaye points mein iska istemal aur interpretation di gayi hai:
- Maas Indicator ki value generally 25 se kam hoti hai, lekin ismein koi specific overbought aur oversold levels nahi hote hain.
- Jab Maas Indicator ki value 27 se kam ho jati hai, tab yeh indicate karta hai ki market mein volatility kam ho rahi hai aur price ranges contract ho rahe hain.
- Jab Maas Indicator ki value 29 se zyada ho jati hai, tab yeh indicate karta hai ki market mein volatility badh rahi hai aur price ranges expand ho rahe hain.
- Maas Indicator ki spikes, jo value 27 aur 29 ke beech hoti hain, price reversals aur trend changes ko indicate kar sakti hain.
- Agar Maas Indicator spikes upar ki taraf jati hai aur phir downar ki taraf ghatne lagti hai, tab yeh selling pressure aur possible trend reversal ko suggest karta hai.
- Agar Maas Indicator spikes neeche ki taraf jati hai aur phir upar ki taraf badhne lagti hai, tab yeh buying pressure aur possible trend reversal ko suggest karta hai.
Maas Indicator in Combination with Other Indicators
Maas Indicator ko dusre indicators ke saath combine karke aur confirmatory signals generate karke traders apne trading decisions ko strengthen kar sakte hain. Yahan kuch common indicators hain jo Maas Indicator ke saath istemal kiye ja sakte sakte hain:
- Moving Averages (MA): Moving averages, jaise ki Simple Moving Average (SMA) aur Exponential Moving Average (EMA), Maas Indicator ke saath istemal kiye ja sakte hain. Moving averages trend direction aur momentum ko identify karne mein madad karte hain. Jab Maas Indicator ki spikes aur moving averages ke crossovers combine kiye jate hain, tab yeh strong trading signals generate kar sakte hain.
- Relative Strength Index (RSI): RSI ek momentum oscillator hai jo overbought aur oversold levels ko identify karta hai. Maas Indicator ke saath RSI ka istemal karke, traders trend reversals aur price bounces ko confirm kar sakte hain. Agar Maas Indicator ki spikes RSI ke overbought ya oversold levels ke saath milte hain, tab yeh strong reversal signals provide kar sakte hain.
- Bollinger Bands: Bollinger Bands volatility ko measure karne mein aur price range boundaries ko define karne mein madad karte hain. Maas Indicator ke saath Bollinger Bands ka istemal karke, traders price volatility aur possible trend reversals ko further confirm kar sakte hain. Jab Maas Indicator ki spikes Bollinger Bands ke outer boundaries ke paas aate hain, tab yeh potential reversal points ko highlight kar sakte hain.
- Volume Indicators: Volume indicators, jaise ki Volume Oscillator aur On-Balance Volume (OBV), Maas Indicator ke saath istemal kiye ja sakte hain. Volume indicators trading volume ko analyze karke price movements ke confirmation mein madad karte hain. Jab Maas Indicator ki spikes high trading volume ke saath milte hain, tab yeh strong reversal signals aur trend changes ko validate kar sakte hain.
Mass Indicator Limitations
Maas Indicator ke istemal mein kuch limitations hote hain. Yahan kuch limitations diye gaye hain:
- Maas Indicator lagging nature ka hota hai, jiske karan yeh trend reversals ko pehle se nahi batata hai. Isliye, confirmatory signals aur dusre technical indicators ke saath istemal karna important hai.
- Maas Indicator market conditions aur price movements par depend karta hai, isliye iska istemal ek particular market environment mein hi suitable ho sakta hai. Different market conditions mein yeh less reliable ho sakta hai.
- Maas Indicator ki readings kabhi-kabhi false signals generate kar sakte hain, khas karke choppy aur sideways markets mein. Isliye, is indicator ko standalone use karne se bachna chahiye.
- Maas Indicator ka istemal keval ek tool ki tarah karna chahiye, aur usse dusre indicators aur trading strategies ke saath combine karna chahiye. Ek comprehensive approach aur multiple confirmations se trading decisions ko strengthen karna zaruri hai.
- Maas Indicator ke parameters, jaise ki EMA periods, customization ke liye limited hote hain. Har trader ki specific requirements ke hisab se, iske parameters ko adjust karna mushkil ho sakta hai.
Yeh kuch limitations hain Maas Indicator ke istemal mein. Traders ko in limitations ko samajhna aur sahi risk management ke saath iska istemal karna chahiye. Saath hi, demo trading aur historical data analysis se traders Maas Indicator ki effectiveness aur limitations ko better understand kar sakte hain.
Conclusion
Overall, Maas Indicator ek valuable tool hai volatility analysis aur trend reversals ko identify karne mein. Lekin iska istemal accurate trading decisions lene ke liye dusre indicators aur confirmatory signals ke saath karna zaruri hai. Traders ko Maas Indicator ke limitations ko samajhna aur uski readings ko context mein interpret karna important hai.
Trading mein success achieve karne ke liye, traders ko comprehensive knowledge, market understanding, aur risk management skills develop karna chahiye. Maas Indicator ek part hai trading toolkit ka, jiska sahi istemal karke traders apne trading strategies ko enhance kar sakte hain.
-
Raheela512Senior Member
- Nov 2023
- 536
- 364
- 305
- 351 USD
Mass Index Indicator kia hota hy Mass Index Indicat
Mass Index Indicator ek technical analysis tool hai jo market volatility aur trend reversal ko measure karne mein istemal hota hai. Donald Dorsey ne Mass Index ko develop kiya tha. Yeh indicator primarily market ki volatility ko quantify karta hai.
Mass Index ka calculation Multiple Moving Averages aur Exponential Moving Averages ke zariye hota hai. Iska mukhtasar formula is tarah hai:
Mass Index=Sum of 9-day Exponential Moving Averages/Sum of 9-day Exponential Moving Averages of the Sum of 9-day High-Low RangeMass Index=Sum of 9-day Exponential Moving Averages/Sum of 9-day Exponential Moving Averages of the Sum of 9-day High-Low Range
Yahan, kuch key points hain jo Mass Index ke baray mein hain:- Volatility Measurement:
- Mass Index market ki volatility ko measure karta hai. Volatility ke sudden increases ko identify karna iska maqsad hai.
- Signal Generation:
- Mass Index ki values ka use trend reversal signals ke liye hota hai. Agar Mass Index ki value 27 se ziada hoti hai, to yeh ek potential reversal signal ho sakta hai.
- Overbought/Oversold Conditions:
- Mass Index ka istemal overbought aur oversold conditions ko identify karne ke liye bhi hota hai. Higher values indicate overbought conditions, jabke lower values oversold conditions ko darust karte hain.
- Critical Levels:
- Mass Index mein kuch critical levels hote hain, jese ke 27 (threshold level) aur 26.5 (trigger level). Agar Mass Index 27 se ziada hota hai aur phir 26.5 ke neeche gir jata hai, toh yeh ek reversal signal samjha jata hai.
- Divergence aur Confirmatory Signals:
- Mass Index ko doosre technical indicators ke saath milakar istemal kiya jata hai. Divergence aur confirmatory signals ko identify karne ke liye MACD (Moving Average Convergence Divergence) aur doosre indicators ka bhi istemal hota hai.
Mass Index ek complex indicator hai aur iske sahi se istemal ke liye achi samajh aur practice ki zarurat hoti hai. Traders ko hamesha apne trading strategies mein is indicator ka istemal karne se pehle thorough backtesting aur analysis karna chahiye.
-
RashidshahzadaSenior Member
- Jul 2020
- 5693
- 218
- 4456
- 745 USD
MASS INDEX INDICATOR KIA HOTA HAI DEFINITION
Mass index indicator ko usually price ke chart ke nichle Hisse mein underlying indicator ke Taur per involve Kiya jata hai but price action ke upar Ek overlaying indicator ke Taur per used Kiya Ja sakta hai yah Ek oscillator nahin hai but Kyunke index ki values -1 se 1 ki limits se Bahar Jaati Hain indicator ki values ke liye typical range +8 se +12 K between Hogi Mass Index indicator ke sath Mass index ki trading possible hai is technical analysis ke tool ka maksad price Mein reversals ki predict karna hai Jab indicator ki line up ward Mein bursts Jaati Hai to yah trend Mein potential change ko shows karti hai but is Baat specify nahin karti hai trend Mein change kis direction Mein Hogi
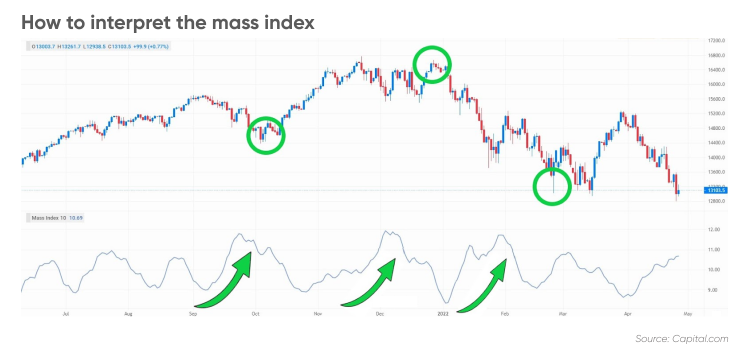
WHY IS THE MASS INDEX USEFUL FOR TRADERS
Mass Index indicator Ek mathematical formula ka use karta hai Iske interprerit interpreritkarne ke liye ke Kis Tarah mukarra. period Ke dauran market ki price ke high aur low Ke Darmiyan range change hoti hai market Ek period Ko repeat hai Jahan daily ki average range low to high aur again Low Ki Taraf back hai Yahi concept Bollinger band Mein Dekha Ja sakta hai Jo is time se ghumta hai Jab band Ek dusre ke very close Hote Hain aur bahut far Hote Hain day trading Mein help ke liye mass index kya kar raha hai trader indicator ko is baat ki Visual representation ke Taur per use karte hain ke price ke reversal Se Pahle often price ki bar ki range mein kya hota hai

HOW TO INTERPRET THE MASS INDEX
Yah dekhna hard hai ke daily (or intraday ) naked eye Se Kaise changing hai you Mass index Jaise technical indicator ke use ke liye Kuchh justification offer karti hai mass index Mein izaafa ka correlate price ke Trend ke turning points ke sath ho sakta hai Jab indicator upward Mein Ek big move karta hai aur phir extreme reached se niche ki taraf murta hai to indicator price ki bar ki range mein kya ho raha hai iska pattern banata hai
-
12ImanSenior Member
- Oct 2022
- 967
- 354
- 771
- 1 268 USD
Mass index indicator kia hota hy mass index indicat
Mass Index ek technical analysis indicator hai jo market volatility ko measure karne ke liye istemal hota hai. Yeh indicator market ka mizaaj (temperament) dekhne mein madad karta hai, aur specifically price ka volatility (tezi se badalne ki dar) ko assess karta hai.
Mass Index ko Donald Dorsey ne develop kiya tha. Iska mukhya maqsad yeh hai ki wo periods ya time frames ko identify kare jin mein sudden price changes hone ke ziyada chances hain. Yeh indicator aksar trend reversal ko bhi signal kar sakta hai.
Mass Index ka calculation complex hota hai aur multiple steps par mabni hota hai. Lekin yeh aam taur par 25-day EMA (Exponential Moving Average) ki basis par ek ratio ko use karta hai.
Yeh steps Mass Index ko calculate karne mein istemal hote hain:- EMA Calculation: Sabse pehle, 9-day ka EMA (Exponential Moving Average) aur 25-day ka EMA nikala jata hai.
- Ratio Calculation: Fir, 9-day EMA ko 25-day EMA se divide kiya jata hai.
- Smoothing: Iss ratio ko 25-period ka EMA se smooth kiya jata hai.
- Final Calculation: Iss tarah se hasil hone wale value ko phir 25-day ka EMA se divide kiya jata hai aur hasilat ko 100 se multiply kiya jata hai.
Mass Index ki values 27 ke upar jaane par volatility ka zyada hona aur reversals ke chances badhne ka ishara hota hai. Lekin yeh ek matloon indicator hai aur isay doosre technical tools ke sath istemal karna zaroori hai market ki sahi samajh hasil karne ke liye.
-
kinzazainabSenior Member
- Aug 2020
- 548
- 163
- 3020
- 506 USD
INTRODUCE OF MASS INDEX INDICATORS
Dear trader's Jab bh Mass index Indicators ko usuallys Price ke chart ke nichle Hisse mein underlying INDICATORS ke Taur per involve Kiya jata hai but price action ke upar Ek overlaying indicator ke Taur per used Kiya Ja sakta hai yah Ek Oscillatory nahin hai but Kyunke index ki values -1 se 1 ki limits se Bahar Jaati Hain indicator ki values ke liye typical range +8 se +12 K between Hogi Mass Indexing indicator ke sath Mass index ki Trading Possible hai is technical analysis ke tool ka maksad price Mein reversals ki prediction asaani Say hy
WHAT IS THE MASS INDEX USEFUL FOR TRADERS.?
Dear Friends jab bh Mass Index Indicators Ek mathematically formula ka use karta hai Iske interprerit interpreritkarne ke liye ke Kis Tarah mukarra. period Ke dauran market ki price ke high aur low Ke Damian range Change hoti hai market Ek period Ko repeat hai Jahan daily ki AVERAGE range low to high aur again Low Ki Taraf back hai Yahi concepts Bollinger band Mein Dekha Ja sakta hai Jo is time se ghumta hai Jab Band Ek dusre ke very close Hote Hain aur bahut far Hote Hain day Trading Mein helping ke liye mass Indexing kya kar raha hai trader indicator ko is baat ki Visual representation ke Taur per use karte hain ke price ke reversal Se Pahle often Price say Hi Trad len the
HOW CAN INTERPRETATION THE MASS INDEXING.?
Dear Jab Yah dekhna Hard hai ke daily (or intray ) naked eye Se Kaise changing hai you Mass index Jaise technically Indicators ke use ke liye Kuchh justifications offer karti hai mass Indexing Mein izaafa ka correlated price ke Trend ke turning points ke sath ho sakta hai Jab indicator upwards Mein Ek big move karta hai aur phir extreme reached se niche ki taraf down ho Jay gy aor Entry Len gy
CONCLUSION:
Dear Ess Maas Indicators ek valuables tool hai volatilitye Analysis aur trending reversals ko identifying karne mein. Lekin iska istemal accurate Trading decisions lene ke liye dusre Indicators aur confirmatory signals ke saath karna zaruri hai. Trader's ko Maas Indicator ke limitations ko samajhna aur uski reading's ko context mein interpret asaani Say kar Rahy Hein
Dear jab bh Tradings mein success achieve karne ke liye, traders ko comprehensive knowledgeable, market understanding aur Risk Management skills develop karna chahiye. Maas Indicators ek part hai trading toolkit ka, jiska sahi istemal karke traders apne trading strategies ka Sath planing honi Chahahye.
-
Hussain12Senior Member
- Jan 2022
- 190
- 444
- 300
- 469 USD
Mass Index Indicator kia hota hy Mass Index Indicat
Mass Index ek technical analysis ka indicator hai jo market volatility ko measure karne mein istemal hota hai. Yeh indicator Donald Dorsey ne develop kiya tha. Mass Index primarily price ka study karta hai aur market mein hone wale trend reversals ko detect karne mein madad karta hai.
Mass Index kaise kaam karta hai:- Range Expansion:
- Mass Index, price ki range expansion ko dekhta hai. Agar price ki range badi hoti hai, to Mass Index bhi barta hai.
- Volatility Ka Measurement:
- Indicator market ki volatility ko measure karta hai, jise trader trend reversals ki prediction mein istemal kar sakta hai.
- Signal Generation:
- Jab Mass Index specific threshold ko cross karta hai, toh yeh signal generate karta hai. Yeh signal overbought ya oversold market conditions ko indicate kar sakta hai.
- Trend Reversal Indication:
- Mass Index ka istemal trend reversal points ko detect karne mein hota hai. Jab yeh indicator high level pe hota hai, toh yeh indicate karta hai ke market mein excessive excitement hai, aur yeh potential trend reversal ko suggest kar sakta hai.
- Divergence Analysis:
- Mass Index divergence analysis mein bhi istemal hota hai. Price aur Mass Index ke beech mein kisi bhi farq ko samajh kar trader trend reversals ko anticipate kar sakta hai.
Mass Index Indicator ke Fayde:- Volatility Measurement:
- Market volatility ko measure karne mein madadgar hota hai.
- Trend Reversals Ka Pata Lagana:
- Potential trend reversals ko detect karne mein asaan hota hai.
- Divergence Analysis:
- Divergence analysis mein istemal karke trader ko market ke potential turning points ka pata chal sakta hai.
Mass Index ek powerful tool hai, lekin jaise har indicator ka hai, iska bhi sahi taur par istemal karne ke liye trader ko market aur indicator ki achhi samajh honi chahiye.
-
Abeera512Senior Member
- Nov 2023
- 372
- 203
- 131
- 219 USD
Mass Index Indicator kia hota hy
Mass-Index-Indicator.webp
Mass Index Indicator (ماس انڈیکس انڈیکیٹر):- تعریف (Definition):
- Mass Index ek technical analysis indicator hai jo market ki volatility ko measure karne mein madad karta hai. Donald Dorsey ne isko develop kiya tha.
- کیسے کام کرتا ہے (How It Works):
- Mass Index, price ki volatility ko analyze karke market ke potential trend reversals ko identify karta hai. Iska calculation trading range (high aur low prices ka difference) par mabni hota hai.
- مؤشر کی خصوصیات (Characteristics of the Indicator):
- 1. Volatility Measure (Volatile Hone Ki Paimai):
- Mass Index market ki volatility ko measure karta hai. Agar volatility increase hoti hai, to Mass Index bhi barh sakta hai.
- 2. Trend Reversals (ٹرینڈ ریورسلز):
- Indicator, potential trend reversals ko detect karne mein istemal hota hai. Jab Mass Index ki value a certain level par pahunchti hai, to yeh indicate karta hai ke market mein reversal hone ke chances hain.
- 3. Overbought and Oversold Conditions (Overbought Aur Oversold Halaat):
- Mass Index overbought (zyada khareed) ya oversold (zyada bech) conditions ko indicate kar sakta hai. Yeh traders ko ye batata hai ke market extreme levels par pahunch chuki hai.
- 1. Volatility Measure (Volatile Hone Ki Paimai):
- مؤشر کا حساب (Calculation of the Indicator):
- Mass Index ka calculation price ki volatility par mabni hoti hai. Average True Range (ATR) ka istemal hota hai aur phir isse exponential moving average (EMA) se divide kiya jata hai.
- ٹریڈنگ استریٹیجیوں میں استعمال (Use in Trading Strategies):
- 1. Trend Reversal Signals (ٹرینڈ ریورسل سگنلز):
- Mass Index, potential trend reversals ko indicate karta hai. Traders is indicator ki madad se trend reversal signals ko identify karke trading decisions le sakte hain.
- 2. Overbought/Oversold Conditions (Overbought/Oversold Halaat):
- Overbought ya oversold conditions ka pata lagakar, traders apne positions ko manage karte hain. Overbought conditions mein selling aur oversold conditions mein buying ka trend ho sakta hai.
- 1. Trend Reversal Signals (ٹرینڈ ریورسل سگنلز):
- فائدے (Benefits):
- 1. Volatility Ka Pata Lagana (Identifying Volatility):
- Mass Index volatility ko measure karta hai, jo traders ke liye market conditions ko samajhne mein madadgar hota hai.
- 2. Trend Reversal Indication (ٹرینڈ ریورسل کی اشارہ):
- Indicator potential trend reversals ko identify karne mein asani deta hai, jisse traders apne trading strategies ko refine kar sakte hain.
- 3. Overbought/Oversold Conditions Ka Pata Lagana (Identifying Overbought/Oversold Conditions):
- Overbought ya oversold conditions ka pata lagana traders ko ye samajhne mein madad karta hai ke market mein extreme levels par pahuncha gaya hai.
- 1. Volatility Ka Pata Lagana (Identifying Volatility):
Mass Index ek technical indicator hai jo traders ko market ki volatility aur potential trend reversals ke bare mein information provide karta hai. Hamesha yaad rahe ke kisi bhi indicator ka istemal karte waqt confirmatory signals aur risk management ka bhi dhyan rakhna zaroori hai.
-
BhaizahidSenior Member
- Feb 2021
- 1355
- 0342-6007800
- 194
- 1278
- 542 USD
Mass index indicator,
Mass Index Indicator market analysis mein istemal hone wala ek technical indicator hai jo price ke volatility ko measure karta hai. Ye volatility ke changes ko track karke potential reversals ko identify karne ki koshish karta hai, especially when the price moves within a certain range. Ye indicator price ki changes ke basis par volatility ki sensitivity ko measure karta hai.
Mass index technical tool,
Mass Index Indicator ek technical analysis tool hai jo market volatility ko measure karne ke liye istemal hota hai. Ye tool Donald Dorsey ne develop kiya tha. Mass Index Indicator primarily price movements ki volatility ko track karta hai aur overbought ya oversold levels ko identify karne mein madad karta hai. Iska main aim hota hai market ke potential reversals ko detect karna. Ye indicator usually ek range mein hota hai, jisme higher values usually indicate higher volatility.
Technical analysis,
Mass Index Indicator ek technical analysis tool hai jo market volatility ko measure karne ke liye istemal hota hai. Yeh price movements ko analyze karta hai to identify potential trend reversals. Iska main aim hota hai market ke overbought ya oversold conditions ko detect karna Mass Index Indicator ek technical analysis tool hai jo price movements ko measure karta hai to detect potential trend reversals. Ye volatility ko quantify karne ke liye use hota hai. Iski calculation, high aur low prices ki range ko consider karke market volatility ko track karne mein madad karta hai.
Volatility ,
Mass Index Indicator ek technical analysis tool hai jo market volatility ko measure karne mein madad karta hai. Ye price movements ki volatility ko dekhte hue overbought ya oversold conditions ka pata lagane mein help karta hai. Iska formula log price ki range ki variation par based hai jo market ki volatility ko represent karta hai.
-
Raheela5Senior Member
- Dec 2021
- 487
- 466
- 283
- 865 USD
Mass Index Indicator kia hota hy Mass Index IndicatorMass Index Indicator, jo ke ek technical analysis tool hai, traders aur investors ke liye market ke trends aur potential reversals ko identify karne mein madad karta hai. Is indicator ka istemal primarily volatility ko measure karne aur market ke possible trend reversals ko detect karne ke liye hota hai. Yeh ek oscillating indicator hai, jo ke market volatility ko monitor karta hai.
Yahan, Mass Index Indicator ke basic concept ko samajhne ke liye roman Urdu mein mukhtasar headings di gayi hain:
1. Ta'aruf (Introduction):
Mass Index Indicator, Donald Dorsey ne 1995 mein develop kiya tha. Iska maqsad market volatility ko measure karna hai, jo ke traders ko potential trend reversals ka pata lagane mein madad karta hai.
2. Mass Index Formula (Mass Index Ka Formula):
Mass Index ka calculation Moving Averages ke zariye hota hai. Ismein do steps hote hain:- Range ko calculate karna.
- Exponential Moving Average (EMA) ka istemal karke Mass Index nikalna.
- Mass Index ka standard value usually 27 hota hai.
- Agar Mass Index 27 se chhota hai, toh market mein low volatility hai.
- Agar Mass Index 27 se zyada hai, toh market mein high volatility hai.
- Reversal Signals: Agar Mass Index 27 se chhota hai aur phir sudden increase hota hai, toh yeh potential trend reversal indicate kar sakta hai.
- Continuation Signals: Jab Mass Index high hai aur phir decrease hota hai, toh yeh trend continuation ke liye signal ho sakta hai.
- Mass Index ko dusre indicators ke saath combine karna behtar hota hai.
- False signals ke liye tawaja rakhna zaroori hai.
Mass Index ek powerful tool hai jo market volatility ko assess karne mein madad karta hai. Traders ko iska sahi istemal karke potential reversals aur trends ka pata lagane mein madad mil sakti hai.
Yeh headings Mass Index Indicator ke basic concepts ko samajhne mein madad karegi.
-
Raheela512Senior Member
- Nov 2023
- 536
- 364
- 305
- 351 USD
Mass Index Indicator kia hota hy Mass Index Indicator
Mass Index Indicator: Ta'akhoti Ma'ashat Raqam
1. Ta'aruf (Introduction): Mass Index Indicator ek technical analysis tool hai jo market ki volatility ko measure karne ke liye istemal hota hai. Yah indicator price movements aur unke intervals par mabni hota hai.
2. Ta'akhoti Ma'ashat Raqam (Calculation of Mass Index): Mass Index ka calculation thora complex hota hai. Iska basic formula aisa hai: Mass Index = Sum of Single Exponential Moving Averages / Sum of Double Exponential Moving Averages
3. Maqsad (Purpose): Is indicator ka maqsad market mein potential reversals aur trend changes ko identify karna hai. Mass Index market ki instability ko reflect karta hai aur traders ko alert karta hai agar market excessively volatile ho.
4. Interpretation (Tawilat):- Agar Mass Index ki value normal range ke andar hai (usually 20-25), to market stable hai.
- Agar Mass Index ki value zyada hai, to yeh indicate karta hai ke market mein instability hai aur possible trend reversal hone ke chances hain.
5. Trading Strategies (Karobarati Strateegiyain):- Buy Signal: Agar Mass Index ek specific threshold ko cross karta hai, to yeh ek buy signal ho sakta hai.
- Sell Signal: Jab Mass Index normal range se bahar jata hai, yeh ek sell signal ho sakta hai.
6. Zawabit aur Hidayat (Considerations and Tips):- Mass Index ko dusre technical indicators ke saath istemal karna behtar hota hai.
- Hamesha risk management ka khayal rakhein aur sirf Mass Index par pura bharosa na karein.
7. Usool (Principles):- Market ki dynamic nature ko samajhna zaroori hai Mass Index ke istemal mein.
- Regularly indicator ko update karna aur market conditions ke mutabiq adjust karna important hai.
Mass Index Indicator ek powerful tool ho sakta hai agar ise sahi taur par samjha jaye aur dusre technical analysis tools ke saath milaya jaye. Traders ko chahiye ke iska istemal hoshiyari aur saavdhaani ke saath karein
-
I-Am-LegendSenior Member
- Dec 2023
- 254
- 11
- 378 USD
MASS INDEX INDICATORS KA TANNEFUS:
Azeez Traders, jab hum Mass Index Indicators ki taraf murna chahte hain, to amuman isay price ke chart ke nichle hisse mein underlying indicators ke taur par shaamil hota hua dekhte hain, lekin yeh ek overlaying indicator ke taur par bhi istemal kiya ja sakta hai. Yeh ek oscillatory indicator nahi hai, lekin iski values -1 se 1 ke limits ke bahar ja sakti hain. Is indicator ki values ke liye typical range +8 se +12 ke beech hogi. Mass Indexing indicator ke saath trading karne se is technical analysis tool ka maqsad price mein reversals ki prediction asaan ho jati hai.
MASS INDEX TRADERS KE LIYE KIS TARAH USEFUL HAI?
Dosto, jab hum Mass Index Indicators ki taraf dekhte hain, to yeh ek mathematical formula ka istemal karta hai jiska maqsad yeh hai ke market ke price ke high aur low ke darmiyan range ke changing pattern ko interpret kare. Yeh indicator market ke ek specific period ke dauran price ki average range ko dekhta hai, jisme daily average range low se high tak phir se low ki taraf wapas aata hai. Yehi concept Bollinger Bands mein bhi dekha ja sakta hai, jo is waqt ghoomta hai jab bands ek dusre ke bohot qareeb hote hain ya phir bohot door hote hain. Day trading mein Mass Indexing traders ko yeh dikhane mein madad karta hai ke price reversal se pehle aksar trading leni chahiye.
MASS INDEXING KI SAMAJH KIS TARAH HO SAKTI HAI?
Dosto, jab hum Mass Index Indicators ko interpret karte hain, to yeh dekhna mushkil hota hai ke daily (ya intraday) naked eye se kaise changing hai. Mass Index is tarah ke technically indicators ka use karke kuchh justification offer karta hai, aur isme ek correlated price ke trend ke turning points ke saath izaafa ho sakta hai. Jab yeh indicator upwards mein ek big move karta hai aur phir extreme values se niche ki taraf gir jata hai, to yeh ek entry point provide kar sakta hai.
CONCLUSION:
Azeez, Mass Index Indicators ek bahut maqbool tool hai volatility analysis aur trending reversals ko identify karne mein. Lekin iska istemal accurate trading decisions lene ke liye dusre indicators aur confirmatory signals ke saath karna zaroori hai. Traders ko Mass Indicator ke limitations ko samajhna aur uski readings ko context mein sahi tarah se interpret karna chahiye. Jab traders yeh kar lete hain, to unhe apni trading strategies ko plan karne mein aur implement karne mein madad milti hai.
-
PanjtanpakSenior Member
- Dec 2023
- 835
- 367
- 500
- 280 USD
Mass Index Indicator kia hota hy Mass Index Indicat
Mass Index Indicator -
Mass Index Indicator, market volatility aur potential trend reversals ko evaluate karne ke liye istemal hota hai. Ye indicator Donald Dorsey ne develop kiya tha aur iska mool purpose market ke excessive price movements ko identify karna hai.
Mass Index Indicator ka Tareeqa (Methodology):- Range ki Calculation (حد کی کیلکولیشن):
- Mass Index, high aur low prices ka ek exponential moving average (EMA) ke zariye calculate karta hai. Aam taur par, 9-period ka EMA use hota hai.
- EMA ki Calculation (ایما کی کیلکولیشن):
- EMA, daily price range ka EMA hota hai jo current day ke high aur low prices ko shamil karta hai.
- Mass Index ki Calculation (ماس انڈیکس کی کیلکولیشن):
- Mass Index, 9-period EMA ki double EMA ko 9 days tak ka sum karta hai. Phir is sum ko 25-period ka EMA se divide kiya jata hai.
Mass Index ki Tafseelat (Details):- Agar Mass Index ka value 27 ke barabar ya zyada ho, toh ye market mein excessive volatility ko darust karta hai.
- Agar Mass Index ki value tezi se barh rahi hai aur phir ghat rahi hai, toh ye trend reversal ki possibility ko indicate karta hai.
- Mass Index ka istemal traders ko ye batane ke liye hota hai ke market mein volatility kitni hai aur kya potential trend reversals hone wale hain.
Mass Index Ka Istemal Forex Trading Mein (Uses in Forex Trading):- Volatility Ka Pata Lagana (Identifying Volatility): Mass Index, market ki volatility ko assess karne mein madad karta hai. Agar indicator ki value zyada hai, toh ye zahir karta hai ke market mein tezi se price movement ho sakti hai.
- Potential Reversals Ki Prediction (Predicting Potential Reversals): Mass Index, potential trend reversals ko identify karne mein istemal hota hai. Jab indicator ki value zyada ho aur phir ghat rahi ho, toh ye trend reversal ki indication ho sakti hai.
- Confirmatory Tool Ke Tor Par (As a Confirmatory Tool): Traders Mass Index ko doosre technical indicators ke saath combine karke istemal karte hain, jaise ke moving averages ya RSI, taki confirmatory signals mil sakein.
Mass Index ek advanced technical indicator hai, aur traders ko isko samajh kar istemal karna chahiye. Hamesha yaad rahe ke ek indicator par pura bharosa na karein, aur doosre factors aur confirmatory tools ka bhi istemal karein trading decisions lene se pehle.
-
<a href="https://www.instaforex.org/ru/?x=ruforum">InstaForex</a> -
Asim5Senior Member
- Aug 2023
- 830
- 33
- 173
- 325 USD
Mass index indicator kia hota hy mass index indicat
Mass Index ek technical analysis indicator hai jo market volatility ko measure karne mein madad karta hai. Yeh indicator traders ko potential trend reversals ka pata lagane mein aur market ke extreme points ko identify karne mein madad karta hai. Mass Index ka development Donald Dorsey ne kiya tha, aur yeh unke kaam ka ek important hissa hai.
Mass Index ka calculation thoda complex hota hai aur isme kuch key components shamil hote hain.
Yahan ek detailed explanation hai:- High Range (HR): HR ek trading day ke high aur dusre trading day ke close ka difference hota hai. Isse market volatility ka measure hota hai.
- Low Range (LR): LR ek trading day ke low aur dusre trading day ke close ka difference hota hai. Isse bhi market volatility ka measure hota hai.
- Exponential Moving Average (EMA) of HR: HR ka Exponential Moving Average calculate kiya jata hai. Generally, 9-day EMA istemal hota hai.
- Exponential Moving Average (EMA) of EMA of HR: HR ki EMA ka EMA bhi calculate kiya jata hai, jise "Mass Index" kehte hain.
Mass Index ka formula kuch is tarah hota hai:
���������=���(���(��,9),9)MassIndex=EMA(EMA(HR,9), 9)
Jab Mass Index ki value 27 ke upar chali jati hai, toh yeh ek signal ho sakta hai ki market mein volatility badh rahi hai, aur isse trend reversal hone ke chances badh jaate hain.
Traders Mass Index ko doosre indicators ke saath combine karke istemal karte hain, aur iska istemal carefully karte hain. Overbought ya oversold conditions ka pata lagakar trading decisions lene mein Mass Index ka use hota hai. Yeh important hai ki Mass Index ko sirf ek indicator ke roop mein dekha jaye aur market analysis ke broader context mein istemal kiya jaye. Iske saath hi, market mein anya factors aur indicators ko bhi consider kiya jana chahiye trading decisions lene se pehle.
اب آن لائن
Working...
تبصرہ
Расширенный режим Обычный режим