What is tryangle consolidation pattren
-
NoorfatimaaMember

- Feb 2023
- 47
- 13
- 48
- 3 USD
-
<a href="https://www.instaforex.org/ru/?x=ruforum">InstaForex</a> -
NoorfatimaaMember
- Feb 2023
- 47
- 13
- 48
- 3 USD
What is tryangle consolidation pattren. Forex market main Triangle Consolidation Pattern aik chart pattern hai jo technical analysis mein istmal kiya jata hai Ye aik price action pattern hota hai jis mein price ki movement ko triangle k andar ya us ke aas paas dekha jata hai Is pattern mein price higher highs or lower lows ke bech mein consolidate hoti hai jisse ek triangle jaise shape banta hai Triangel consolidation pattern kayi trah ke ho sakte hain, jaise ascending triangle descending triangle symmetrical triangle etc in patterns ko chart par dekh kar traders price ki further movement ko predict karne ki koshish karte hain Is pattern mein typically price triangle ke bhar ya uske upper ya lower trendline se breakout karte hain Breakout ke baad price usually ek strong move show karti hai jisse traders ko trading opportunities miltey hain Triangle consolidation pattern traders ko price ki direction trend continuation ya reversal ke potential signals provide kar sakta hai lekin ye aik indicator nahi hota hai aur isko dusre technical tools or price action patterns k saath confirm karna zaroori hota hai. Isliye traders ko is pattern ko samajhna or istmal karna zaroori hota hai sath hi proper risk management k sath trading karna chahiye Is pattern ke bare mein zaroori hai ki aap acche sy study karein or expert advice lein agar aap isko apne trading strategy mein istemal karna chahty hain Types of triangle pattren Forex market mein Triangle Patterns ya Triangular Patterns ki kuch aam aqsam hoti hain Ye charting patterns hotay hain jo forex market ke price charts par banay jatay hain aur traders ko price movement aur trend ke bare mein madad dete hain. Pakistan ke forex traders ki madad ke liye yahan kuch aam Triangle Patterns ki aqsam hain: 1.Ascending Triangle Ye pattren bullish trend ke samay hota hai aur uptrend ke continuation yaani jari hone ki soorat mein ban sakta hai. Ismein price bars higher highs banti hain aur trendline sloping hoti hai jo horizontal resistance level se milte hain 2.Descending Triangle Ye pattren bearish trend ke samay hota hai aur downtrend ke continuation yaani jari hone ki soorat mein ban sakta hai. Ismein price bars lower lows banti hain aur trendline sloping hoti hai jo horizontal support level se milte hain 3.Symmetrical Triangle Ye pattren market k indecision yaani samjhota ke samay hota hai, jab price bars higher highs aur lower lows banate hain aur trendlines ko milte hain. Ye pattren usually ek breakout yaani price movement ke baad form hota hai Pennant Ye ek continuation pattern hota hai jo price trend ke continuation yaani jari hone ki soorat mein ban sakta hai. Ismein price bars narrow range mein trade karte hain aur trendlines ko milte hain, jaise jhanda ban jata hai. Ye sirf kuch aam triangle patterns hain jo forex market mein dekhe jate hain. Forex traders ko in patterns ko samajhna aur samjhna zaroori hota hai takay unko market movement aur trend ke bare mein behtar samjh ho aur unko trading decisions lene mein madad mile. Har ek pattern apne tajurbe aur samay ke mutabiq hota hai, isliye traders ko apne tajurbe aur technical analysis ke sath in patterns ko samajhna chahiye. Yeh important hai ke traders proper risk management ke sath trading karen aur ek professional financial advisor ya trader se mashwara len, khaas karke forex market ki samajh aur trading strategies ke bare mein. Trading mein hamesha apne risk tolerance aur financial situation ko samjhein aur apne trades ko samjhote hue faisle lein. Ye zaroori hai ke aap apne country ya region ke trading rules aur regulations ko samjhein aur unko follow karen. Iske alawa, trading ke liye hamesha apne knowledge aur skills ko improve kartey rahein How to use Triangle pattren in analysis Forex market main Triangle analysis karne k liye aapko kuch steps follow karne honge. Yeh analysis aapko market ke price movements aur trend ko samajhne mein madad karegi. Neeche diye gaye hai kuch steps triangle analysis karne ke liye: 1.Trend Identification: Sabse pehle aapko current trend ko identify karna hoga. Trend ko samajhne ke liye aap price chart ko dekh sakte hain aur trend lines ka istemal karke uptrend, downtrend ya sideways trend ko identify kar sakte hain. 2.Triangle Pattern Recognition: Triangle pattern ko recognize karna hoga. Triangle pattern hota hai jab price chart mein higher highs aur lower lows ke beech mein price consolidate hoti hai aur ek triangle shape banti hai. Is pattern ko recognize karne ke liye aapko price chart ko dekhna hoga aur trend lines ko draw karke triangle shape ko identify karna hoga. 3.Breakout Confirmation: Triangle pattern mein price consolidation ke baad ek breakout hota hai, jahan price upper ya lower trend line ko cross karti hai. Aapko breakout confirm karna hoga, jaise hi breakout ho, woh direction trend ban jati hai. 4.Stop Loss Placement: Stop loss ek zaroori risk management tool hai. Triangle pattern mein breakout ke direction mein stop loss lagana zaroori hota hai, taaki aap apne trading position ko protect kar sakein, agar price opposite direction mein chale jaye. 5.Target Setting: Triangle pattern mein aapko target set karna hoga, yani ki expected price movement ke liye ek target level decide karna hoga, jahan aap apna trade close kar sakte hain aur profit book kar saktey hain 6.Risk-Reward Ratio: Risk-reward ratio ko bhi dhyan mein rakhna zaroori hai. Triangle pattern mein aapko apne risk-reward ratio ko manage karna hoga, yani ki kitna risk aap le rahe hain compared to kitna reward aap expect kar rahe hain note Yeh the kuch basic steps triangle analysis karne ke liye forex market mein. Aapko market ke current conditions aur apne trading strategy ke hisab se apne analysis ko customize karna hoga. Forex trading mein risk hota hai, isliye aapko apne risk tolerance aur trading plan ko samajh kar trading karna chahiye. Aapko ek experienced trader ya financial advisor ki madad leni chahiye, agar aapko trading ke baare mein samajhne mein mushkilat hain -
ExpMember
- Jan 2023
- 41
- 97
- 40
- 34 USD
ASSALAM O ALAIKUM GUYS, Triangle Consolidation pattern ek continuation pattern hai, jo trend direction ko confirm karta hai. Is pattern ko price chart par triangle ke shape mein form hone ke basis par recognize kiya jata hai. Pattern do types ke hote hain: ascending triangle aur descending triangle. Traders is pattern ko use karke breakout ke direction ke hisab se trading positions le sakte hain. EXPLAINATION : Triangle Consolidation pattern technical analysis mein ek continuation pattern hai, jo trend direction ko confirm karta hai. Is pattern ko price chart par triangle ke shape mein form hone ke basis par recognize kiya jata hai. Triangle Consolidation pattern ko do types mein divide kiya jata hai: Ascending Triangle: Jab price chart mein higher lows aur same resistance level hone lage, to yeh ascending triangle pattern form karta hai. Descending Triangle: Jab price chart mein lower highs aur same support level hone lage, to yeh descending triangle pattern form karta hai. In dono patterns mein price action triangle ke andar move karta hai aur ek point par breakout karta hai, jisse trend direction confirm hota hai. Triangle Consolidation pattern ko identify karne ke baad traders, breakout ke direction ke hisab se trading positions le sakte hain. Is pattern ka use karne se pehle traders ko iske risks aur limitations ko bhi samajhna zaruri hai. Iske alawa, traders ko Triangle Consolidation pattern ko sahi tarah se recognize karna aur sahi entry aur exit points tay karna bhi zaruri hota hai. RECOGNIZATION : Triangle Consolidation pattern ko price chart par recognize karne ke liye traders ko following steps follow karne hote hain: Price trend ko identify karein: Traders ko pehle price trend ko identify karna hota hai, kyunki Triangle Consolidation pattern trend continuation pattern hai. Triangle shape ko search karein: Traders ko triangle shape search karna hota hai, jo price chart mein form ho raha hai. Is pattern mein price action triangle ke andar move karta hai aur triangle ke dono sides par price levels converge hote hain. Support aur Resistance levels ko observe karein: Traders ko pattern ke formation ke sath-sath support aur resistance levels ko bhi observe karna hota hai. Ascending triangle pattern mein support level horizontal hota hai aur resistance level higher highs par form hota hai. Descending triangle pattern mein resistance level horizontal hota hai aur support level lower lows par form hota hai. Volume ko analyze karein: Traders ko pattern formation ke sath-sath volume ko bhi analyze karna hota hai, kyunki breakout ke sath volume bhi increase hota hai. SYNTAX OF TRADE USING THIS PATTERN : Triangle Consolidation pattern ko trade karne ke liye traders following steps follow kar sakte hain: Pattern formation ko confirm karein: Traders ko pehle price chart par Triangle Consolidation pattern formation ko confirm karna hota hai. Iske liye traders price trend, triangle shape, support aur resistance levels, volume aur price action ko observe karte hain. Entry point tay karein: Jab pattern formation confirm ho jaye, to traders ko entry point tay karna hota hai. Entry point ko breakout ke direction ke hisab se tay kiya jata hai. Agar price ascending triangle pattern se breakout karta hai, to traders buy positions le sakte hain aur agar price descending triangle pattern se breakout karta hai, to traders sell positions le sakte hain. Stop loss tay karein: Traders ko apni trades ke liye stop loss tay karna hota hai, taki loss control mein rahe. Stop loss ko breakout point ke thode pichhe tay kiya jata hai. Target price tay karein: Traders ko apni trades ke liye target price bhi tay karna hota hai. Target price ko price chart ke pichhle swing high ya swing low levels ke basis par tay kiya jata hai. Risk aur reward ka balance rakhein: Traders ko apni trades mein risk aur reward ka balance rakhna hota hai. Agar traders ko lagta hai ki risk reward ratio thik nahi hai, to wo trade avoid kar sakte hain.Iske alawa, traders ko Triangle Consolidation pattern ke risks aur limitations ko bhi samajhna hota hai. Traders ko pattern formation ko sahi tarah se recognize karna aur sahi entry aur exit points tay karna bhi zaruri hota hai. ADVANTAGES : Triangle consolidation pattern ek technical analysis tool hai, jismein price action ko study karke future price movements ko predict kiya jata hai. Yeh pattern ek triangle ki shape mein hota hai, jismein price swings high and low karte hain, lekin overall price range mein consolidation dikhta hai. Is pattern ke kuch faide hai, jo niche diye gaye hain: Price trend ka direction: Triangle consolidation pattern ko dekh kar aap price ka direction predict kar sakte hain. Agar triangle upward facing hai toh yeh bullish trend ka signal hai aur downward facing hai toh bearish trend ka signal hai. Entry and exit points: Yeh pattern aapko entry and exit points bhi provide kar sakta hai. Agar price upward trend mein hai aur triangle pattern ko breakout karta hai toh aap buy kar sakte hain. Aur agar price downward trend mein hai aur triangle pattern ko breakout karta hai toh aap sell kar sakte hain. Stop loss placement: Triangle consolidation pattern aapko stop loss ka placement bhi suggest kar sakta hai. Agar aap long position mein hain aur price breakout ke baad triangle pattern ko break karta hai, toh aap apna stop loss triangle ke neeche rakh sakte hain. Yeh faide triangle consolidation pattern ke hain, lekin technical analysis tools ka istemal karne se pehle hamesha apni research aur risk management ko samajhna zaroori hai. CONCLUSIONS : Is pattern mein security ki price range gradually narrow hoti hai aur eventually ek triangle shape banti hai. Is pattern mein typically high volume trading aur price volatility hoti hai, jo ki ek breakout ke sign hote hain. Agar breakout upside ke direction mein hota hai, to ye bullish sign hai aur security ki price mein upside potential indicate karta hai. Agar breakout downside ke direction mein hota hai, to ye bearish sign hai aur security ki price mein downside potential indicate karta hai. Is pattern ke sahi tarike se identify karna aur interpret karna kafi mushkil hota hai, isliye iske saath kisi experienced technical analyst ki advice lena behatar hoga. -
MkaifSenior Member
- Jul 2020
- 1957
- 1590
- 2883
- 638 USD
What is tryangle consolidation pattren. Triangle Consolidation Pattern is a common chart pattern in the forex market that can be identified through technical analysis. Likewise, price action patterns can be identified through price movement and may be used to predict future price movements. Is the price pattern one of higher highs or lower lows that has been consolidating when an equilateral triangle has been formed? Ascending triangle, descending triangle, symmetrical triangle, and other triangle patterns are examples of consolidation patterns that traders use to predict future price movement. Is pattern mein generally price triangle ke bhar ya uske upper ya lower trendline se breakout karte hain? Often, a large surge at the price of a breakout presents traders with trading chances. Triangle consolidation pattern traders' ability to provide potential signals for trend continuation or reversal despite the absence of an indicator and the fact that other technical indicators or price action patterns can be used to confirm a trend. Proper risk management and effective trading strategies are provided by traders who follow certain patterns. If a person uses an effective trading technique, is pattern ke bare mein zaroori hai ki aap acche sy research karein or expert counsel lein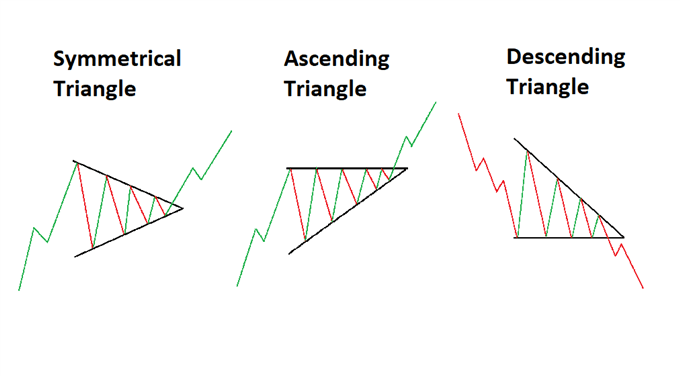 How to use Triangle pattren in analysis Main Triangle analysis in the forex market is followed by a number of steps. Market price changes and trend analysis are included in this sentence. Step-by-step triangle analysis is what we do here, so: 1.Trend Identification: Please let us know what the current trend is. Price charts are used to identify trends, and trend lines are used to determine if an uptrend, downtrend, or sideways trend is present. 2. Recognizing Triangle Patterns: Triangle patterns are recognised. When the price chart's higher highs and lower lows are present, the price tends to consolidate, and an ek triangle pattern is present. Is there a pattern that can be recognised? If so, a price chart and trend lines may be drawn, and a triangle's shape can be recognised. 3. Confirmation of the Breakout: Triangle pattern mein price consolidation ke bad ek breakout hota hai, jahan price upper ya lower trend line ko cross karti hai. When a breakout occurs, it is confirmed, and the direction of the trend changes. 4.Stop Loss Placement: Stop loss is a key component of risk management. If the price moves in the opposite direction to the breakout direction from the triangle pattern's stop loss, the trading position should be protected. 5. Establishing of Targets: Triangle pattern mein aapko target set karna hoga, yani ki projected price movement ke liye ek target level determine karna hoga, jahan aap apna trade close kar sakte hain aur profit book kar saktey hain 6.Risk to Reward Ratio: Risk to reward ratio ko bhi dhyan mein rakhna zaroori hai. Triangle pattern mein aapko apne risk-reward ratio ko manage karenge, yani ki kitna risk aap le rahe hain compared to kitna reward aap expect karenge
 noteTriangle analysis in the forex market is done using a few simple procedures. The market's current circumstances and your trading strategy's research should be customised, according to you. Forex trading is risky, so it is important for each trader to have a risk tolerance and trading strategy in place. If a person's trading is successful, they should consult a financial counsellor or an experienced trader, according to the phrase "trading is successful if..."
-
FizzaSenior Member
- Jun 2020
- 305
- 754
- 2015
- 237 USD
tryangle combination pattren kya h Forex market primary Triangle Solidification Example aik diagram design hai jo specialized examination mein istmal kiya jata hai Ye aik cost activity design hota hai jis mein cost ki development ko triangle k andar ya us ke aas paas dekha jata hai Is design mein cost better upsides or worse low points ke bech mein unite hoti hai jisse ek triangle jaise shape banta hai Triangel combination design kayi trah ke ho sakte hain, jaise rising triangle plummeting triangle balanced triangle and so on in designs ko graph standard dekh kar merchants cost ki further development ko anticipate karne ki koshish karte hain Is design mein normally cost triangle ke bhar ya uske upper ya lower trendline se breakout karte hain Breakout ke baad cost for the most part areas of strength for ek show karti hai jisse dealers ko exchanging amazing open doors miltey hain Triangle union example brokers ko cost ki bearing pattern continuation ya inversion ke potential signs give kar sakta hai lekin ye aik marker nahi hota hai aur isko dusre specialized apparatuses or cost activity designs k saath affirm karna zaroori hota hai. Isliye dealers ko is design ko samajhna or istmal karna zaroori hota hai sath hello there appropriate gamble the executives k sath exchanging karna chahiye Is design ke exposed mein zaroori hai ki aap acche sy study The most effective method to utilize Triangle pattren in examination Forex market principal Triangle examination karne k liye aapko kuch steps follow karne honge. Yeh examination aapko market ke cost developments aur pattern ko samajhne mein madad karegi. Neeche diye gaye hai kuch steps triangle investigation karne ke liye:1.Trend Recognizable proof: Sabse pehle aapko latest thing ko distinguish karna hoga. Pattern ko samajhne ke liye aap cost diagram ko dekh sakte hain aur pattern lines ka istemal karke upswing, downtrend ya sideways pattern ko distinguish kar sakte hain.2.Triangle Example Acknowledgment: Triangle design ko perceive karna hoga. Triangle design hota hai poke cost graph mein better upsides aur worse low points ke beech mein cost unite hoti hai aur ek triangle shape banti hai. Is design ko perceive karne ke liye aapko cost outline ko dekhna hoga aur pattern lines ko draw karke triangle shape ko recognize karna hoga.3.Breakout Affirmation: Triangle design mein cost combination ke baad ek breakout hota hai, jahan cost upper ya lower pattern line ko cross karti hai. Aapko breakout affirm karna hoga, jaise hello there breakout ho, woh course pattern boycott jati hai.4.Stop Misfortune Situation: Stop misfortune ek zaroori risk the executives device hai. Triangle design mein breakout ke heading mein stop misfortune lagana zaroori hota hai, taaki aap apne exchanging position ko safeguard kar sakein, agar cost inverse bearing mein chale jaye.5.Target Setting: Triangle design mein aapko target set karna hoga, yani ki expected cost development ke liye ek target level choose karna hoga, jahan aap apna exchange close kar sakte hain aur benefit book kar saktey hain6.Risk-Prize Proportion: Chance award proportion ko bhi dhyan mein rakhna zaroori hai. Triangle design mein aapko apne risk-reward proportion ko oversee karna hoga, yani ki kitna risk aap le rahe hain contrasted with kitna reward aap expect kar rahe hainnoteYeh the kuch fundamental advances triangle investigation karne ke liye forex market mein. Aapko market ke current circumstances aur apne exchanging technique ke hisab se apne investigation ko alter karna hoga. Forex exchanging mein risk hota hai, isliye aapko apne risk resistance aur exchanging plan ko samajh kar exchanging karna chahiye. Aapko ek experienced merchant ya monetary counselor ki madad leni chahiye, agar aapko exchanging ke baare mein samajhne mein mushkilat hain Benefits : Triangle solidification design ek specialized investigation apparatus hai, jismein cost activity ko study karke future cost developments ko anticipate kiya jata hai. Yeh design ek triangle ki shape mein hota hai, jismein cost swings high and low karte hain, lekin generally speaking cost range mein combination dikhta hai.Is design ke kuch faide hai, jo specialty diye gaye hain:Cost pattern ka bearing: Triangle solidification design ko dekh kar aap cost ka heading foresee kar sakte hain. Agar triangle up confronting hai toh yeh bullish pattern ka signal hai aur descending confronting hai toh negative pattern ka signal hai.Passage and leave focuses: Yeh design aapko section and leave focuses bhi give kar sakta hai. Agar cost vertical pattern mein hai aur triangle design ko breakout karta hai toh aap purchase kar sakte hain. Aur agar cost descending pattern mein hai aur triangle design ko breakout karta hai toh aap sell kar sakte hain.Stop misfortune arrangement: Triangle combination design aapko stop misfortune ka position bhi recommend kar sakta hai. Agar aap long position mein hain aur cost breakout ke baad triangle design ko break karta hai, toh aap apna stop misfortune triangle ke neeche rakh sakte hain.Yeh faide triangle union example ke hain, lekin specialized investigation instruments ka istemal karne se pehle hamesha apni research aur risk the board ko samajhna zaroori hai. -
TrainSenior Member
- Oct 2022
- 166
- 2
- 20
- 168 USD
Triangle Consolidation Pattern forex mein ek aam technical analysis tool hai jo market trends aur price action ka analysis karta hai. Triangle consolidation pattern ek continuation pattern hai jo trend ki continuation ya reversal ke signals provide karta hai. Is article mein hum Triangle Consolidation Pattern ke baare mein different headings mein discuss karenge. Working principle: Triangle Consolidation Pattern, trend ki continuation ya reversal ke signals provide karta hai. Is pattern mein price movement ki upward ya downward trend ke beech mein trading range ban jata hai. Jab trading range narrowing hota hai, to ye pattern form hone lagta hai. Is pattern mein traders ko price ki high aur low levels ke beech mein consolidation ka pattern dikhata hai. Is pattern mein trading range ko triangle shape mein dikhaya jata hai. Types of Triangle Consolidation Pattern: Triangle Consolidation Pattern ke 3 different types hote hain: a. Symmetrical Triangle: Symmetrical triangle mein price high aur low levels ke beech mein gradually lower high aur higher low banata hai. Is pattern mein traders ko price ka continuation ya reversal signal milta hai. b. Ascending Triangle: Ascending triangle pattern mein price range ki high levels steadily increase hoti hain, jabki low levels remain stable rehte hain. Is pattern mein traders ko price ke breakout ke signals milte hain. c. Descending Triangle: Descending triangle pattern mein price range ki low levels steadily decrease hoti hain, jabki high levels remain stable rehte hain. Is pattern mein traders ko price ke breakout ke signals milte hain. Benefits of Triangle Consolidation Pattern: Triangle Consolidation Pattern traders ko market trend aur price action ke bare mein useful information provide karta hai. Is pattern se traders ko price ka continuation ya reversal signal milta hai. Is pattern se traders ko entry aur exit points ke decisions lene mein help milti hai. Traders ko is pattern ki madad se trading strategies develop karne mein bhi help milti hai. Drawbacks of Triangle Consolidation Pattern: Triangle Consolidation Pattern ke drawbacks mein false signals aur inaccurate analysis shamil hai. Is pattern ko correctly identify karna challenging ho sakta hai aur false signals generate ho sakte hain. Traders ko is pattern ko use karne se pehle market ki overall condition aur other indicators ka bhi analysis karna chahiye. Conclusion: Triangle Consolidation Pattern forex market mein trend ki continuation ya reversal ke signals provide karta hai. Is pattern se traders ko market ki overall condition aur price action ke bare mein useful information provide hoti hai. Traders ko is pattern ko use karne se pehle market ki overall condition aur other indicators ka bhi analysis karna chahiye. Triangle Consolidation Pattern ke benefits aur drawbacks ko samajh kar traders ko iska sahi use karna chahiye. -
Umair07Member
- Feb 2023
- 60
- 309
- 33
- 31 USD
tryangle mix pattren kya hConsolidation Example is a typical graph design in the forex market that can be distinguished through specialized examination. Moreover, cost activity examples can be recognized through cost development and might be utilized to foresee future cost developments. Is the cost design one of better upsides or worse low points that has been uniting when a symmetrical triangle has been framed? Rising triangle, sliding triangle, even triangle, and other triangle designs are instances of solidification designs that dealers use to foresee future cost development. Is design mein by and large cost triangle ke bhar ya uske upper ya lower trendline se breakout karte hain? Frequently, a huge flood at the cost of a breakout gives brokers exchanging chances.Triangle Combination design specialized examination mein ek continuation design hai, jo pattern course ko affirm karta hai. Is design ko cost graph standard triangle ke shape mein structure sharpen ke premise standard perceive kiya jata hai. Triangle Union example ko do types mein partition kiya jata hai: Climbing Triangle: Poke cost outline mein more promising low points aur same obstruction level sharpen lage, to yeh rising triangle design structure karta hai.Diving Triangle: Hit cost diagram mein worse high points aur same help level sharpen lage, to yeh sliding triangle design structure karta hai. In dono designs mein cost activity triangle ke andar move karta hai aur ek point standard breakout karta hai, jisse pattern course affirm hota hai. Triangle Combination design ko distinguish karne ke baad brokers, breakout ke bearing ke hisab se exchanging positions le sakte hain. Is design ka use karne se pehle dealers ko iske chances aur restrictions ko bhi samajhna zaruri hai. Iske alawa, dealers ko Triangle Union example ko sahi tarah se perceive karna aur sahi passage aur leave focuses tay karna bhi zaruri hota hai. RECOGNIZATION : Triangle Solidification design ko cost graph standard perceive karne ke liye dealers ko observing advances follow karne hote hain: Cost pattern ko recognize karein: Brokers ko pehle cost pattern ko distinguish karna hota hai, kyunki Triangle Combination design pattern continuation design hai. Triangle shape ko search karein: Dealers ko triangle shape search karna hota hai, jo cost diagram mein structure ho raha hai. Is design mein cost activity triangle ke andar move karta hai aur triangle ke dono sides standard cost levels meet hote hain. Support aur Obstruction levels ko notice karein: Merchants ko design ke arrangement ke sath support aur opposition levels ko bhi notice karna hota hai. Ascendi Triangle solidification design brokers' capacity to give expected signs to drift continuation or inversion notwithstanding the shortfall of a pointer and the way that other specialized markers or cost activity examples can be utilized to affirm a pattern. Legitimate gamble the executives and successful exchanging methodologies are given by brokers who follow specific examples. In the event that an individual purposes a viable exchanging strategy, is design ke uncovered mein zaroori hai ki aap acche sy research karein or master counsel lein
 Forex market essential Triangle Hardening Model aik outline plan hai jo specific assessment mein istmal kiya jata hai Ye aik cost movement plan hota hai jis mein cost ki improvement ko triangle k andar ya us ke aas paas dekha jata hai Is plan mein cost better potential gains or more regrettable depressed spots ke bech mein join hoti hai jisse ek triangle jaise shape banta hai Triangel mix plan kayi trah ke ho sakte hain, jaise rising triangle diving triangle adjusted triangle, etc in plans ko diagram standard dekh kar shippers cost ki further advancement ko expect karne ki koshish karte hain Is plan mein typically cost triangle ke bhar ya uske upper ya lower trendline se breakout karte hain Breakout ke baad cost generally solid areas for ek show karti hai jisse vendors ko trading astonishing entryways miltey hain Triangle association model representatives ko cost ki bearing example continuation ya reversal ke potential signs give kar sakta hai lekin ye aik marker nahi hota hai aur isko dusre particular contraptions or cost action plans k saath certify karna zaroori hota hai. Isliye vendors ko is plan ko samajhna or istmal karna zaroori hota hai sath hey proper bet the chiefs k sath trading karna chahiye Is plan ke uncovered mein zaroori hai ki aap acche sy study The best strategy to use Triangle pattren in assessment Forex market head Triangle assessment karne k liye aapko kuch steps follow karne honge. Yeh assessment aapko market ke cost improvements aur design ko samajhne mein madad karegi. Neeche diye gaye hai kuch steps triangle examination karne ke liye:1.Trend Unmistakable evidence: Sabse pehle aapko most recent thing ko recognize karna hoga. Design ko samajhne ke liye aap cost chart ko dekh sakte hain aur design lines ka istemal karke rise, downtrend ya sideways design ko recognize kar sakte hain.2.Triangle Model Affirmation: Triangle plan ko see karna hoga. Triangle plan hota hai jab cost chart mein better potential gains aur more awful depressed spots ke beech mein cost join hoti hai aur ek triangle shape banti hai. Is plan ko see karne ke liye aapko cost frame ko dekhna hoga aur design lines ko draw karke triangle shape ko perceive karna hoga.3.Breakout Assertion: Triangle plan mein cost blend ke baad ek breakout hota hai, jahan cost upper ya lower design line ko cross karti hai. Aapko breakout insist karna hoga, jaise hey breakout ho, woh course design blacklist jati hai.4.Stop Mishap Circumstance: Stop adversity ek zaroori risk the chiefs gadget hai. Triangle plan mein breakout ke heading mein stop incident lagana zaroori hota hai, taaki aap apne trading position ko shield kar sakein, agar cost converse bearing mein chale jaye.5.Target Setting: Triangle plan mein aapko target set karna hoga, yani ki expected cost advancement ke liye ek target level pick karna hoga, jahan aap apna trade close kar sakte hain aur benefit book kar saktey hain6.Risk-Prize Extent: Chance honor extent ko bhi dhyan mein rakhna zaroori hai. Triangle plan mein aapko apne risk-reward extent ko supervise karna hoga, yani ki kitna risk aap le rahe hain stood out from kitna reward aap expect kar rahe hainnoteYeh the kuch basic advances triangle examination karne ke liye forex market mein. Aapko market ke current conditions aur apne trading method ke hisab se apne examination ko adjust karna hoga. Forex trading mein risk hota hai, isliye aapko apne risk opposition aur trading plan ko samajh kar trading karna chahiye. Aapko ek experienced trader ya financial instructor ki madad leni chahiye, agar aapko trading ke baare mein samajhne mein mushkilat hain Benefits : Triangle cementing plan ek particular examination mechanical assembly hai, jismein cost movement ko study karke future expense advancements ko expect kiya jata hai. Yeh plan ek triangle ki shape mein hota hai, jismein cost swings high and low karte hain, lekin cost range, taking everything into account, mein mix dikhta hai.Is plan ke kuch faide hai, jo specialty diye gaye hain:Cost design ka bearing: Triangle hardening plan ko dekh kar aap cost ka heading anticipate kar sakte hain. Agar triangle up defying hai toh yeh bullish example ka signal hai aur plunging going up against hai toh negative example ka signal hai.Passage and leave centers: Yeh plan aapko area and leave centers bhi give kar sakta hai. Agar cost vertical example mein hai aur triangle plan ko breakout karta hai toh aap buy kar sakte hain. Aur agar cost diving design mein hai aur triangle plan ko breakout karta hai toh aap sell kar sakte hain.Stop hardship course of action: Triangle blend plan aapko stop mishap ka position bhi suggest kar sakta hai. Agar aap long position mein hain aur cost breakout ke baad triangle plan ko break karta hai, toh aap apna stop mishap triangle ke neeche rakh sakte hain.Yeh faide triangle association model ke hain, lekin specific examination instruments ka istemal karne se pehle hamesha How to utilize Triangle pattren in investigation Primary Triangle examination in the forex market is trailed by various advances. Market value changes and pattern examination are remembered for this sentence. Bit by bit triangle examination is what we do here, so: 1.Trend ID: Kindly let us in on what the latest thing is. Cost graphs are utilized to recognize patterns, and pattern lines are utilized to decide whether an upswing, downtrend, or sideways pattern is available. 2. Perceiving Triangle Examples: Triangle designs are perceived. At the point when the value graph's better upsides and worse low points are available, the value will in general merge, and an ek triangle design is available. Is there an example that can be perceived? Provided that this is true, a value graph and pattern lines might be drawn, and a triangle's shape can be perceived. 3. Affirmation of the Breakout: Triangle design mein cost solidification ke awful ek breakout hota hai, jahan cost upper ya lower pattern line ko cross karti hai. At the point when a breakout happens, it is affirmed, and the course of the pattern changes. 4.Stop Misfortune Situation: Stop misfortune is a critical part of hazard the board. On the off chance that the cost moves the other way to the breakout course from the triangle example's stop misfortune, the exchanging position ought to be safeguarded. 5. Laying out of Targets: Triangle design mein aapko target set karna hoga, yani ki projected cost development ke liye ek target level decide karna hoga, jahan aap apna exchange close kar sakte hain aur benefit book kar saktey hain 6.Risk to Reward Proportion: Hazard to compensate proportion ko bhi dhyan mein rakhna zaroori hai. Triangle design mein aapko apne risk-reward proportion ko oversee karenge, yani ki kitna risk aap le rahe hain contrasted with kitna reward aap expect karenge research aur risk the board ko samajhna zaroori hai.
-
<a href="https://www.instaforex.org/ru/?x=ruforum">InstaForex</a> -
BLACKADAM2022Senior Member
- Dec 2022
- 137
- 154
- 64
- 128 USD
Details of triangular consolidation pattern AOA BROTHERS Is pattern me price higher highs or lower lows ke bech mein consolidate hoti hai jisse ek triangle jaise shape banta hai Triangel consolidation pattern kayi trah ke ho sakte hain, jaise ascending triangle descending triangle symmetrical a hai ki aap a Triangle design mein aapko apne risk-reward proportion ko oversee karna hoga, yani ki kitna risk aap le rahe hain contrasted with kitna reward aap expect kar rahe hainnoteYeh the kuch fundamental advances triangle investigation karne ke liye forex market mein. Aapko market ke current circumstances aur apne exchanging cche sy research karein or expert counsel leink reward ratio thik nahi hai, to wo trade avoid kar sakte hain.Iske alawa, traders ko Triangle Consolidation pattern ke risks aur limitations ko bhi samajhna hota hai. Traders ko pattern formation ko sahi tarah se recognize karna aur sahi entry aur exit ur samjhna zaroori hota hai takay unko market movement aur trend ke bare strategies ke bare mein. Trading mein hamesha apne risk tolerance aur financial situation ko samjhein aur apne trades ko samngle etc in patterns ko chart par dekh kar traders price ki further movement ko predict karne ki koshish karte hain Is pattern mein typically price triangle ke bhar ya uske upper ya lower trendline se breakout karte hain Breakout ke baad price usually ek strong move show karti hai jisse traders ko trading opportunities miltey hain Triangle consolidation pattern traders ko price ki direction trend continuation ya reversal ke potential signals provide kar sakta haiMethods to understand these pattern Is ko samjhny me hme sb se pehly triangle bana hog a wo triangle ke shape mein form hone ke basis par recognize kiya jata hai. Pattern do types ke ko apni trades mein risk aur reward ka balance rakhna hota hai. Agar traders ko lagta hai ki ris triangle, descending triangle, symmetrical triangle, and other triangle patterns are examples of consolidation p triarket iye forex market mein. Aapko market ke current conditions aur apne trading strategy ke hisab se apne analysis ko customize karna hoga. Forex trading mein risk hota hai, isliye aapko apne risk tolerance aur trading plan ko samajh kar trading karna chahiye. Aapko ek experienced trader ya financial advisor ki madad leni chahiye, agar aapko trading ke bmein dekhe jate hain. Forex traders ko in patterns ko samajhna atterns that traders use to predict future price movement. Is pattern mein generally price triangle ke bhar ya uske upper ya lower trendline se breakout karte hain? Often, a large surge at the p mein behtar samjh ho aur unko trading decisions lene mein madad mile. Har ek pattern apne tajurbe aur samay ke mutabiq hota hai, isliye traders ko apne tajurbe aur technical analysis ke sath in patterns ko samajhna chahiye. Yeh important hai ke traders proper risk management ke sath trading karen aur ek professional financial advisor ya trader se mashwara ke direction ke hisab se trading positions le sakte hain. Identification and its working Is ko identification krne me hmme bhot se log ye sa aap apne exchanging position ko safeguard kar sakein, agar cost inverse bearing mein target set karna hoga, yani ki expected cost development ke liye ek ta Often, a large surge at the price of a breakout presents traders with trading chances. Triangle consolidation a trend. Proper risk management and effective trad len, khaas karke forex market ki samajh aur trading rice of a breakout presents traders with trading chances. Triangle consolidation a trend. Proper risk management and effective trading strategies are provided by traders who follow certain patterns. If a person uses an effective trading technique, is pattern ke bare mein zaroori points tayhote hain: ascending triangle aur descending triangle. Traders is pattern ko use karke breakout ing strategies are provided by traders who follow certain patterns. If a person uses an effective trading technique, is pattern ke bare mein zaroori hai rget level choose karna hoga, jahan aap apna exchange close kar sakte hain aur benefit book kar saktey hain6.Risk-Prize Proportion: Chance award proportion ko bhi dhyan mein rakhna zaroori hai. technique ke hisab se apne investigation ko alter karna hoga. Forex exchanging mein risk hota he


اب آن لائن
Working...
تبصرہ
Расширенный режим Обычный режим