Peak and Through Analysis
-
ZeeshanshakoorMember

- Jan 2023
- 57
- 2
- 1
- 39 USD
-
<a href="https://www.instaforex.org/ru/?x=ruforum">InstaForex</a> -
ZeeshanshakoorMember
- Jan 2023
- 57
- 2
- 1
- 39 USD
Peak and Through patterns Hain Jo Kay tamam securities main price action se bantay Hain.Jesa Kay hum jantay Hain prices hamesha straight line main move nai krtien dono uptrend aur downtrend main movement hoti hay.Zig Zag Pattern ko Peak and through explain Kay liay use kia jata hay aur bohat se softwares charting main zig zag indicator dia jata hay jis per investors trade krtay huay relay kr saktay Hain. Key Takeaways of Peak and through Peaks and through pattern hain Jo Kay tamam securities main price action. Se bantay Hain. Trend line broke hui ya nai is ko chack krne ka sb se asan tarika hay breakdown ko witness krna aur phir rising or falling peaks and troughs se replace krna. Peaks and through ki study main hum ko consolidation se aware Hona chahiye jis se sideways movement ko recognize kia ja skta ho aur is mistake ko avoid kia ja sakay Kay trend reverse honay ja Raha hay. Ups and Downs of Peaks and Through Chart per rising peaks and through ko easily recognize kia ja sakta hay jis ko higher peaks tops higher through bottoms se uptrend create krtay huay recognize kia jata hay.Iskanaik aur tarika ye hay Kay new peak Jo price actions se create ho previous Kuch din ki peak se higher ho aur is Kay sath sath new through bi previous through se higher end per ho. Breaking Trend in Peaks and Through Trend line broke hui ya nai isko dakhne ka sb se asan way breakdown ko dakhna aur phir rising and falling Peaks and Through ki replacement hay.Jo Kay technical indicators ki importance dikhata hay jis se Kuch technician agree nai krien gay.Invester ka confidence aur optimistic future view regarding specific issue or securities price ko upward move main help krta hay aur isi Tarah lack of confidence isko negate aur Downtrend prevail krta hay. Traders ko Peak and through pattern main consolidation ko dakhna chahiye ta Kay sideways movement pattern ko identify krna asan ho.Aur prevail trend reserve consider krne jesi mistake na ho.Consolidation ka general rule hay Kay previous trend kay time frame ka 33 to 66 percent lay ga lakin is sb Kay sath sath sb se important hay investors ki common sense aur dosray technical indicator per relay krna. Price action rallies aur subsequent reactions se banta hay.Isi Tarah rising peaks and through ka time frame determine krna trend ki strength ko dikhata hay aur overall traders Kay confidence ya lack of confidence ko dikhata hay.Aur overall trend reversal market confidence per depend krta hay. -
Realone98Senior Member
- Nov 2022
- 3124
- 34
- 247
- 1 607 USD
Assalamu Alaikum Dosto!
Forex Trading Analysis
Forex trading me analysis market ki chaan beeh karne k baad uss k trend ki future ki movement ki predictions karta hai. Analysis forex trading market me risk ko kam karne aur trading me munafa hasil karne k leye istemal kia jata hai. Forex trading me teen types k analysis hoti hen, jin ko technical analysis, fundamental analysis aur sentimental analysis kaha jata hai. Technical analysis se traders trend direction (bullish ya bearish) aur trend strength ko identify kar sakte hain. Isse unko pata chalta hai ki kya market mein upar ya neeche ki taraf trend hai aur kitni taaqat hai. Fundamental analysis se traders ko pata chalta hai ki ek desh ki economic conditions kya hai. Wo economic indicators ke basis par desh ki GDP growth, inflation rate, employment rate, aur interest rates ke baare mein samajh pate hain. Sentimental analysis se traders ko pata chalta hai ki market sentiment bullish (khareedaari ki taraf) hai ya bearish (bechne ki taraf). Isse unko market behavior aur trend direction ka idea milta hai.
Technical Analysis
Technical analysis market data ko study karke future price movements ka anuman lagane ki technique hai. Is analysis mein traders historical price charts, market indicators aur mathematical calculations ka istemal karte hain. Ye analysis technique ye samjhne ki koshish karti hai ki past price patterns aur market behavior ke basis par future price trends ko predict kiya ja sake.
Technical analysis ke kuch mukhya tareeqe hain:
- Candlestick Patterns: Candlestick patterns charts par diye gaye candlesticks (mombatiyon) ke shapes aur combinations ko study karne ka technique hai. Isme bullish (khareedaari ki taraf) aur bearish (bechne ki taraf) patterns hote hain jo price reversals aur trend directions ke signals dete hain.
- Technical Indicators: Technical indicators price aur volume data ko analyze karte hain. Ye traders ko overbought (bahut zyada kharidari) ya oversold (bahut zyada bechne) levels ko detect karne mein madad karte hain. Kuch popular technical indicators hain Moving Averages, Relative Strength Index (RSI), aur Bollinger Bands.
- Support aur Resistance Levels: Support aur resistance levels specific price points hote hain jahan market ka trend reverses ho sakta hai. Support level neeche ki taraf se buying interest dikhata hai, jabki resistance level upar ki taraf se selling pressure dikhata hai. In levels ka istemal traders trend reversals aur price levels ke liye karte hain.
Fundamental Analysis
Fundamental analysis economic factors, company news aur market sentiment par tawajjo deti hai. Is analysis mein traders countries ke economic indicators, monetary policies, GDP, employment data, aur interest rates ki study karte hain. Ye factors currency prices aur market trends par asar daalte hain.
Fundamental analysis ke kuch mukhya tareeqe hain:
- Economic Indicators: Economic indicators macroeconomic data hai jaise ki GDP growth, inflation rate, employment rate, aur interest rates. In indicators ke changes currency prices par asar daalte hain. Traders in indicators ki tafsili study karte hain taki unko currency pairs ke movements ka pata chal sake.
- News aur Events: Market mein ho rahe current events, news, aur announcements currency prices ko influence karte hain. Traders economic calendars aur news sources ka istemal karte hain taki wo upcoming events par tawajjo de sake. Unko pata chalta hai ki koi badi khabar hone wali hai jisse currency prices affected ho sakti hain.
Sentimental Analysis
Sentimental analysis market sentiment aur trader's psychology par tawajjo deti hai. Ye analysis technique ye samjhne ki koshish karti hai ki traders market mein kya feel kar rahe hain. Sentimental analysis mein social media platforms, surveys aur market indicators ka istemal kiya jata hai.
Sentimental analysis ke kuch mukhya tareeqe hain:
- Sentiment Indicators: Sentiment indicators market sentiment aur trader's behavior ke indicators hote hain. In indicators ka istemal traders market ki bullish (khareedaari ki taraf) ya bearish (bechne ki taraf) sentiment ko samajhne mein karte hain. Kuch popular sentiment indicators hain put/call ratios aur volatility indexes.
- Social Media Analysis: Social media platforms par traders apne opinions aur trading ideas share karte hain. Sentimental analysis mein social media platforms ka istemal kiya jata hai taki traders ko market sentiment aur news ka pata chal sake. Isse traders sentiment analysis karke trading decisions lete hain.
In teeno analysis techniques ka istemal karke traders forex market ko analyze karte hain aur trading decisions lete hain. Ye techniques traders ko market trends, price movements aur potential trading opportunities ke baare mein behtar samajhne mein madad deti hain. Traders ke liye ye zaroori hai ki wo in techniques par kaam karte waqt thorough research aur study karein aur apne trading skills ko develop karein.
Trading Analysis Psychology
Trading psychology ka matlab hai trader ki emotions aur mental state jo trading securities mein success ya failure ko dictate karta hai. Trading psychology mein trader ki character aur behavior ke various aspects shamil hote hain jo unke trading actions ko influence karte hain. Trading psychology knowledge, experience aur skill ke sath trading success ko determine karne mein important role play karta hai. Trading psychology mein discipline aur risk-taking do critical aspects hote hain, kyunki trader ke implementation of these aspects unke trading plan ke success ke liye critical hota hai. Fear aur greed commonly associated with trading psychology hote hain, jabki hope aur regret bhi trading behavior mein roles play karte hain.
Trading psychology ko samajhne ke liye traders ko apne emotions aur mental state ko control karna zaroori hai. Traders ko apne emotions aur mental state ko control karne ke liye discipline aur risk-taking ko implement karna zaroori hai. Traders ko apne emotions aur mental state ko control karne ke liye unhe snap decisions nahi leni chahiye aur unhe apne trading rules ko follow karna chahiye. Traders ko apne emotions aur mental state ko control karne ke liye unhe apne risk-reward tolerance ke hisab se guidelines set karni chahiye aur unhe profit target aur stop loss ko implement karna chahiye. Trading psychology ko master karne ke liye traders ko apne emotions ko control karna aur apne discipline aur risk-taking ko implement karna zaroori hai.
Emotions aur Trading Psychology
Emotions aur Trading Psychology ke beech mein gehra taaluk hai. Trading ek stressful aur unpredictable activity hai jismein emotions ka khel khela jaata hai. Jab traders apne positions ko monitor karte hain aur market movements ke saath deal karte hain, tab unki emotions jaise greed, fear, aur excitement unke trading decisions par asar andaz karte hain. Greed unko zyada profit kamane ki aagya deta hai, fear unko losses se bachne ke liye impulsive decisions lene ka pressure dalta hai, aur excitement unko overconfidence mein le jaata hai. Ek successful trader ko apni emotions ko samajhna, control karna aur unka impact samajhna zaroori hai. Sahi mindset aur emotional stability ke saath, woh apne trading strategy par focused reh sakte hain aur disciplined trading decisions le sakte hain.
Risk Management aur Trading Psychology
Risk Management aur Trading Psychology dono trading ke mukhtalif pehluon par prabhav dalte hain. Ek trader ka mindset aur emotional state uske risk management decisions par asar karta hai. Ek accha risk management plan banane ke liye sahi trading psychology zaroori hai. Ek trader ko apne risk appetite ko samajhna, apne positions ko manage karne, losses ko handle karne aur long-term success ko achieve karne ke liye trading psychology ke saath sahi risk management decisions lena zaroori hai. Yeh sahi mindset aur psychological stability aapko market volatility, unpredictable events, aur trading challenges ke samay bhi focused aur determined rahne mein madad karta hai.
Discipline aur Trading Psychology
Discipline ek crucial element hai jo trading psychology par asar dalta hai. Discipline aapko apne predefined trading plan aur rules ko follow karne mein madad karta hai. Jab traders discipline maintain karte hain, tab woh apne emotions ko control karke apne trading strategy par focused rehte hain. Impulsive decisions se bachna, strict risk management guidelines ko follow karna, aur apne trading rules ko maintain karna discipline ke basic steps me aata hai. Discipline ki kami trading performance par asar hota hai, isliye sahi trading mindset aur discipline ki zaroorat hoti hai.
Confidence aur Trading Psychology
Confidence trading psychology ka ek mahatvapurna hissa hai. Ek confident trader apne skills, knowledge, aur trading strategy par vishwas rakhta hai. Woh apne analysis aur research par bharosa karta hai. Confidence aapko market volatility aur challenges ke samay bhi focused aur determined rahne mein madad karta hai. Confidence ki kami aapke trading performance par asar daal sakti hai, isliye trading psychology ko develop karte waqt confidence ko dhyan mein rakhna zaroori hai. Confidence ko badhane ke liye sahi trading education, practice, aur consistent success ke saath aata hai.
Learning aur Growth Mindset
Learning aur Growth Mindset trading psychology ke liye mahatvapurna hai. Ek successful trader hamesha seekhne aur badhne ki pravratti rakhta hai. Woh apne trading mistakes se seekhta hai aur apne trading skills ko improve karta hai. Learning mindset aapko apne trading journey mein improvements karne aur apne knowledge aur skills ko enhance karne mein madad karta hai. Growth mindset aapko challenges se nipatne, perseverance ko maintain karne, aur consistent growth achieve karne mein sahayata karta hai. Ek trader ko apne learning mindset ko develop karna aur apne trading journey mein hamesha seekhne ke liye tayyar rehna zaroori hai.
-
adnan33Junior Member
- May 2024
- 11
- 1
- 3
Peak and Trough Analysis: Forex Trading Mein Istemal Aur Tafseel
Forex trading mein "peak" aur "trough" analysis ek ahem technical analysis technique hai jo traders ko market trends aur reversals ko identify karne mein madad karta hai. Is article mein, hum peak aur trough analysis ke baray mein tafseel se baat karenge aur iska forex trading mein istemal samjhein ge.
Peak Aur Trough Kya Hote Hain?- Peak: Peak market mein wo point hota hai jab price ek uptrend ke dauran maximum level ko touch karta hai aur phir girne lagta hai.
- Trough: Trough market mein wo point hota hai jab price ek downtrend ke dauran minimum level tak gir jata hai aur phir se uthne lagta hai.
Peak Aur Trough Analysis Ka Istemal- Trend Identification: Peak aur trough analysis ka istemal karke traders market trends ko identify karte hain. Jab price ek series of higher peaks aur higher troughs banata hai, toh yeh uptrend ko indicate karta hai. Jab price ek series of lower peaks aur lower troughs banata hai, toh yeh downtrend ko indicate karta hai.
- Reversal Points: Peak aur trough analysis se traders potential trend reversals ko bhi identify kar sakte hain. Jab price ek peak ya trough ko break karta hai aur opposite direction mein move karta hai, toh yeh reversal signal provide karta hai.
Peak Aur Trough Analysis Ke Tools- Price Charts: Traders price charts ka istemal karte hain peak aur trough identify karne ke liye. Line charts, bar charts, aur candlestick charts sabhi peak aur trough analysis ke liye istemal kiye ja sakte hain.
- Technical Indicators: Kuch traders technical indicators jaise ke moving averages, MACD, aur RSI ka istemal bhi karte hain peak aur trough analysis mein.
Conclusion
Peak aur trough analysis forex trading mein ek valuable technique hai jo traders ko market trends aur reversals ko samajhne mein madad karta hai. Lekin, yaad rahe ke har ek analysis technique ke saath risk management ka hona zaroori hai aur traders ko apni analysis par bharosa rakhna chahiye.
-
SkydiversSenior Member
- Mar 2023
- 1445
- 239
- 371
- 608 USD
Peak and Trough Analysis trading aur investing mein aik fundamental technique hai jo market ke price movements ko samajhne aur analyze karne mein madad deti hai. Yeh technique traders aur investors ko market ke high (peaks) aur low (troughs) points ko identify karne mein help karti hai, jisse woh market ke trends, reversals, aur potential entry aur exit points ko behtar tareeke se samajh sakte hain. Peak and Trough Analysis ke zariye, traders market ke cyclical patterns ko dekhte hain aur unhe predict karte hain ke market kis direction mein move karne wala hai.
Peak aur Trough terms market ke price movements ko describe karte hain. Yeh terms un specific points ko refer karte hain jahan market apni direction change karta hai.- Peak: Peak woh point hota hai jahan price apni maximum level par pohanch kar reversal karta hai aur downward move karna shuru karta hai. Yeh market ka highest point hota hai, jahan se price decline karna shuru karta hai. Peaks aksar resistance levels ke aspaas bante hain.
- Trough: Trough woh point hota hai jahan price apni lowest level par pohanch kar reversal karta hai aur upward move karna shuru karta hai. Yeh market ka lowest point hota hai, jahan se price recovery karna shuru karta hai. Troughs aksar support levels ke aspaas bante hain.
Peak aur Trough Analysis ka Basic Concept
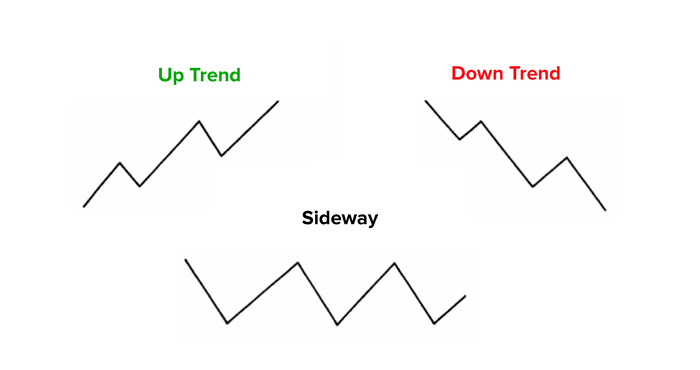
Peak aur Trough Analysis ka basic concept yeh hai ke market cyclical nature ka hota hai, jisme price upward aur downward moves karta hai. Market kabhi bhi seedhi line mein move nahi karta, balki yeh ek wave-like pattern mein move karta hai jahan price peaks aur troughs banata hai. Yeh cyclical pattern market ke demand aur supply forces ka natija hota hai.- Uptrend: Uptrend tab hota hai jab market continuously higher peaks aur higher troughs banata hai. Iska matlab yeh hota hai ke har new peak pichle peak se upar hota hai, aur har new trough pichle trough se upar hota hai. Uptrend ke dauran, bulls (buyers) market mein dominant hotay hain.
- Downtrend: Downtrend tab hota hai jab market continuously lower peaks aur lower troughs banata hai. Iska matlab yeh hota hai ke har new peak pichle peak se neechay hota hai, aur har new trough pichle trough se neechay hota hai. Downtrend ke dauran, bears (sellers) market mein dominant hotay hain.
- Sideways Trend: Sideways trend tab hota hai jab market ke peaks aur troughs horizontally move karte hain, yani na toh higher hote hain aur na hi lower. Iska matlab yeh hota hai ke market ek range-bound condition mein hai jahan price ek specific range ke andar move kar raha hota hai.
Peak aur Trough Analysis trading aur investing mein bohot important role play karta hai. Is analysis ke zariye, traders aur investors market ke long-term aur short-term trends ko samajhne mein madad hasil karte hain. Yeh analysis unhein sahi entry aur exit points detect karne mein help karta hai, jisse unki profitability enhance hoti hai.- Trend Identification: Peak aur Trough Analysis ke zariye traders market ke trend ko accurately identify kar sakte hain. Yeh analysis unhein yeh samajhne mein madad deta hai ke market uptrend mein hai, downtrend mein hai, ya sideways trend mein move kar raha hai.
- Reversal Points ka Identification: Peaks aur troughs ko identify karke traders market ke potential reversal points ko predict kar sakte hain. For example, agar market ne aik significant peak banaya hai aur phir decline karna shuru kiya hai, toh yeh bearish reversal ka signal ho sakta hai. Isi tarah, agar market ne aik trough banaya hai aur phir upward move karna shuru kiya hai, toh yeh bullish reversal ka signal ho sakta hai.
- Support aur Resistance Levels ka Detection: Peak aur Trough Analysis ke zariye traders support aur resistance levels ko bhi accurately detect kar sakte hain. Peaks aksar resistance levels ke aspaas bante hain, jabke troughs support levels ke aspaas bante hain. In levels ka analysis karna traders ko apni trading strategies ko behtar banane mein madadgar hota hai.
- Entry aur Exit Points: Peak aur Trough Analysis ke zariye traders apne trades ke liye sahi entry aur exit points detect kar sakte hain. For example, agar market ne aik trough banaya hai aur upward move kar raha hai, toh yeh trade mein enter karne ka acha waqt ho sakta hai. Isi tarah, agar market ne aik peak banaya hai aur downward move kar raha hai, toh yeh trade exit karne ka acha waqt ho sakta hai.
Peak aur Trough Analysis karte waqt kuch important factors ko dhyan mein rakhna zaruri hai. Yeh factors aapki analysis ki accuracy ko enhance karte hain aur aapko better trading decisions lene mein madadgar hote hain.
1. Timeframe
Peak aur Trough Analysis karte waqt timeframe ka selection bohot important hota hai. Market ke different timeframes par different peaks aur troughs form hote hain. Agar aap short-term trading kar rahe hain, toh aapko lower timeframes (jaise ke 1-hour ya 4-hour charts) par focus karna chahiye. Agar aap long-term investing ya swing trading kar rahe hain, toh aapko higher timeframes (jaise ke daily ya weekly charts) par focus karna chahiye.
2. Trend Strength
Trend strength ko analyze karna Peak aur Trough Analysis mein bohot zaruri hota hai. Agar trend bohot strong hai, toh market mein multiple small peaks aur troughs form ho sakte hain, lekin overall trend intact rahega. Isliye, aapko trend strength ko accurately assess karna chahiye aur false signals ko avoid karna chahiye.
3. Market Conditions
Market conditions ko samajhna Peak aur Trough Analysis mein crucial hota hai. Agar market volatile hai, toh peaks aur troughs ka formation jaldi ho sakta hai, lekin agar market stable hai, toh inka formation time le sakta hai. Volatile markets mein false signals zyada generate ho sakte hain, isliye market conditions ko dekh kar analysis karna chahiye.
4. Use of Other Indicators
Peak aur Trough Analysis ko doosre technical indicators ke saath combine karna accuracy ko enhance kar sakta hai. Indicators jaise ke Moving Averages, RSI (Relative Strength Index), aur MACD (Moving Average Convergence Divergence) ke saath Peak aur Trough Analysis ko use karke aap apni trading strategy ko aur bhi zyada effective bana sakte hain.
Peak aur Trough Analysis ke Techniques
Peak aur Trough Analysis ke zariye market ke trends aur reversal points ko identify karne ke liye kuch techniques aur tools use kiye jate hain. Yeh techniques aapki analysis ko structured aur systematic banati hain.
1. Dow Theory
Dow Theory aik classical technical analysis theory hai jo market ke trends aur patterns ko analyze karne mein madadgar hoti hai. Dow Theory ke mutabiq, market teen phases mein move karta hai: accumulation phase, public participation phase, aur distribution phase. Dow Theory ke principles ko use karte hue aap Peak aur Trough Analysis kar sakte hain. Is theory ke mutabiq, uptrend mein market higher highs aur higher lows banata hai, jabke downtrend mein market lower highs aur lower lows banata hai.
2. Trendlines
Trendlines draw karna Peak aur Trough Analysis mein aik useful technique hai. Aap price chart par peaks aur troughs ko connect karte hue trendlines draw kar sakte hain. Uptrend ke dauran, aap troughs ko connect karte hue ek upward sloping trendline draw karte hain. Downtrend ke dauran, aap peaks ko connect karte hue ek downward sloping trendline draw karte hain. Trendlines ka break hona market mein potential trend reversal ka signal hota hai.
3. Fibonacci Retracement
Fibonacci Retracement aik aur powerful tool hai jo Peak aur Trough Analysis mein use hota hai. Yeh tool different Fibonacci levels ko highlight karta hai jo market ke potential support aur resistance levels ko represent karte hain. Aap market ke peak aur trough ke darmiyan Fibonacci retracement levels ko plot kar sakte hain aur dekh sakte hain ke market kahan se reverse kar sakta hai.
4. Support aur Resistance Levels
Support aur resistance levels ka analysis Peak aur Trough Analysis mein bohot important hota hai. Peaks aksar resistance levels ke qareeb form hote hain, jabke troughs support levels ke qareeb form hote hain. In levels ka analysis karna aapko sahi entry aur exit points detect karne mein madad deta hai.
Peak aur Trough Analysis ke Advantages aur Disadvantages
Har analysis technique ki tarah, Peak aur Trough Analysis ke bhi kuch advantages aur disadvantages hain. Inhe samajhna traders aur investors ke liye bohot zaruri hai taake woh apni trading strategy ko effectively plan kar sakein.
Advantages- Trend Identification: Peak aur Trough Analysis trend identification mein bohot effective hoti hai. Yeh technique aapko market ke major trends ko accurately identify karne mein madad deti hai.
- Reversal Detection: Is technique ke zariye aap market ke potential reversal points ko pehchaan sakte hain, jo aapki trading strategy ko enhance kar sakta hai.
- Support aur Resistance Levels ka Accurate Detection: Yeh technique support aur resistance levels ko accurately detect karne mein madadgar hoti hai, jisse aapke entry aur exit decisions behtar hote hain.
- Long-Term aur Short-Term Analysis: Peak aur Trough Analysis ko aap different timeframes par apply kar sakte hain, jo aapko long-term aur short-term market trends ko analyze karne mein madad deti hai.
- Lagging Nature: Peak aur Trough Analysis aik lagging technique hai, iska matlab yeh hai ke yeh market ke past price data par base karti hai. Isliye yeh future price movements ko predict karne mein thodi limited ho sakti hai.
- False Signals: Volatile markets mein yeh technique false signals generate kar sakti hai, jo aapke trading decisions ko affect kar sakte hain.
- Complexity: Beginners ke liye Peak aur Trough Analysis thoda complex ho sakta hai, kyun ke isme multiple factors ko consider karna hota hai jese ke timeframe, trend strength, aur market conditions.
Aik practical example le kar samajhne ki koshish karte hain ke Peak aur Trough Analysis kaise kaam karta hai. Suppose karein ke aap GBP/USD currency pair ka daily chart analyze kar rahe hain.- Market ne pehle aik strong uptrend show kiya jahan higher highs aur higher lows form ho rahe the. Har naya peak previous peak se upar tha, aur har naya trough previous trough se upar tha.
- Uske baad, market ne aik significant peak banaya aur downward move karna shuru kiya. Yeh decline uss waqt tak chalta raha jab tak market ne aik new trough form nahi kiya.
- Jab market ne yeh new trough banaya, toh uske baad price ne phir upward move karna shuru kiya, lekin yeh move pehle se weak tha. Yeh situation signal deti hai ke market trend reversal ke dauran hai aur ho sakta hai ke downtrend shuru ho jaye.
Is analysis ke zariye aap market ke cyclical patterns ko dekh sakte hain aur unhe samajh sakte hain ke market kis direction mein move karne wala hai. Lekin is technique ka use karte waqt aapko kuch important factors jaise ke timeframe, trend strength, aur market conditions ka dhyan rakhna chahiye.Peak aur Trough Analysis ko doosre technical indicators ke saath combine karna aapki analysis ki accuracy ko aur bhi zyada enhance kar sakta hai. Yeh technique long-term aur short-term trading ke liye useful hai, aur yeh aapko sahi entry aur exit points detect karne mein madad deti hai. Trading aur investing mein successful hone ke liye multiple tools aur techniques ka use zaruri hota hai, aur Peak aur Trough Analysis in tools mein se aik important tool hai jo aapki trading aur investing strategy ko solid bana sakta hai.
Believe in yourself and your abilities. When you fight for your dreams, you can achieve anything.
-
mabdulrehmanSenior Member
- Jul 2024
- 2506
- 24
- 45
- 460 USD
Peak and Through Analysis
Introduction Peak and Through Analysis aik technical analysis ka method hai jo trading mein market ke highs aur lows ko identify karne ke liye use hota hai. Yeh analysis traders ko market ke trend ke bare mein understanding provide karta hai, taake woh apne trading decisions ko behtar bana sakein.
Peak Kya Hota Hai? Peak, market ka woh point hota hai jab price apni highest value tak pohanchti hai aur uske baad wapas neeche girne lagti hai. Yeh point often ek resistance level ko indicate karta hai, jahan se price ka girna expected hota hai. Peak analysis se traders ko yeh samajh aata hai ke market mein price kitna upar jaa sakti hai aur kab reversal aasakta hai.
Through Kya Hota Hai? Through, market ka woh point hota hai jab price apni lowest value tak pohanchti hai aur uske baad wapas upar uthne lagti hai. Yeh point ek support level ko indicate karta hai, jahan se price ka barhna expected hota hai. Through analysis se traders ko yeh idea hota hai ke market mein price kitna neeche gir sakti hai aur kab rebound aasakta hai.
Importance of Peak and Through Analysis Peak and Through Analysis ki ahmiyat is liye hoti hai kyun ke yeh traders ko market ke overall trend ko samajhne mein madad deti hai. Is analysis ki madad se traders identify karte hain ke market bullish hai ya bearish, aur apne trading strategies ko accordingly adjust karte hain. Agar ek trader yeh analysis effectively use karta hai, toh woh market ke tops aur bottoms ko identify kar sakta hai, jo ke profitable trading ke liye zaroori hota hai.
How to Perform Peak and Through Analysis Peak and Through Analysis karne ke liye pehle aapko market ke price chart ko closely observe karna padta hai. Aapko yeh dekhna padta hai ke price kab apne highest point (peak) tak pohanchi hai aur kab apne lowest point (through) tak. Iske liye aap trend lines ka use kar sakte hain ya phir support aur resistance levels ko identify kar sakte hain. Jab aap peaks aur throughs ko identify kar lete hain, toh aap in points ke aas paas trading decisions le sakte hain.
Conclusion Peak and Through Analysis aik simple magar powerful tool hai jo traders ko market ke highs aur lows ko effectively identify karne mein madad deta hai. Is method ka sahi tarike se istemal karke, aap market ke trend ko samajh sakte hain aur apne trading decisions ko improve kar sakte hain. Yeh analysis beginners ke liye bhi useful hai, kyun ke is se unhein market ke behavior ko better understand karne ka mauqa milta hai.
-
Aliyar_0Senior Member
- Aug 2024
- 1060
- 24
- 15
- 212 USD
Peak aur Through Analysis ka Forex Trading mein Maqsood
Forex trading mein, Peak aur Through Analysis ek badi ahmiyat rakhta hai. Yeh analysis price action ka observation hai jahan par trader highs aur lows ko dekh kar market ke trends ko samajhta hai.
Peak aur Through kya hain?
Peak wo point hota hai jahan currency ki price temporary high pe pohanchti hai aur phir downward movement start karti hai. Through wo point hai jahan price apne lowest level pe hoti hai aur upward movement start hoti hai.
Trend Identification
Peak aur Through Analysis, trend ko identify karne mein help karta hai. Agar peaks aur throughs continuously upar ja rahe hon, toh yeh ek uptrend ki nishani hai. Iss ke bar-aks, agar yeh continuously neeche ja rahe hon, toh yeh downtrend ka indication hai.
Entry aur Exit Points
Yeh analysis traders ko entry aur exit points identify karne mein bhi madad deta hai. Jab price ek through se peak ki taraf jaati hai, toh yeh buying opportunity ho sakti hai. Aur jab price peak se through ki taraf jaati hai, toh yeh selling opportunity ho sakti hai.
Stop Loss aur Take Profit
Peak aur Through Analysis stop loss aur take profit levels set karne mein bhi madad karta hai. Traders apne stop loss ko through ke neeche set kar sakte hain aur take profit ko peak ke upar. Is tarah, risk management mein help milti hai.
Support aur Resistance Levels
Peak aur throughs, support aur resistance levels identify karne mein bhi help karte hain. Agar ek peak bar bar touch ho raha hai, toh yeh ek resistance level ban sakta hai. Isi tarah, agar through bar bar touch ho raha hai, toh yeh support level ban sakta hai.
Trend Reversals
Iss analysis ki help se, trend reversals bhi predict kiye ja sakte hain. Agar ek uptrend mein, peaks aur throughs lower ho rahe hain, toh yeh ek trend reversal ka indication hai. Isi tarah, downtrend mein agar peaks aur throughs higher ho rahe hain, toh yeh bhi trend reversal ka indication hai.
Trend Continuation
Agar peaks aur throughs ek consistent pattern follow kar rahe hon, toh yeh trend continuation ka indication hai. For example, agar uptrend mein peaks higher high aur throughs higher low bana rahe hain, toh yeh uptrend continuation ka indication hai.
Summary
Peak aur Through Analysis Forex trading mein badi ahmiyat rakhta hai. Isse trends ko identify karna, entry aur exit points define karna, aur risk management karna aasaan ho jata hai. Iss analysis ki madad se traders ko market ke movements ko samajhne aur apni trading strategies ko improve karne mein madad milti hai. Isliye, Forex traders ko yeh analysis seekhna aur apni trading mein istemal karna chahiye taake woh profitable trades kar sakein.
-
Rehan50Senior Member
- Mar 2024
- 1955
- 148
- 450
- 518 USD
Peak and Through Analysis: Ek Mukammal Rehnama
1. Taaruf
Peak aur Through Analysis ek aisi technique hai jo economic aur financial trends ko samajhne aur analyse karne ke liye use ki jati hai. Yeh analysis market cycles ko track karti hai aur investors ko future movements ki prediction mein madad karti hai. Jab market kisi cycle ko follow karti hai, to woh ek specific pattern ka hissa hoti hai jo time ke sath repeat hota hai. Is analysis ka mool maqsad yeh hota hai ke investors aur analysts market ke highs (peak) aur lows (through) ko identify karke apne financial decisions ko improve kar saken.
Peak aur Through Analysis ko samajhne ke liye sabse pehle humein market cycle ko samajhna hoga. Market cycles ko generally chaar phases mein divide kiya jata hai: Expansion, Peak, Contraction, aur Through. Har phase apne characteristics rakhta hai aur market ki overall performance ko define karta hai. Is analysis ke zariye, hum yeh jaan sakte hain ke market kab apni highest point (peak) par hai aur kab apni lowest point (through) par hai. Yeh insights investors ko better financial planning aur risk management mein madad deti hain.
2. Peak Aur Through Kya Hain?
Peak aur Through dono market cycle ke crucial points hain jo financial analysis mein important role play karte hain. Peak woh point hai jahan market apni highest value tak pahunchtay hai. Is point ke baad market mein downward trend start hota hai. Peak par market ki growth rate sabse zyada hoti hai aur is point par investment ki value bhi apni maximum hoti hai. Investors ke liye peak ko identify karna zaroori hota hai taake wo apne investments ko time par sell kar saken aur maximum profit le saken.
Through woh point hai jahan market apni lowest value tak pahunchtay hai. Is point ke baad market mein upward trend start hota hai. Through par market ki growth rate sabse kam hoti hai aur investment ki value bhi apni minimum hoti hai. Investors ke liye through ko identify karna bhi zaroori hota hai taake wo apne investments ko purchase kar saken jab market low point par hota hai. Peak aur Through analysis se investors ko market trends samajhne mein madad milti hai aur wo apni strategies ko accordingly adjust kar sakte hain.
3. Peak Aur Through Analysis Ka Maqsad
Peak aur Through Analysis ka maqsad market ki performance ko analyze karna aur future trends ko predict karna hai. Is analysis se investors aur economists market ke highs aur lows ko identify kar sakte hain aur apne decisions ko in indicators ke hisaab se adjust kar sakte hain. Jab market peak par hoti hai to investors generally cautious ho jate hain aur risk ko minimize karne ki koshish karte hain. Jab market through par hoti hai to investors opportunities ko explore karte hain aur potential gains ki ummeed rakhte hain.
Yeh analysis economic stability aur growth ko bhi measure karne mein madad karti hai. Agar market ko accurately analyze kiya jaye to economic policies aur strategies ko design karna asaan hota hai. Is analysis ke zariye, governments aur financial institutions bhi market trends ko samajh kar economic stability aur growth ko ensure kar sakte hain. Iske alawa, peak aur through analysis investors ko market ki volatility aur uncertainty ko manage karne mein bhi madad karti hai.
4. Market Cycle Aur Uske Phases
Market cycle ko samajhne ke liye sabse pehle humein iske different phases ko understand karna hoga. Market cycle generally chaar main phases mein divide hota hai: Expansion, Peak, Contraction, aur Through. Har phase apne characteristics rakhta hai aur market ki overall performance ko define karta hai.
Expansion Phase: Expansion phase woh period hai jab market growth kar rahi hoti hai. Is phase ke doran economic indicators jaise GDP, employment rate, aur consumer spending increase hota hai. Market mein confidence hota hai aur investments ki value bhi badh rahi hoti hai. Yeh phase generally long-term hoti hai aur investors ko opportunities provide karti hai.
Peak Phase: Peak phase market cycle ka wo point hota hai jahan market apni highest value tak pahunchtay hai. Is phase ke doran market ki growth rate sabse zyada hoti hai aur investments ki value apni maximum par hoti hai. Lekin, yeh phase short-term hota hai aur iske baad market mein downward trend start hota hai.
Contraction Phase: Contraction phase market cycle ka wo period hota hai jahan market decline kar rahi hoti hai. Is phase ke doran economic indicators jaise GDP aur employment rate decrease hota hai. Market mein uncertainty aur volatility badh jati hai aur investments ki value kam hoti hai. Yeh phase investors ke liye challenging hota hai aur unhe apni strategies ko adjust karna padta hai.
Through Phase: Through phase market cycle ka wo point hota hai jahan market apni lowest value tak pahunchtay hai. Is phase ke doran market ki growth rate sabse kam hoti hai aur investments ki value bhi apni minimum par hoti hai. Yeh phase market cycle ke baad recovery ke signal hota hai aur investors ko opportunities provide karta hai.
5. Peak Aur Through Analysis Ka Istemaal
Peak aur Through Analysis ka use investors aur analysts ke liye important hota hai. Jab market peak par hoti hai to investors generally cautious hote hain aur apni investments ko sell karne ka sochte hain taake maximum profit le saken. Peak phase ke doran market ki volatility badh jati hai aur risk management strategies ko implement karna zaroori hota hai.
Jab market through par hoti hai to investors ko opportunities ko explore karne ka mauka milta hai. Is phase ke doran investments ki value low hoti hai aur long-term gains ki ummeed hoti hai. Investors generally through points ko identify karte hain taake wo apne investments ko purchase kar saken aur market recovery ke baad maximum profit kama saken.
Peak aur Through Analysis ka use financial markets aur economies ko understand karne mein bhi hota hai. Investors aur economists is analysis ke zariye market trends ko track kar sakte hain aur apne financial decisions ko accordingly adjust kar sakte hain. Is analysis se market ki stability aur growth ko bhi ensure kiya ja sakta hai.
6. Technical Indicators
Technical indicators peak aur through points ko identify karne mein madad karte hain. Moving Averages aur Relative Strength Index (RSI) jaise indicators investors ko market trends ko samajhne aur future movements ko predict karne mein help karte hain.
Moving Averages: Moving averages market ki overall trend ko smooth out karne aur price fluctuations ko analyze karne ke liye use kiye jate hain. Simple Moving Average (SMA) aur Exponential Moving Average (EMA) jaise moving averages ko market trends ko identify karne ke liye use kiya jata hai. Moving averages ki crossovers peak aur through points ko identify karne mein madad karte hain.
Relative Strength Index (RSI): RSI ek momentum oscillator hai jo market ki overbought aur oversold conditions ko measure karta hai. Yeh indicator 0 se 100 ke range mein hota hai aur typically 70 se upar ko overbought aur 30 se neeche ko oversold consider kiya jata hai. RSI ki readings peak aur through points ko identify karne mein madad karti hain.
7. Historical Data Ka Role
Historical data peak aur through points ko identify karne mein crucial role play karta hai. Pichle market trends ko analyse karke, investors aur analysts market ki performance ko better samajh sakte hain. Historical data ke zariye, market ki past cycles ko track kiya ja sakta hai aur future trends ko predict kiya ja sakta hai.
Historical data ka analysis market ke highs aur lows ko identify karne mein madad karta hai. Is data ke zariye, investors ko yeh samajhne mein madad milti hai ke market kab peak par hoti hai aur kab through par hoti hai. Yeh insights financial decisions ko improve karne aur investment strategies ko adjust karne mein help karti hain.
8. Peak Aur Through Analysis Ka Impact
Peak aur Through Analysis ka impact financial markets aur economies par hota hai. Agar market ko accurately analyse kiya jaye to economic stability aur growth ko ensure kiya ja sakta hai. Investors aur economists is analysis ke zariye market trends ko samajh kar apni strategies ko improve kar sakte hain.
Is analysis ka impact financial markets ke liye bhi hota hai. Accurate market predictions investors ko informed decisions lene mein madad deti hain aur market ki stability ko enhance karti hain. Governments aur financial institutions bhi is analysis ke zariye economic policies aur strategies ko design kar sakte hain.
9. Case Studies
Case studies peak aur through analysis ko better samajhne aur real-world applications ko explore karne mein madad karti hain. Pichle kuch years mein ki gayi case studies ne yeh prove kiya hai ke peak aur through analysis se accurate predictions ki ja sakti hain.
Ek case study ka example 2008 ki financial crisis hai. Is crisis ke doran, peak aur through analysis se yeh identify kiya gaya ke market apne highest aur lowest points par hai. Is analysis ke zariye investors ne apni strategies ko adjust kiya aur economic recovery ke process ko samjha.
10. Market Sentiment Aur Analysis
Market sentiment bhi peak aur through analysis ko influence karti hai. Jab market positive sentiment ke saath hoti hai to peak points zyada high hote hain aur negative sentiment ke saath through points zyada low hote hain. Market sentiment investors aur analysts ke decisions ko affect karti hai.
Positive sentiment ke doran, investors apne investments ko grow karte hain aur market ki performance ko enhance karte hain. Negative sentiment ke doran, investors cautious ho jate hain aur apne investments ko manage karne ki koshish karte hain. Market sentiment ko analyse karke peak aur through points ko accurately identify kiya ja sakta hai.
11. Risk Management
Peak aur through analysis risk management mein bhi use hoti hai. Investors ko yeh samajhna zaroori hota hai ke market kab peak par hai aur kab through par hai, taake wo apni investments ko accordingly manage kar saken. Risk management strategies ko implement karne se market ki volatility aur uncertainty ko manage kiya ja sakta hai.
Investors ko peak phase ke doran apne investments ko sell karne ka plan banana chahiye aur through phase ke doran opportunities ko explore karna chahiye. Is analysis se investors ko market trends ko samajhne aur risk ko manage karne mein madad milti hai.
12. Future Trends Aur Predictions
Future trends ko predict karne ke liye peak aur through analysis ka use kiya jata hai. Agar market ki past trends ko accurately analyse kiya jaye to future movements ko predict karna asaan hota hai. Is analysis ke zariye investors aur economists market ke future trends ko samajh sakte hain aur apni strategies ko accordingly adjust kar sakte hain.
Future trends aur predictions ke liye historical data aur technical indicators ka analysis zaroori hota hai. Yeh insights market ki performance ko enhance karne aur financial decisions ko improve karne mein madad karti hain.
13. Challenges Aur Limitations
Peak aur through analysis ke kuch challenges aur limitations bhi hote hain. Market ki unpredictability aur external factors jo analysis ko influence karte hain, inko consider karna zaroori hota hai. Market trends ko accurately predict karna challenging ho sakta hai, kyunki market ki behavior kabhi bhi change ho sakti hai.
Investors aur analysts ko yeh samajhna zaroori hota hai ke peak aur through analysis ke results ko external factors ke saath compare karna chahiye. Yeh limitations ko samajhna aur manage karna financial decisions ko improve karne mein madad karta hai.
14. Conclusion
Peak aur Through Analysis ek important tool hai jo market trends ko samajhne aur future predictions karne mein madad karti hai. Is analysis se investors aur economists ko market ke highs aur lows ko identify karne aur apni strategies ko accordingly adjust karne mein madad milti hai. Yeh analysis market ki stability aur growth ko ensure karti hai aur financial decisions ko improve karti hai.
Is analysis ke zariye, investors aur economists market ke trends ko accurately predict kar sakte hain aur apni financial planning ko enhance kar sakte hain. Peak aur Through Analysis market ki performance ko samajhne aur future movements ko predict karne ke liye essential tool hai. -
wish2Senior Member
- Aug 2024
- 2289
- 12
- 54
- 258 USD
**Peak aur Through Analysis**
Peak aur through analysis trading aur technical analysis mein ek ahem role ada karta hai. Yeh concept market ke movements ko samajhne aur future trends ko predict karne mein madadgar hota hai. Is analysis se traders aur investors ko yeh samajhne mein madad milti hai ke market kis direction mein ja raha hai aur kab buy ya sell karna chahiye.
**Peak aur Through kya hote hain?**
Peak aur through, market ke chart par specific points ko refer karte hain. Peak wo point hota hai jahan market ki price highest hoti hai aur uske baad decline shuru hota hai. On the other hand, through wo point hota hai jahan market ki price lowest hoti hai aur uske baad increase shuru hota hai. In dono points ko identify karna trading strategy ke liye crucial hai kyun ke yeh points price trends ke changes ko indicate karte hain.
**Peak aur Through Analysis ka maqsad**
Peak aur through analysis ka primary maqsad market ke trend ko samajhna aur potential reversal points ko identify karna hota hai. Jab market peak par hota hai, to iska matlab hai ke market overbought condition mein hai aur decline ho sakta hai. Jab market through par hota hai, to iska matlab hai ke market oversold condition mein hai aur price ka increase hone ke chances hote hain.
**Analysis ka tareeqa**
1. **Chart Patterns**: Peak aur through analysis ko market charts par identify karna hota hai. Traders aur analysts charts par peak aur through points ko dhoondte hain aur unhein mark karte hain. Yeh patterns market ke historical data ko dekh kar identify kiye jaate hain.
2. **Trend Lines**: Trend lines bhi peak aur through analysis mein madadgar hoti hain. Aap trend lines draw karke peak aur through points ko connect kar sakte hain. Yeh trend lines aapko market ki direction aur potential reversal points identify karne mein madad karti hain.
3. **Technical Indicators**: Different technical indicators jaise ke Moving Averages, Relative Strength Index (RSI), aur MACD bhi peak aur through points ko identify karne mein madadgar hote hain. Yeh indicators market ki overbought aur oversold conditions ko highlight karte hain jo peak aur through analysis ke liye useful hote hain.
**Example**
Maan lijiye aapne ek stock ka chart dekha aur aapne dekha ke stock ki price ek high point par pohnch gayi hai. Yeh high point peak ho sakta hai. Is point ke baad agar price decline hoti hai, to aap yeh samajh sakte hain ke market ne peak point ko achieve kar liya hai aur ab downward trend shuru ho sakta hai. Is tarah se, jab price ek low point par aati hai aur phir rise hota hai, to wo low point through ho sakta hai aur upward trend ke start hone ka signal hota hai.
**Conclusion**
Peak aur through analysis trading aur market analysis mein ek crucial role ada karta hai. Yeh analysis traders ko market trends ko samajhne aur unke trading decisions ko improve karne mein madad karta hai. Is analysis ke zariye traders market ke potential reversal points ko identify kar sakte hain aur apni trading strategy ko accordingly adjust kar sakte hain. Market ki price movements ko samajhne aur analyze karne ke liye peak aur through points ka analysis zaroori hai.
-
supraSenior Member
- Mar 2024
- 1350
- 4
- 26
- 237 USD
Peak aur trough analysis forex trading mein price trends aur market conditions ko samajhne ke liye use hota hai. Yeh analysis traders ko market ke highs aur lows ko identify karne mein madad karta hai, jo future price movements ko predict karne mein useful ho sakta hai. Yahan peak aur trough analysis ke key points aur uses ko detail se samjha gaya hai:
1. **Peak Aur Trough Ka Definition:**
- **Peak:** Peak market ka highest point hota hai, jahan price temporarily high hoti hai. Yeh point trend reversal ya market ke overbought conditions ko indicate kar sakta hai.
- **Trough:** Trough market ka lowest point hota hai, jahan price temporarily low hoti hai. Yeh point trend reversal ya market ke oversold conditions ko indicate kar sakta hai.
2. **Peak Aur Trough Analysis Ka Purpose:**
- **Trend Identification:** Peak aur trough analysis se trends ki direction aur strength ko identify kiya jata hai. High peaks aur low troughs trend ke continuation ya reversal ko signal dete hain.
- **Market Conditions:** Peaks aur troughs market conditions, jaise overbought aur oversold levels, ko assess karne mein madad karte hain. Yeh traders ko market ke potential reversals aur trading opportunities ko identify karne mein help karte hain.
3. **Analysis Techniques:**
- **Swing Highs Aur Lows:** Market ke swing highs (peaks) aur swing lows (troughs) ko identify karke traders trends aur market structure ko analyze karte hain. Swing highs aur lows trend ke changes aur potential reversals ko indicate karte hain.
- **Support Aur Resistance Levels:** Peaks aur troughs ko support aur resistance levels identify karne ke liye use kiya jata hai. Peaks resistance levels aur troughs support levels ko represent karte hain.
4. **Trading Signals:**
- **Trend Reversal:** Agar price ek peak ko break karti hai aur phir neeche girti hai, toh yeh bearish reversal signal ho sakta hai. Agar price ek trough ko break karti hai aur upar barhti hai, toh yeh bullish reversal signal ho sakta hai.
- **Trend Continuation:** Agar price ek trend ke dauran multiple peaks aur troughs create karti hai, toh yeh trend ke continuation ko indicate kar sakta hai.
5. **Advantages of Peak Aur Trough Analysis:**
- **Market Trends Understanding:** Peaks aur troughs market ke trends aur patterns ko better understand karne mein madad karte hain.
- **Trading Strategy Development:** Yeh analysis trading strategies ko develop karne mein madad karta hai, jaise trend-following aur reversal strategies.
6. **Limitations of Peak Aur Trough Analysis:**
- **Subjectivity:** Peaks aur troughs ko identify karna subjective ho sakta hai aur different traders ke liye different ho sakta hai.
- **Lagging Nature:** Peaks aur troughs analysis trend reversals ko identify karne mein help karta hai, lekin yeh lagging nature ke sath hota hai aur timely signals nahi provide karta.
Peak aur trough analysis forex trading mein market trends aur potential reversals ko samajhne ke liye effective tool hai. Yeh traders ko market conditions ko assess karne aur informed trading decisions lene mein madad karta hai, jisse trading strategies ko enhance kiya ja sakta hai.
-
wish2Senior Member
- Aug 2024
- 2289
- 12
- 54
- 258 USD
**Peak and Through Analysis**
Forex trading mein Peak aur Through analysis aik important concept hai, jo market ke highs aur lows ko analyze karne ke liye use hota hai. Is analysis ki madad se traders market ke trend ko samajhne mein aur future price movements ko predict karne mein madad hasil karte hain.
**Peak aur Through Kya Hota Hai?**
Peak market ka wo level hota hai jab price apne maximum point par pohanch jati hai, iske baad price me girawat dekhi jati hai. Through, iske bar'aks, wo point hota hai jab market apne lowest level par hoti hai aur iske baad price me izafa hota hai. In dono points ke darmiyan ka fark, yani Peak se Through tak ka safar, market ka trend define karta hai.
**Trend Analysis**
Trend analysis mein Peak aur Through ki identification critical hoti hai. Agar aik market consistently higher Peaks aur higher Throughs bana rahi hai, to yeh bullish trend ko indicate karta hai. Yeh trend is baat ka izhar karta hai ke market upward direction mein hai aur prices mein izafa ho raha hai. Iske bar'aks, agar lower Peaks aur lower Throughs ban rahe hain, to yeh bearish trend ko show karta hai, jo price ki girawat ki taraf ishara karta hai.
**Support aur Resistance**
Peak aur Through analysis ki madad se support aur resistance levels bhi identify kiye ja sakte hain. Peak ke level ko resistance mana jata hai, kyun ke yeh wo point hota hai jahan se price girti hai. Through ke level ko support mana jata hai, kyun ke yeh wo point hota hai jahan se price barhti hai. In levels ka pata lagana important hai, kyun ke yeh points price reversal ya continuation ke signals de sakte hain.
**Risk Management**
Peak aur Through analysis ke zariye traders apni risk management strategies ko bhi improve kar sakte hain. Agar koi trader dekhe ke market apne peak ya through par hai, to wo apni trading strategy ko accordingly adjust kar sakta hai, taake losses se bach sake ya profits maximize kar sake.
**Conclusion**
Peak aur Through analysis aik powerful tool hai jo market trends ko samajhne aur trading decisions lene mein madadgar hota hai. Is analysis ke zariye traders market ke highs aur lows ko effectively identify kar sakte hain aur apni trading strategies ko accordingly modify kar sakte hain. Yeh analysis risk management mein bhi ahmiyat rakhta hai aur is se profitable trading ka possibility barh jati hai.
-
legoSenior Member
- May 2024
- 202
- 11
- 88 USD
Peak and Trough Analysis trading aur investing mein aik fundamental technique hai jo market ke price movements ko samajhne aur analyze karne mein madad deti hai. Yeh technique traders aur investors ko market ke high (peaks) aur low (troughs) points ko identify karne mein help karti hai, jisse woh market ke trends, reversals, aur potential entry aur exit points ko behtar tareeke se samajh sakte hain. Peak and Trough Analysis ke zariye, traders market ke cyclical patterns ko dekhte hain aur unhe predict karte hain ke market kis direction mein move karne wala hai.
Peak aur Through Analysis ka Forex Trading mein Maqsood
Forex trading mein, Peak aur Through Analysis ek badi ahmiyat rakhta hai. Yeh analysis price action ka observation hai jahan par trader highs aur lows ko dekh kar market ke trends ko samajhta hai.
Peak aur Through kya hain?
Peak
wo point hota hai jahan currency ki price temporary high pe pohanchti hai aur phir downward movement start karti hai.
Through
wo point hai jahan price apne lowest level pe hoti hai aur upward movement start hoti hai.
Trend Identification
Peak aur Through Analysis, trend ko identify karne mein help karta hai. Agar peaks aur throughs continuously upar ja rahe hon, toh yeh ek uptrend ki nishani hai. Iss ke bar-aks, agar yeh continuously neeche ja rahe hon, toh yeh downtrend ka indication hai.
Entry aur Exit Points
Yeh analysis traders ko entry aur exit points identify karne mein bhi madad deta hai. Jab price ek through se peak ki taraf jaati hai, toh yeh buying opportunity ho sakti hai. Aur jab price peak se through ki taraf jaati hai, toh yeh selling opportunity ho sakti hai.
Stop Loss aur Take Profit
Peak aur Through Analysis stop loss aur take profit levels set karne mein bhi madad karta hai. Traders apne stop loss ko through ke neeche set kar sakte hain aur take profit ko peak ke upar. Is tarah, risk management mein help milti hai.
Support aur Resistance Levels
Peak aur throughs, support aur resistance levels identify karne mein bhi help karte hain. Agar ek peak bar bar touch ho raha hai, toh yeh ek resistance level ban sakta hai. Isi tarah, agar through bar bar touch ho raha hai, toh yeh support level ban sakta hai.
Trend Reversals
Iss analysis ki help se, trend reversals bhi predict kiye ja sakte hain. Agar ek uptrend mein, peaks aur throughs lower ho rahe hain, toh yeh ek trend reversal ka indication hai. Isi tarah, downtrend mein agar peaks aur throughs higher ho rahe hain, toh yeh bhi trend reversal ka indication hai.
Trend Continuation
Agar peaks aur throughs ek consistent pattern follow kar rahe hon, toh yeh trend continuation ka indication hai. For example, agar uptrend mein peaks higher high aur throughs higher low bana rahe hain, toh yeh uptrend continuation ka indication hai. -
wish2Senior Member
- Aug 2024
- 2289
- 12
- 54
- 258 USD
**Peak and Trough Analysis: Forex Trading Mein Istemaal**
Forex trading mein peak aur trough analysis ek ahem technique hai jo traders ko market trends samajhne mein madad deti hai. Yeh analysis asan lafzon mein price ke highest (peak) aur lowest (trough) points ko identify karne par mabni hoti hai. Peak wo level hai jahan price apni highest point tak pohanchti hai, jabke trough wo level hota hai jahan price apni lowest point tak girti hai. Is analysis ka maqsad yeh hota hai ke aap market ke trend ko behtar samajh saken aur profitable trades kar saken.
### Peak aur Trough Ka Tayeun
Peak aur trough ko identify karna traders ke liye critical hota hai. Jab market trend upward hota hai, to aapko higher peaks aur higher troughs nazar aayenge, jo ek bullish trend ko indicate karte hain. Agar market downward trend mein hota hai to lower peaks aur lower troughs nazar aayenge, jo bearish trend ko zahir karte hain. Yeh pattern aapko yeh samajhne mein madad deta hai ke market kis taraf ja raha hai aur kab ek trend ka reversal ho sakta hai.
### Trend Reversal Ka Imkaan
Peak aur trough analysis ka sabse bara faida yeh hota hai ke yeh aapko trend reversal ka imkaan batata hai. Jab ek peak ke baad naya trough form hota hai jo pehle se higher hota hai, to yeh indicate karta hai ke market mein strength hai aur trend upward reh sakta hai. Isi tarah, agar naya trough pehle se lower hota hai, to yeh signal hai ke market mein weakness hai aur downward trend ho sakta hai.
### Entry aur Exit Points Ka Tayeun
Is analysis ka doosra faida yeh hai ke yeh aapko behtareen entry aur exit points identify karne mein madad deta hai. Aap peak aur trough analysis ke zariye apni positions ko adjust kar sakte hain. Agar aapko lagta hai ke market mein ek naya peak form hone wala hai, to yeh ek acha exit point ho sakta hai. Aur agar ek naya trough form ho raha hai, to yeh ek acha entry point ho sakta hai, kyun ke yeh trend ke continuation ya reversal ka imkaan rakhta hai.
### Conclusion
Peak aur trough analysis forex trading mein ek ahem role ada karta hai, jo traders ko market ke trends aur reversals ko samajhne mein madad deta hai. Is technique ko samajh kar aur istimaal kar ke, aap profitable trades karne ke liye apni trading strategy mein behtari la sakte hain. Yad rakhein, ke trading mein koi bhi technique 100% accurate nahi hoti, isliye risk management ka bhi khayal rakhna zaroori hai.
-
<a href="https://www.instaforex.org/ru/?x=ruforum">InstaForex</a> -
ShokeenSenior Member
- Mar 2024
- 2292
- 67
- 103
- 876 USD
### Peak and Through Analysis in Forex Trading
Forex trading mein analysis ki do fundamental techniques hain: peak analysis aur through analysis. In dono techniques ka maqsad market ki movement ko samajhna aur traders ko informed decisions lene mein madad dena hai. Is post mein hum peak aur through analysis ki definitions, unki ahmiyat aur trading strategies par baat karenge.
**Peak Analysis Ki Definition:**
Peak analysis se murad hai market ke price movements ke un points ko identify karna jahan price apne highest level par hoti hai. Yeh points "peaks" kehlate hain aur inki pehchaan karna important hai kyunki in par price reversal ya correction hone ki sambhavana hoti hai. Peak points ka analysis karne se traders ko yeh samajhne mein madad milti hai ke market kis disha mein ja raha hai.
**Through Analysis Ki Definition:**
Through analysis, on the other hand, un points ko dhoondta hai jahan price apne lowest level par hoti hai. Yeh points "throughs" kehlate hain. Through points ki pehchaan bhi important hai, kyunki in par price ka reversal ya bullish trend shuru hone ki sambhavana hoti hai. Yeh analysis market ke downturns ko samajhne aur potential entry points dhoondhne mein madad karta hai.
**Ahmiyat:**
Peak aur through analysis ka sab se bada faida yeh hai ke yeh traders ko market ki psychology ko samajhne mein madad dete hain. Jab price peak par hoti hai, to yeh indicate karta hai ke buyers ka pressure kam ho raha hai aur sellers ka control barh raha hai. Is waqt traders ko short positions lene par ghor karna chahiye. Uske baraks, jab price through point par hoti hai, to yeh indicate karta hai ke sellers ka pressure kam ho raha hai aur buyers market mein wapas aa rahe hain, jo long positions lene ka signal hota hai.
**Trading Strategy:**
1. **Identify Peaks and Throughs:** Pehle aapko charts par peaks aur throughs ko identify karna hoga. Iske liye aapko historical price data ka ghor se analysis karna padega.
2. **Use Indicators:** Peak aur through analysis ko confirm karne ke liye technical indicators, jaise Moving Averages ya Relative Strength Index (RSI), ka istemal karein. Yeh indicators aapko additional confirmation dene mein madad karte hain.
3. **Set Entry and Exit Points:** Jab aap peak ya through points identify kar lete hain, to entry aur exit points set karna na bhoolen. Stop-loss orders bhi set karein taake aap unexpected price movements se bacha rahen.
4. **Risk Management:** Risk management strategies ko apne trading plan ka hissa banayein. Aapko hamesha yeh dekhna chahiye ke aap kitna risk uthane ke liye tayar hain.
**Conclusion:**
Peak aur through analysis forex trading ke liye ek powerful tool hain. Yeh aapko market ki dynamics samajhne, potential reversals identify karne, aur informed trading decisions lene mein madad karte hain. In techniques ka istemal kar ke, aap apne trading skills ko behtar bana sakte hain aur consistent profits hasil kar sakte hain. Aakhir mein, patience aur practice zaroori hain taake aap in analyses ko effectively apply kar sakein.
اب آن لائن
Working...
تبصرہ
Расширенный режим Обычный режим