Support and Resistance Area
-
SajiMalikSenior Member

- Feb 2023
- 122
- 11
- 16
- 20 USD
-
<a href="https://www.instaforex.org/ru/?x=ruforum">InstaForex</a> -
SajiMalikSenior Member
- Feb 2023
- 122
- 11
- 16
- 20 USD
Support and Resistance Area Forex trading mein, S & R ke ilaqay support aur resistance ilaqon ka hawala dete hain. yeh ilaqay ahem hain kyunkay yeh taajiron ko mumkina sthon ki nishandahi karne mein madad kar satke hain jahan qeematein palat sakti hain ya toot sakti hain . Support se morad woh satah hai jahan khredar tareekhi tor par market mein daakhil hue hon aur qeemat ko mazeed girnay se roka ho. doosri taraf muzahmat se morad aisi satah hai jahan baichnay walay tareekhi tor par market mein daakhil hue hain aur qeemat ko mazeed bherne se roka hai . Tajir apni tijarat ke liye mumkina dakhlay aur kharji raastoon ka taayun karne mein madad aur resistance sthon ka istemaal karte hain. misaal ke tor par, aik tajir support level par khareedna chahta hai, yeh tawaqqa karte hue ke qeemat is satah se wapas oopar aaye gi. is ke bar aks, aik tajir resistance satah par farokht karne ki taraf dekh sakta hai, yeh tawaqqa karte hue ke qeemat is satah ko toar nahi paye gi aur is ke bajaye wapas neechay gir jaye gi . S & R ilaqon ki shanakht takneeki tajzia ke tools jaisay trained lines, moving averages, aur Fibonacci retracements ke zariye ki ja sakti hai. tajir kaleedi support aur resistance sthon ki shanakht mein madad ke liye qeemat action tajzia aur chart patteren bhi istemaal kar satke hain . Yeh note karna zaroori hai ke support aur muzahmat ki sthin hamesha durust qeematein nahi hoten. is ke bajaye, woh aksar range ya zone hotay hain jahan qeemat cluster hoti hai. is terhan, tajir apne tajzia ki tasdeeq ke liye aksar himayat ya muzahmat ke mutadid isharay talaash karte hain . Purpose of Support and Resistance Areas Forex trading mein support aur resistance ( S & R ) ke shobo ka maqsad un sthon ki nishandahi karna hai jahan qeemat mumkina tor par rivers ya ruk sakti hai. un sthon ko samajh kar, tajir bakhabar tijarti faislay kar satke hain, jaisay ke apni tijarat ke liye mumkina dakhlay aur kharji raastoon ki nishandahi karna . Support level woh ilaqay hain jahan qeemat mein kami ke baad tareekhi tor par wapsi hui hai. yeh kharidaron ke bazaar mein daakhil honay aur is satah par kharidne ki wajah se ho sakta hai, is terhan qeemat ko sahara mil sakta hai. agar mustaqbil mein qeemat dobarah is satah tak pahonch jati hai, to tajir yeh andaza laga satke hain ke khredar dobarah market mein daakhil hon ge aur qeemat ko wapas oopar le jayen ge. is terhan, aik tajir is satah par khareedna chahta hai . Resistance ki sthin woh ilaqay hain jahan qeemat tareekhi tor par izafay ke baad wapas neechay aayi hai. yeh farokht knndgan ke bazaar mein daakhil honay aur is satah par farokht karne ki wajah se ho sakta hai, is terhan qeemat ke khilaaf muzahmat faraham karti hai. agar mustaqbil mein qeemat dobarah is satah tak pahonch jati hai, to tajir yeh andaza laga satke hain ke baichnay walay dobarah market mein daakhil hon ge aur qeemat ko wapas neechay dhakel den ge. is terhan, aik tajir is satah par farokht karna dekh sakta hai . S & R ilaqon ki shanakht mukhtalif takneeki tajzia tools, jaisay trained lines, moving averages, aur Fibonacci retracements ke zariye ki ja sakti hai. tajir kaleedi support aur resistance sthon ki shanakht mein madad ke liye qeemat action tajzia aur chart patteren bhi istemaal kar satke hain . Majmoi tor par, forex trading mein S & R shobo ka maqsad taajiron ko market mein mumkina mourr ki nishandahi karne aur is tajzia ki bunyaad par bakhabar tijarti faislay karne mein madad karna hai . -
ImtiazHussain786Senior Member
- Dec 2021
- 143
- 20
- 40
- 146 USD
InstaSpot: کسی بھی EPS اور بینک سے منافع واپس لیں، اور EPS اور cryptocurrencies کے تبادلے پر 7% تک کمائیں۔
Introduction: Aslamulikum umeed karta hu sub thek ho gye jaisa k hum janta hain forex aik bhot he bara business hain humain be chaiye k hum iss main mehnaat sy kam karye agr iss main achi earning karni hain toh zada sy zada mehnaat akrye iss business main tabhi hum iss mainn agye bar sakta hain aur iss main fida utha sakta hainn humain chiaye k learning k saat saat iss main experiences be zada sy zada laa thk hum iss main apni mistakes ko dor kar skye aur iss main agye bar sakye aur kamiyaab trader ban sakiye zada sy zada learning aur knowledge ko better karye tabhi hum iss main kamiyaab trader ban sakta hain. Resistance and Support Level: Resistance and Support level woh level hota hain market main iss main humain market ki movement aur breakout kah idea hota hain jis k nisbaat hum iss main traders lata hain aur iss sy fida yeh nuqsaan wagra utha hainn humain chaiye k hum iss main learning k saat saat iss main apna experince ko gain karye thk hum iss main zada sy zada fida utha sakyeJaisa k Hum chart main dakh sakta hain market main aik level resistance aur dosra level Support kah han necha wala level ko Support and uper walye Level ko Resistance kahta hain jab market Resistance level ko break out karti hain aur uska bad again sy us level ko retest karti hain toh hum kah sakta hain k market main ab moka hain trade lana kah jab market dobara resistance level ko retest karti hain toh agr us level ko break na karye aur rejection daa da toh hum kah sakta hain yeh resistance level strong hain aur iss main humain chaiye k hum iss main Buy ki entry laa aur same agr humera Support level break out karta hain aur market jab dobara sy support level ko necha ki side sy retest karti hain toh tabhi humain iss main entry lani chiaye jab market necha sy uper usko retest karti hain toh agr market resistance level ko break na karye toh hum kah sakta hain k support level strong hain aur market abhi downtrend main move karye gye aur hum iss main sell ki entry laa sakta hain aur iss sy fida utha sakta hain.
-
Sanwal115Senior Member
- Feb 2023
- 149
- 73
- 129
- 66 USD
1) What are support and resistance areas? Support and resistance areas are price levels where the market has a tendency to find support or resistance. These areas can be used by traders to make decisions about where to enter or exit a trade. The most important thing to remember about support and resistance areas is that they are not exact levels. Rather, they are zones where the market is likely to find support or resistance. As such, it is important to use other technical indicators in conjunction with support and resistance areas to make trading decisions. Some common indicators that traders use in conjunction with support and resistance areas are moving averages, Fibonacci levels, and candlestick patterns. 2) How can you identify support and resistance areas? When it comes to trading, one of the most important concepts to understand is that of support and resistance. These are price levels at which the market has a tendency to reverse direction, and as such, they can be used to enter or exit trades. There are a few different ways to identify potential support and resistance areas. One is to look at past price action to see where the market has reversed direction in the past. Another is to use technical indicators such as moving averages or Fibonacci levels. Finally, you can also use psychological levels to identify potential support and resistance areas. These are price levels that round to nice, even numbers, and as such, they can act as magnets for price. Whichever method you use, the key is to look for areas where there is a confluence of multiple factors. This will increase the chances that the market will indeed reverse direction at that level. 3) What role do support and resistance areas play in trading? When it comes to trading, support and resistance areas are key. They can help you make better decisions about when to enter and exit trades. Here's a closer look at how they work. Support and resistance areas are areas on a chart where the price has a tendency to stop and reverse. These areas are created when the price hits a certain level and then starts to move in the opposite direction. The key to using support and resistance areas is to look for areas where the price has reversed multiple times. These are typically the most important levels. When the price is approaching a support or resistance area, you can watch for certain price action signals. These signals can help you time your entries and exits. One important thing to remember is that support and resistance areas are not exact levels. They are areas where the price is likely to find support or resistance. If you are looking to enter a trade, you can place your stop loss just below a support area. This will help you stay in the trade if the price reverses at that level. If you are looking to exit a trade, you can place your take profit just above a resistance area. This will help you lock in profits. 4) How can you use support and resistance areas to your advantage? When it comes to trading, one of the most important concepts to understand is that of support and resistance. These are areas where the price of an asset has a tendency to reverse direction, and as such, they can be used to your advantage. Here's a quick rundown of how support and resistance works - Support is an area where the price of an asset has a tendency to find support, meaning it is less likely to fall below this level. - Resistance is an area where the price of an asset has a tendency to find resistance, meaning it is less likely to rise above this level. One of the best ways to trade using support and resistance is to look for price action signals in these areas. Price action is simply the movement of price, and by studying it, we can get an idea of where the market is likely to move next. There are a few different types of price action signals that can be useful in trading support and resistance: - Pin bars: These are candlestick patterns that have a small body and a long wick. They indicate a potential reversal in the market. 5) What are some common mistakes traders make with respect to support and resistance areas? When it comes to trading, there are a lot of different techniques that traders use in order to try and predict market movements. One of these techniques is known as support and resistance analysis. Support and resistance analysis is a method of technical analysis that is used to identify key levels where the market is likely to experience a reversal or pause in trend. These levels are typically identified using price charts, and they can be used by traders to make decisions about when to enter and exit trades. However, while support and resistance analysis can be a helpful tool, it is also important to be aware of the potential mistakes that traders can make when using this technique. One of the most common mistakes that traders make with respect to support and resistance is failing to properly identify the key levels. This can often lead to traders entering or exiting trades too early, or missing out on potential profits altogether. Another mistake that is often made is failing to take into account the different timeframes that can be used when identifying support and resistance levels. For example, a support or resistance level that is identified on a daily chart may not have the same significance when looked at on a weekly or monthly chart. 6) How can you overcome these mistakes and make the most of support and resistance areas? There are a few key mistakes that traders make when it comes to support and resistance areas. By understanding what these mistakes are, you can avoid them and make the most of these important technical levels. The first mistake is failing to identify the key support and resistance areas. These levels are not always obvious, and you need to take a bit of time to identify them on your charts. Look for areas where the price has repeatedly reversed or where there is a significant concentration of trading activity. These are typically the most important support and resistance levels. The second mistake is not respecting the support and resistance areas. These levels represent significant barriers to the price, and they should be treated with respect. If the price approaches a support or resistance area and then reverses, it is likely that this area is still significant. Do not be too quick to abandon a support or resistance area just because the price has moved away from it temporarily. The third mistake is not using stop-loss orders when trading around support and resistance areas. These levels can be very volatile, and it is important to protect your capital by using stop-loss orders. Place your stop-loss order just below support in an uptrend or just above resistance in a downt. -
SkydiversSenior Member
- Mar 2023
- 1444
- 239
- 371
- 579 USD
Support aur resistance areas forex trading mein ahem concepts hain jo traders ko market mein potential price levels ka pata lagane mein madad dete hain jahan market kaafi bar react kar sakta hai. Ye areas technical analysis mein bohot ahem hoti hain aur traders ko entry, exit aur risk management strategies banane mein madad deti hain.
Understanding Support and Resistance Areas
Support aur resistance areas wo levels hain jo price chart par aise areas hote hain jahan khareedne (support) ya bechnay (resistance) ki dabao bohot ziada hoti hai. Ye levels taeed nahi detay balkay zones ya areas hote hain jahan price movements aksar ruk jati hai ya ultay chalti hai market ke psychological aur technical dynamics ki wajah se.- Support Areas: Support areas wo levels hain jahan kisi asset ki demand itni strong hoti hai ke prices aur neeche nahi gir sakti. Traders support areas ko potential buying opportunities ke tor par dekhte hain kyun ke itihasi tor par, jab prices in levels tak pohanchti hain, wahan se wapis chalti hain. Support areas ko peechay ke price action ko dekh kar identify kya jata hai, jahan price ne pehle bhi reverse kiya ho ya consolidate kiya ho.
- Resistance Areas: Dosri taraf, resistance areas wo levels hote hain jahan selling pressure buying pressure ko maat deti hai, jis se prices neeche jaane mein mushkil hoti hai ya ultay chalti hain. Traders resistance areas ko potential selling opportunities ke tor par dekhte hain kyun ke prices in levels ko break karne mein mushkil hoti hain. Resistance areas ko price peaks ya areas ke through identify kiya jata hai jahan market ne consistently higher movements nahi show kiye.
Significance of Support and Resistance Areas
Support aur resistance areas bohot ahem hote hain kuch wajahon se:- Price Reversals: Ye areas potential price reversals ko indicate karte hain. Jab prices support ya resistance areas tak pohanchti hain, traders confirmation signals jaise candlestick patterns, chart patterns ya technical indicators ki talaash karte hain taake determine kar sakein ke reversal ki kya possibility hai.
- Trading Opportunities: Support aur resistance areas traders ko trading opportunities provide karte hain. Support areas ke qareeb khareedna aur resistance areas ke qareeb bechna profitable strategies ho sakti hain agar sahi risk management aur analysis ke saath combine kiya jaye.
- Risk Management: Traders support aur resistance areas ko stop-loss levels set karne aur risk management ke liye use karte hain. Stop-loss orders support levels ke just neeche rakhe jate hain (long positions ke liye) ya resistance levels ke just upar (short positions ke liye) taake agar market trade ke khilaaf move karti hai to capital protect ho sake.
- Market Psychology: Support aur resistance areas market psychology ko reflect karte hain. Support levels wo areas hote hain jahan buyers market mein dakhil ho rahe hote hain, prices ko attractive samajhte hue, jabke resistance levels wo areas hote hain jahan sellers active hote hain, prices ke neeche jaane ka expectation rakhte hue.
Traders support aur resistance areas ko identify karne ke liye kuch methods istemal karte hain:- Horizontal Levels: Traders horizontal price levels ko dekhte hain jahan market ne pehle significant buying ya selling activity dikhayi hai. Ye levels manually price chart par draw kiye ja sakte hain ya technical analysis tools ke through identify kiye ja sakte hain.
- Trendlines: Trendlines diagonal lines hote hain jo chart par draw kiye jate hain price peaks ko connect karne ke liye (resistance ke liye) ya price valleys ko connect karne ke liye (support ke liye). Trendlines traders ko price movements ki slope ko visualize karne mein madad karte hain aur potential areas ko identify karne mein help karte hain.
- Moving Averages: Moving averages, khaaskar longer-term jaise 50-day ya 200-day moving average, dynamic support ya resistance levels ke tor par kaam kar sakte hain. Jab prices in moving averages ke qareeb aati hain, traders potential reactions dekhte hain.
- Fibonacci Retracement Levels: Fibonacci retracement levels, Fibonacci sequence par based hote hain, jin se potential support aur resistance areas identify kiye ja sakte hain based on price retracements ka ratio. Traders aksar 38.2%, 50%, aur 61.8% Fibonacci levels ka istemal karte hain.
Traders support aur resistance areas ko various ways mein use karte hain trading decisions banane ke liye:- Entry Points: Traders entry points ko dekhte hain near support ya resistance areas. For example, ek trader long position enter karega jab prices support level se bounce back karein, expecting a price rise.
- Exit Points: Support aur resistance areas exit points ko determine karne mein madad karte hain trades ke liye. Traders profits near a resistance level le sakte hain ya ek losing trade ko exit kar sakte hain agar prices support level ko breach karte hain.
- Risk Management: Stop-loss orders often place kiye jate hain just below support levels (long positions ke liye) ya above resistance levels (short positions ke liye) risk management ke liye. Is se losses limit ho jati hain agar market trade ke khilaaf move karti hai.
- Confirmation Signals: Traders confirmation signals ko dekhte hain jaise candlestick patterns (hammer, engulfing patterns), chart patterns (double tops, head and shoulders), ya technical indicators (RSI, MACD) near support ya resistance areas ke paas apne trading decisions validate karne ke liye.
- Advantages:
- Provide clear levels for entry, exit, aur risk management.
- Market psychology aur dynamics ko reflect karte hain.
- Diğer technical analysis tools ke saath combine karke more robust trading strategies banaye ja sakte hain.
- Disadvantages:
- Not always precise, kyunki support aur resistance areas zones hote hain exact levels nahi.
- Market conditions change ho sakti hain, leading to breakouts ya false signals near support ya resistance areas.
- Requires experience aur skill ko effectively use karne ke liye support aur resistance areas in trading strategies.
Believe in yourself and your abilities. When you fight for your dreams, you can achieve anything.
-
NaveedeagleSenior Member
- Jul 2024
- 647
- 1
- 10
- 114 USD
InstaSpot: کسی بھی EPS اور بینک سے منافع واپس لیں، اور EPS اور cryptocurrencies کے تبادلے پر 7% تک کمائیں۔
Support and Resistance Area
Support aur Resistance kya hain?
Forex trading mein support aur resistance areas ka concept bohot ahm hai. Ye dono areas market ke behavior ko samajhne aur future price movements ka tajziya karne mein madad dete hain.
Support Area
Support area wo level hota hai jahan price girne ke bawajood rukh rok jata hai aur wahan se upar ki taraf move karne lagta hai. Iska matlab hai ke buyers yahan market ko support dete hain. Jab price is level tak aati hai, toh demand itni barh jati hai ke sellers ki pressure ko rok leti hai.
Support ke Characteristics
Price Level: Ye wo level hota hai jahan market pehle bhi react kar chuki hoti hai.
Buyers’ Interest: Jab price support area tak aati hai, buyers ki interest increase hoti hai, jo market ko stable banata hai.
Volume Increase: Jab price support level pe aati hai, trading volume badh jata hai, jo price ko wapas upar ki taraf push karta hai.
Resistance Area
Resistance area wo level hai jahan price upar ki taraf move karne ke bawajood rok jati hai aur neeche ki taraf aane lagti hai. Iska matlab hai ke sellers wahan market ko resist karte hain. Jab price is level tak pohnchti hai, toh supply itni barh jati hai ke buyers ki pressure ko rok leti hai.
Resistance ke Characteristics
Price Level: Ye wo level hota hai jahan market ne pehle bhi resistance dikhaya hota hai.
Sellers’ Interest: Jab price resistance area tak pohnchti hai, sellers ki interest increase hoti hai, jo market ko niche ki taraf push karta hai.
Volume Increase: Jab price resistance level tak pohnchti hai, trading volume badh jata hai, jo price ko neeche ki taraf push karta hai.
Support aur Resistance ko Identify Karna
Historical Price Levels: Market ke historical data ko dekh kar aap support aur resistance levels identify kar sakte hain. Agar price kisi particular level pe baar-baar rukti hai, toh wo support ya resistance level ho sakta hai.
Trend Lines: Trend lines ko draw karke bhi support aur resistance areas ko identify kiya ja sakta hai. Agar trend line price ko baar-baar support ya resistance provide karti hai, toh wo significant level hota hai.
Technical Indicators: Kuch technical indicators, jaise Moving Averages aur Bollinger Bands, bhi support aur resistance levels ko highlight karne mein madad karte hain.
Support aur Resistance ka Role
Price Reversals: Jab price support area tak pohnchti hai aur phir upar move karti hai, ya resistance area tak pohnchti hai aur niche move karti hai, ye reversal points ban sakte hain.
Trend Continuation: Agar price support ya resistance area ko break karti hai, toh ye trend continuation ka signal ho sakta hai. Jaise agar price resistance ko break karti hai, toh uptrend continue ho sakta hai.
Entry and Exit Points: Traders support aur resistance areas ko apni entry aur exit points determine karne ke liye use karte hain. Agar price support area se bounce karti hai, toh traders buy kar sakte hain; agar resistance se bounce karti hai, toh traders sell kar sakte hain.
Support aur Resistance ki Dynamics
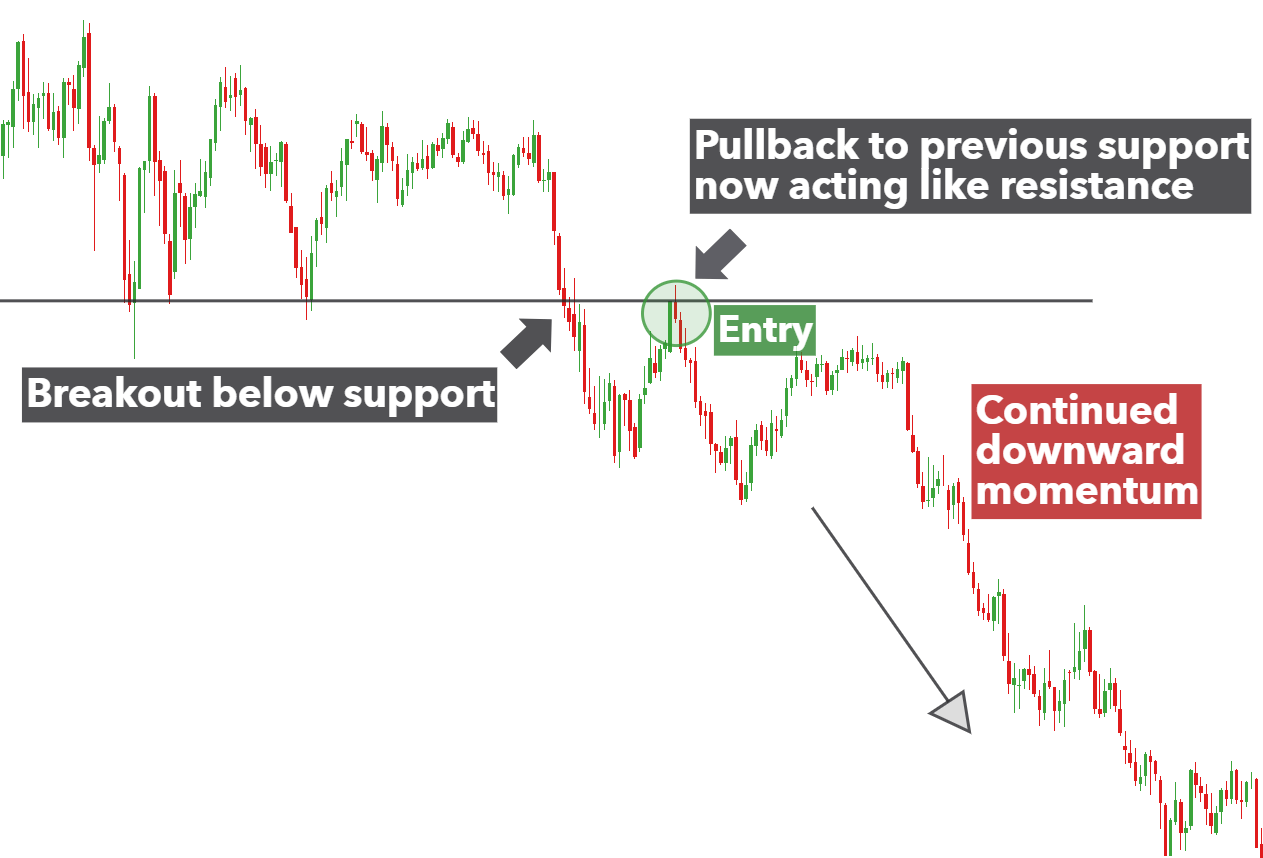
Role Reversal: Jab support level break hota hai, toh wo resistance ban sakta hai, aur vice versa. Ye role reversal market ki dynamics ko samajhne mein madad karta hai.
Multiple Touches: Agar price ek hi level pe multiple times touch hoti hai, toh wo level zyada strong support ya resistance ban jata hai. Zyada touches ka matlab hai ke wo level market ke liye significant hai.
Psychological Levels: Market mein kuch psychological levels bhi hote hain, jahan traders aur investors ka interest zyada hota hai, jaise round numbers (e.g., 1.3000, 1.3500). Ye levels bhi support aur resistance ki tarah kaam kar sakte hain.
Support aur Resistance ke Limitations
False Breakouts: Kabhi-kabhi price support ya resistance level ko break karti hai, lekin phir wapas uss level ke paas aa jati hai. Ye false breakouts hote hain aur traders ko confusion mein daal sakte hain.
Lagging Indicators: Technical indicators jo support aur resistance levels identify karte hain, wo lagging hote hain. Iska matlab hai ke wo price movements ke baad react karte hain, jo timely decisions ko mushkil bana sakta hai.
Market Conditions: Market conditions aur news events bhi support aur resistance levels ko impact kar sakte hain. In conditions ke badalne se support aur resistance levels bhi change ho sakte hain.
Conclusion
Support aur resistance areas forex trading mein fundamental concepts hain. Ye areas market ki behavior ko samajhne, future price movements ko predict karne, aur trading decisions ko improve karne mein madad karte hain. In concepts ko samajhkar aur effectively use karke traders apne trading strategies ko enhance kar sakte hain aur market mein behtar decisions le sakte hain...
-
<a href="https://www.instaforex.org/ru/?x=ruforum">InstaForex</a> -
mabdulrehmanSenior Member
- Jul 2024
- 2340
- 24
- 35
- 258 USD
Support and Resistance Area
Forex trading ka aik ahem concept "support and resistance" hai. Ye areas chart par woh levels hain jahan price aksar ruk jati hai ya phir reverses hoti hai. Ye levels traders ko yeh samajhne mein madad dete hain ke market kis direction mein move kar sakti hai.
Support Area
Support area wo level hota hai jahan price girne par rukti hai. Jab market kisi particular price level par aati hai aur wahan se upar ki taraf bounce karti hai, to usay support kaha jata hai. Ye area buyers ke liye ek aise level ki tarah hota hai jahan wo sochte hain ke price itni low nahi honi chahiye.
Jab price is support area ko break karti hai, to ye indicate karta hai ke market bearish ho sakti hai. Isliye, traders is area ko closely monitor karte hain, kyunki agar price yahan se wapas bounce karti hai, to ye buying opportunity ban sakti hai.
Resistance Area
Resistance area wo level hota hai jahan price increase hone par rukti hai. Jab market kisi particular price level par aakar wahan se neeche girti hai, to usay resistance kaha jata hai. Ye area sellers ke liye ek aisa level hota hai jahan wo sochte hain ke price itni high nahi honi chahiye.
Agar price is resistance area ko break karne mein successful hoti hai, to ye bullish market ka signal hota hai. Traders ke liye ye level ek opportunity ban sakta hai, kyunki agar price is area ko cross karti hai, to wo aur bhi high ja sakti hai.
Support and Resistance ke Importance
Support aur resistance levels ko samajhna bohot zaroori hai kyunki ye traders ko entry aur exit points identify karne mein madad dete hain. Jab traders ko ye levels maloom hote hain, to wo apne trades ko plan kar sakte hain aur risk management mein behter decisions le sakte hain.
Aksar traders in levels ko combine karte hain technical indicators ke saath, jaise ke Moving Averages ya RSI (Relative Strength Index), taake wo apni trading strategies ko mazid behtar bana sakein.
Conclusion
Support aur resistance areas ko samajhna forex trading mein ek key skill hai. In levels ki madad se traders market ki psychology ko samajh sakte hain aur apne trades ko effective tareeqe se manage kar sakte hain. Ye levels sirf numbers nahi hain; ye traders ki soch aur market ke behavior ka aik nishan hain. Isliye, trading mein inka asar samajhna zaroori hai. Aap jab bhi trading karein, hamesha support aur resistance levels ko nazar mein rakhein.
اب آن لائن
Working...
تبصرہ
Расширенный режим Обычный режим