Forex trading mein chart patterns seekhna traders ke liye aik ahem hunar ho sakta hai jo unke technical analysis ke hunar ko behtar banane mein madad karta hai. Chart patterns currency pair ki qeemat ke inhirafat ko visual tor par darust karta hai jo traders ko potential trend reversals, continuations, aur doosre ahem market movements ko pehchanne mein madad deta hai. In patterns ko samajhna aur pehchanne se traders zyada maahir trading faislay kar sakte hain.
Introduction to Chart Patterns
Chart patterns woh price movements se bante hain jo kisi currency pair ke dauran hoti hain, aur yeh market sentiment aur potential future price movements ke bare mein qeemati insights faraham kar sakte hain. Yeh patterns do mukhya categories mein taqseem kiye jate hain: continuation patterns aur reversal patterns.
Continuation patterns ka matlab hai ke mojooda trend ke jari rahne ki sambhavna hai, jabke reversal patterns ek mojooda trend ke rukh mein potential tabdili ko zahir karte hain. In patterns ko pehchanna traders ko future price movements ke bare mein pehle hi andaza lagane mein madad deta hai aur unhe apne trading strategies ko mutabiq adjust karne mein madad karta hai.
Aam Chart Patterns:
Reversal Patterns
Head aur Shoulders: Yeh pattern ek chat head ke sath do nichle chhaton shoulders ka ek peak banata hai, jo aik head aur shoulders ki shakal ko banata hai. Yeh bullish se bearish ya ulte uske ke trend ka potential reversal signify karta hai.
Double Top aur Double Bottom: Yeh patterns tab bante hain jab price do musalsal peaks double top ya do musalsal troughs double bottom tak pohanchti hai. Yeh mojooda trend ka potential reversal zahir karte hain.
Triple Top aur Triple Bottom: Double top aur double bottom patterns ki tarah, lekin teen peaks triple top ya teen troughs triple bottom ke sath, jo zyada taqatwar potential reversal signal ko zahir karta hai.
Continuation Patterns
Flags aur Pennants: Yeh patterns ek taqatwar price movement ke baad ek chhoti si muddat ki khamoshi ko zahir karte hain, aur phir mojooda trend ke jari rahne ka ishara dete hain. Flags rectangular shapes ki hoti hain, jabke pennants triangle shapes ki hoti hain.
Symmetrical Triangle: Yeh pattern tab banta hai jab price do milti julti trendlines ke darmiyan oscillate karta hai, jo market mein shak mein izhar karta hai. Yeh aksar kisi bhi rukh mein aane wale significant breakout ke pesh-nazar hota hai.
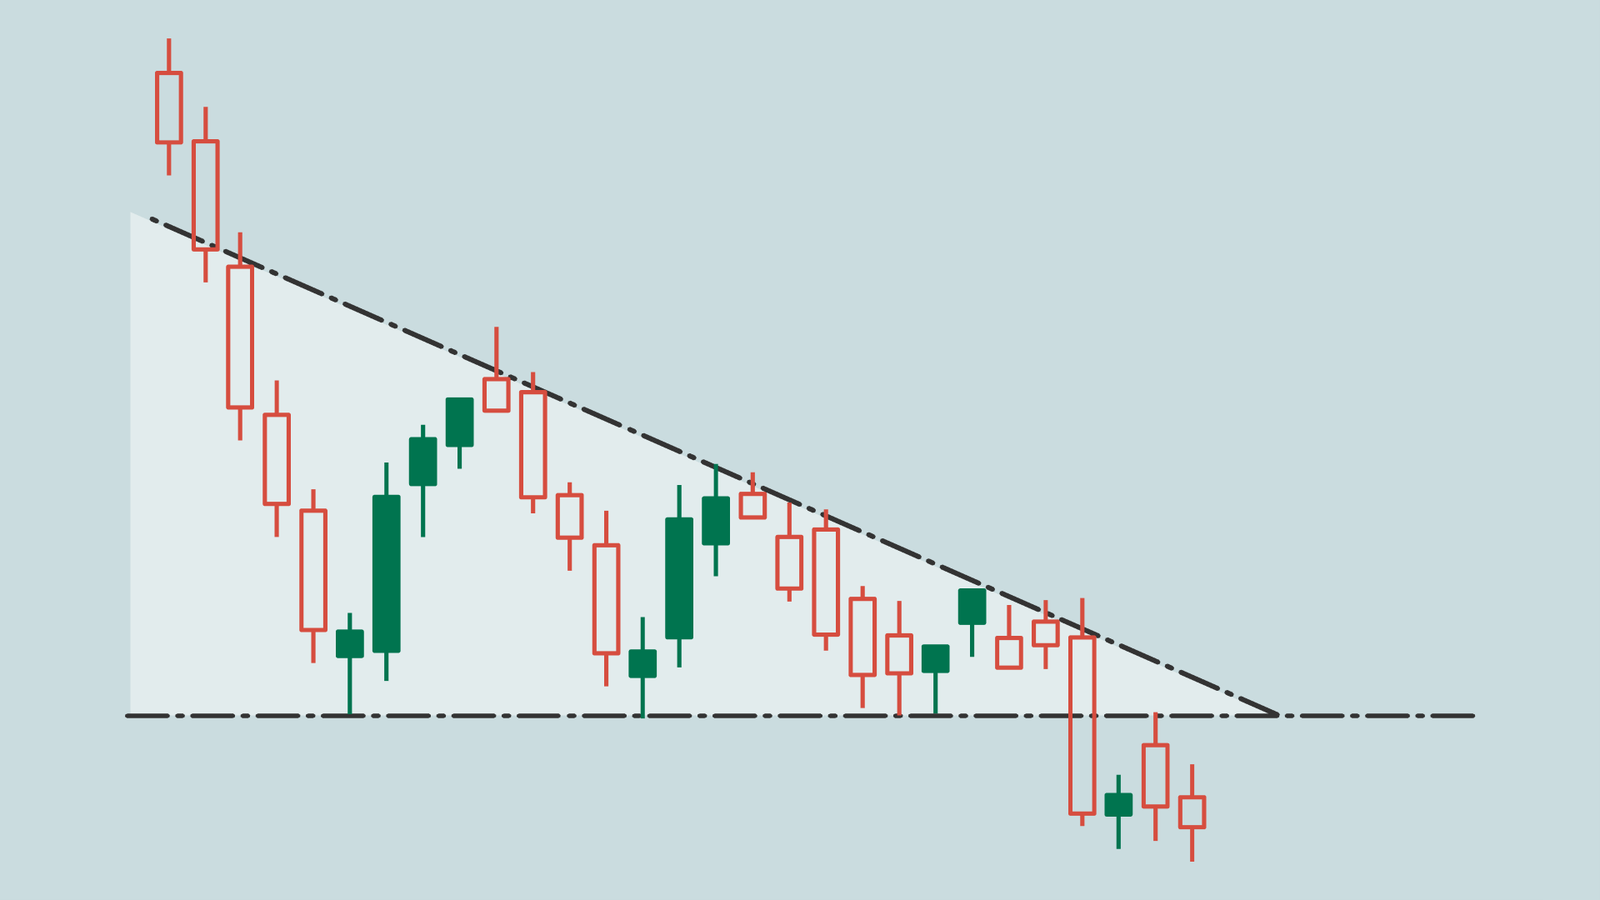
Ascending aur Descending Triangle: Ascending triangles mein aik seedha upper trendline aur ek rising lower trendline hoti hai, jabke descending triangles mein aik seedha lower trendline aur ek descending upper trendline hoti hai. Yeh patterns mojooda trend ke jari rahne ka ishara dete hain jab breakout hota hai.
Chart Patterns ki Ahmiyat
Chart patterns technical analysis ke liye qeemati tools hain kyun ke yeh traders ko market sentiment aur potential future price movements ke bare mein visual signals faraham karte hain. In patterns ko pehchanne se traders apne trading mein kab aur kahan dakhil hona hai, stop-loss levels set karne hain, aur risk ko effectively manage kar sakte hain.
Mazeed, chart patterns aksar mukhtalif time frames aur currency pairs mein dohrate hain, jis se unhe mukhtalif trading scenarios mein istemal kiya ja sakta hai. Traders mukhtalif patterns ki reliability ko backtest karke aur unke findings ke mutabiq profitable trading strategies develop kar sakte hain.
Chart Patterns Seekhne ka Tareeqa
Chart patterns seekhne ke liye nazariati ilm aur amli experience ka aik mixture zaroori hai. Yeh kuch steps hain jo chart patterns ko forex trading mein effectively seekhne aur maharat hasil karne ke liye istemal kiye ja sakte hain:
Educational Resources par Mutala karen
Shuruwat yeh karte hue ke books, online courses, tutorials, aur articles ke zariye mukhtalif chart patterns ke sath parhai karne se. Har pattern ke mool tajziyat aur khasiyat ko samajhna darust hai jo accurate identification ke liye zaroori hai.
Historical Charts par Practice karen
Historical price data ko analyze karne ke liye trading platforms ya charting software ka istemal karen aur chart patterns ko pehchanen. Mukhtalif market conditions mein yeh patterns kis tarah bante hain aur kis tarah ke asar daal sakte hain ko dekhne ka waqt guzaren.
Webinars aur Seminars Mein Shamil ho
Bohat se trading educators aur experienced traders technical analysis ke topics par webinars aur seminars conduct karte hain, jo chart patterns ko shamil karte hain. In sessions ko attend karke industry ke experts se insights hasil karen aur effective pattern recognition aur trading ke liye practical tips seekhen.
Trading Communities Mein Shamil ho
Online forums, social media groups, aur trading communities mein doosre traders ke sath interact karen chart patterns par discuss karne ke liye, apne insights share karen, aur har ek ki experiences se seekhen. Peers ke sath collaboration aapke learning process ko accelerate kar sakta hai aur aapki analysis par valuable feedback provide kar sakta hai.
Backtesting aur Paper Trading
Jab aap potential chart patterns ko pehchan lein, to inhe backtesting aur paper trading ke zariye sakhti se test karen. Historical data ko analyze karen takay aap apne pattern recognition skills ki accuracy aur profitability ko evaluate kar sakein, pehle live trading environments mein inhe implement karne se pehle.
Introduction to Chart Patterns
Chart patterns woh price movements se bante hain jo kisi currency pair ke dauran hoti hain, aur yeh market sentiment aur potential future price movements ke bare mein qeemati insights faraham kar sakte hain. Yeh patterns do mukhya categories mein taqseem kiye jate hain: continuation patterns aur reversal patterns.
Continuation patterns ka matlab hai ke mojooda trend ke jari rahne ki sambhavna hai, jabke reversal patterns ek mojooda trend ke rukh mein potential tabdili ko zahir karte hain. In patterns ko pehchanna traders ko future price movements ke bare mein pehle hi andaza lagane mein madad deta hai aur unhe apne trading strategies ko mutabiq adjust karne mein madad karta hai.
Aam Chart Patterns:
Reversal Patterns
Head aur Shoulders: Yeh pattern ek chat head ke sath do nichle chhaton shoulders ka ek peak banata hai, jo aik head aur shoulders ki shakal ko banata hai. Yeh bullish se bearish ya ulte uske ke trend ka potential reversal signify karta hai.
Double Top aur Double Bottom: Yeh patterns tab bante hain jab price do musalsal peaks double top ya do musalsal troughs double bottom tak pohanchti hai. Yeh mojooda trend ka potential reversal zahir karte hain.
Triple Top aur Triple Bottom: Double top aur double bottom patterns ki tarah, lekin teen peaks triple top ya teen troughs triple bottom ke sath, jo zyada taqatwar potential reversal signal ko zahir karta hai.
Continuation Patterns
Flags aur Pennants: Yeh patterns ek taqatwar price movement ke baad ek chhoti si muddat ki khamoshi ko zahir karte hain, aur phir mojooda trend ke jari rahne ka ishara dete hain. Flags rectangular shapes ki hoti hain, jabke pennants triangle shapes ki hoti hain.
Symmetrical Triangle: Yeh pattern tab banta hai jab price do milti julti trendlines ke darmiyan oscillate karta hai, jo market mein shak mein izhar karta hai. Yeh aksar kisi bhi rukh mein aane wale significant breakout ke pesh-nazar hota hai.
Ascending aur Descending Triangle: Ascending triangles mein aik seedha upper trendline aur ek rising lower trendline hoti hai, jabke descending triangles mein aik seedha lower trendline aur ek descending upper trendline hoti hai. Yeh patterns mojooda trend ke jari rahne ka ishara dete hain jab breakout hota hai.
Chart Patterns ki Ahmiyat
Chart patterns technical analysis ke liye qeemati tools hain kyun ke yeh traders ko market sentiment aur potential future price movements ke bare mein visual signals faraham karte hain. In patterns ko pehchanne se traders apne trading mein kab aur kahan dakhil hona hai, stop-loss levels set karne hain, aur risk ko effectively manage kar sakte hain.
Mazeed, chart patterns aksar mukhtalif time frames aur currency pairs mein dohrate hain, jis se unhe mukhtalif trading scenarios mein istemal kiya ja sakta hai. Traders mukhtalif patterns ki reliability ko backtest karke aur unke findings ke mutabiq profitable trading strategies develop kar sakte hain.
Chart Patterns Seekhne ka Tareeqa
Chart patterns seekhne ke liye nazariati ilm aur amli experience ka aik mixture zaroori hai. Yeh kuch steps hain jo chart patterns ko forex trading mein effectively seekhne aur maharat hasil karne ke liye istemal kiye ja sakte hain:
Educational Resources par Mutala karen
Shuruwat yeh karte hue ke books, online courses, tutorials, aur articles ke zariye mukhtalif chart patterns ke sath parhai karne se. Har pattern ke mool tajziyat aur khasiyat ko samajhna darust hai jo accurate identification ke liye zaroori hai.
Historical Charts par Practice karen
Historical price data ko analyze karne ke liye trading platforms ya charting software ka istemal karen aur chart patterns ko pehchanen. Mukhtalif market conditions mein yeh patterns kis tarah bante hain aur kis tarah ke asar daal sakte hain ko dekhne ka waqt guzaren.
Webinars aur Seminars Mein Shamil ho
Bohat se trading educators aur experienced traders technical analysis ke topics par webinars aur seminars conduct karte hain, jo chart patterns ko shamil karte hain. In sessions ko attend karke industry ke experts se insights hasil karen aur effective pattern recognition aur trading ke liye practical tips seekhen.
Trading Communities Mein Shamil ho
Online forums, social media groups, aur trading communities mein doosre traders ke sath interact karen chart patterns par discuss karne ke liye, apne insights share karen, aur har ek ki experiences se seekhen. Peers ke sath collaboration aapke learning process ko accelerate kar sakta hai aur aapki analysis par valuable feedback provide kar sakta hai.
Backtesting aur Paper Trading
Jab aap potential chart patterns ko pehchan lein, to inhe backtesting aur paper trading ke zariye sakhti se test karen. Historical data ko analyze karen takay aap apne pattern recognition skills ki accuracy aur profitability ko evaluate kar sakein, pehle live trading environments mein inhe implement karne se pehle.

تبصرہ
Расширенный режим Обычный режим