Aslam u alaikum,
Dear forex member umeed karta hun aap sab khairiyat se honge aur forex market sa daily basis per ak acha gain le raha hon ga. Dear forex trading ak risky business ha is man traders ko bhot losses hota han, is liye forex trading ko acha sa seekh ker karen. Aur secure trading k liye Money Management aur Risk Management ko lazmi follow karen.
Importance of '"Chart Patterns'" in forex trading:
Forex trading k doran trader currency pairs aur commodities ki price movements ko smajhna k liye price chart ko read kerta ha, q k price chart patterns man changes, momentum aur price k trend man change ko accuracy k sath identify kerta ha. Chart Patterns currency pairs aur commodities k price chart man price ki movement ko track kerna k liye use hona wala most important technical tool ha. Traders forex trading man kisi b currency pair ya commodity ko buy/sell kerna k liye chart patterns per depend kerta ha. Is liye aj man apka sath ak important aur currency pairs aur commodities k price chart man commonly banna wala chart pattern per apna knowledge apka sath share kerta hon.
Ascending Triangle Chart Pattern:
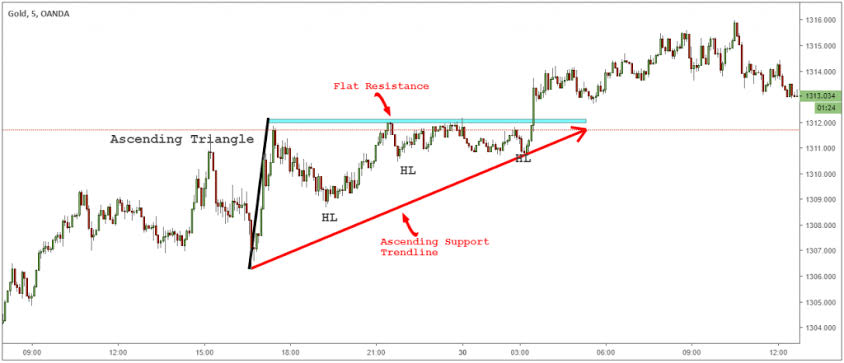
Ascending Triangle Chart Pattern ak bullish trend reversal chart pattern ha, jo currency pairs aur commodities k price chart man long bullish trend k top per banta ha. Ascending Triangle Chart Pattern ak consolidation pattern ha, jis man price ki movement man continuous decrease ata ha. Aur jab trader market price k swing high ko aur swing low ko trend sa jorta ha to upper trend line flate hoti ha jo is pattern man resistance level k tor per work kerti ha aur lower trend line positive slope banati ha. Ascending Triangle Chart Pattern per trading k liye trader price k upper trend line (resistance level) k breakout ka wait kerta ha.
Trading with Ascending Triangle Chart Pattern:
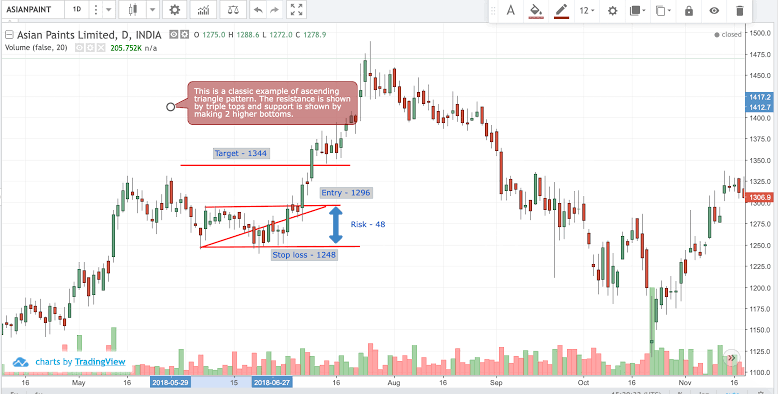
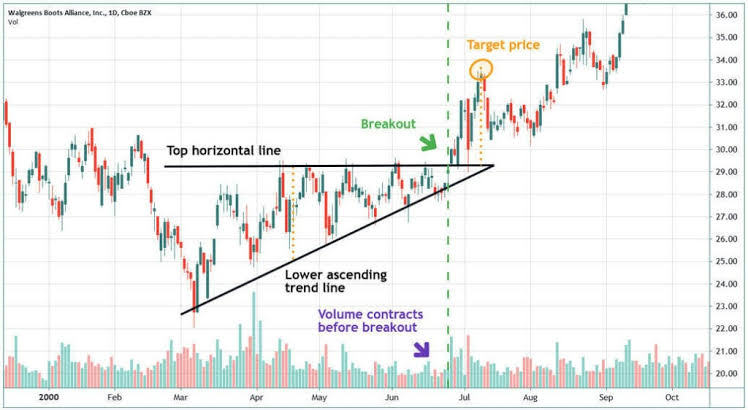
Ascending Triangle Chart Pattern per trading kerna k liye trader ko is pattern ki formation k complete hona ka wait kerna chaheye. Is pattern k complete hona per price upper trend line (resistance level) ko break kerti ha. Jab price upper trend line k pass phonch ker candle ka close upper trend line sa oper de da to is sa breakout ki confirmation ho jati ha, aur is terha ye pattern complete ho jata ha. Trader ko chaheye k breakout k bad jab price upper trend line ko retest kerti ha to is per trader ko ""Buy ki Trade"" active kerni chaheye.
Stoploss and Take Profit:
Forex trading man koi b trader 100% accurate nahe ho sakta ha is liye trader ko market price ki reverse movement ko mind man rukhta howa Stoploss aur Take Profit ko use kerna chaheye. Ascending Triangle Chart Pattern per trading k doran trader ko Stoploss is pattern ki last swing low sa nicha place kerna chaheye aur Take Profit ko is pattern ki first price k swing low aur high k dermiyan distance k baraber oper place kerna chaheye.
Dear forex member umeed karta hun aap sab khairiyat se honge aur forex market sa daily basis per ak acha gain le raha hon ga. Dear forex trading ak risky business ha is man traders ko bhot losses hota han, is liye forex trading ko acha sa seekh ker karen. Aur secure trading k liye Money Management aur Risk Management ko lazmi follow karen.
Importance of '"Chart Patterns'" in forex trading:
Forex trading k doran trader currency pairs aur commodities ki price movements ko smajhna k liye price chart ko read kerta ha, q k price chart patterns man changes, momentum aur price k trend man change ko accuracy k sath identify kerta ha. Chart Patterns currency pairs aur commodities k price chart man price ki movement ko track kerna k liye use hona wala most important technical tool ha. Traders forex trading man kisi b currency pair ya commodity ko buy/sell kerna k liye chart patterns per depend kerta ha. Is liye aj man apka sath ak important aur currency pairs aur commodities k price chart man commonly banna wala chart pattern per apna knowledge apka sath share kerta hon.
Ascending Triangle Chart Pattern:
Ascending Triangle Chart Pattern ak bullish trend reversal chart pattern ha, jo currency pairs aur commodities k price chart man long bullish trend k top per banta ha. Ascending Triangle Chart Pattern ak consolidation pattern ha, jis man price ki movement man continuous decrease ata ha. Aur jab trader market price k swing high ko aur swing low ko trend sa jorta ha to upper trend line flate hoti ha jo is pattern man resistance level k tor per work kerti ha aur lower trend line positive slope banati ha. Ascending Triangle Chart Pattern per trading k liye trader price k upper trend line (resistance level) k breakout ka wait kerta ha.
Trading with Ascending Triangle Chart Pattern:
Ascending Triangle Chart Pattern per trading kerna k liye trader ko is pattern ki formation k complete hona ka wait kerna chaheye. Is pattern k complete hona per price upper trend line (resistance level) ko break kerti ha. Jab price upper trend line k pass phonch ker candle ka close upper trend line sa oper de da to is sa breakout ki confirmation ho jati ha, aur is terha ye pattern complete ho jata ha. Trader ko chaheye k breakout k bad jab price upper trend line ko retest kerti ha to is per trader ko ""Buy ki Trade"" active kerni chaheye.
Stoploss and Take Profit:
Forex trading man koi b trader 100% accurate nahe ho sakta ha is liye trader ko market price ki reverse movement ko mind man rukhta howa Stoploss aur Take Profit ko use kerna chaheye. Ascending Triangle Chart Pattern per trading k doran trader ko Stoploss is pattern ki last swing low sa nicha place kerna chaheye aur Take Profit ko is pattern ki first price k swing low aur high k dermiyan distance k baraber oper place kerna chaheye.