Head and Shoulders:
Ye ek classic reversal pattern hai, jo ke teen peaks se bana hota hai: a higher peak head do lower peaks shoulders ke darmiyan. Ye pattern bullish se bearish ya ulta hone ke liye ek trend reversal ko darust karti hai. Traders aksar neckline ka istemal karte hain, jo ke dono shoulders ke lows ko jornay wala ek line hota hai, potential entry ya exit points ke liye.
Double Top and Double Bottom:
Double Top pattern ek uptrend ke baad aata hai aur ek potential reversal ko darust karta hai. Isme do peaks hote hain jo ke lagbag barabar ke price level par hote hain, ek trough ke darmiyan. Ulti sthiti mein, Double Bottom pattern ek downtrend ke baad aata hai aur ek potential bullish reversal ko darust karta hai. Traders in patterns ki tasdeeq se pehle trading faislay karne mein madad lete hain.
Triangles:
Triangles, converging trendlines ke zariye bane hue continuation patterns hain. Inme teen mukhtalif qisam hain: ascending triangles, descending triangles, aur symmetrical triangles. Ascending triangles ek bullish continuation ko dikhate hain, jabke descending triangles ek bearish continuation ko ishara karte hain. Symmetrical triangles ye batate hain ke market pichle trend se bahar nikalne se pehle consolidate ho raha hai.
Flags and Pennants:
Flags aur pennants chhoti muddat ke continuation patterns hain jo ke pehle ke trend ka dobara shuru hone se pehle ek chota consolidation period darust karte hain. Flags rectangular hote hain, jabke pennants chhote symmetrical triangles hote hain. Traders strong price movement ke baad potential entry points ko pehchanne ke liye in patterns ka istemal karte hain.
Cup and Handle:
Cup and Handle pattern ek bullish continuation pattern hai jo ke ek chai ki cup ki shakal mein hota hai. Isme ek round bottom cup hoti hai, phir aik consolidation period handle aata hai. Traders handle ke resistance level ke upar breakout ka intezar karte hain taake wo long position mein dakhil ho sakein.
Wedges:
Wedges patterns hote hain jo converging trendlines se maloom hota hai, jo ke ya to oopar ki taraf slope karte hain rising wedge ya neeche ki taraf falling wedge. Rising wedges aksar bearish reversal ka nashana bante hain, jabke falling wedges bullish reversal ka sabab ban sakte hain. Traders breakout direction par tawajjuh dete hain potential trading mauka daryaft karne ke liye.
Gaps:
Gaps tab hota hain jab price kisi se pehle close se bohot zyada oopar ya neeche khulta hai. Aam types mein breakaway gaps, continuation gaps, aur exhaustion gaps shamil hain. Traders gaps ko doosre technical indicators ke sath milake tafseel se tajziya karte hain taake wo informe faislay le sakein.
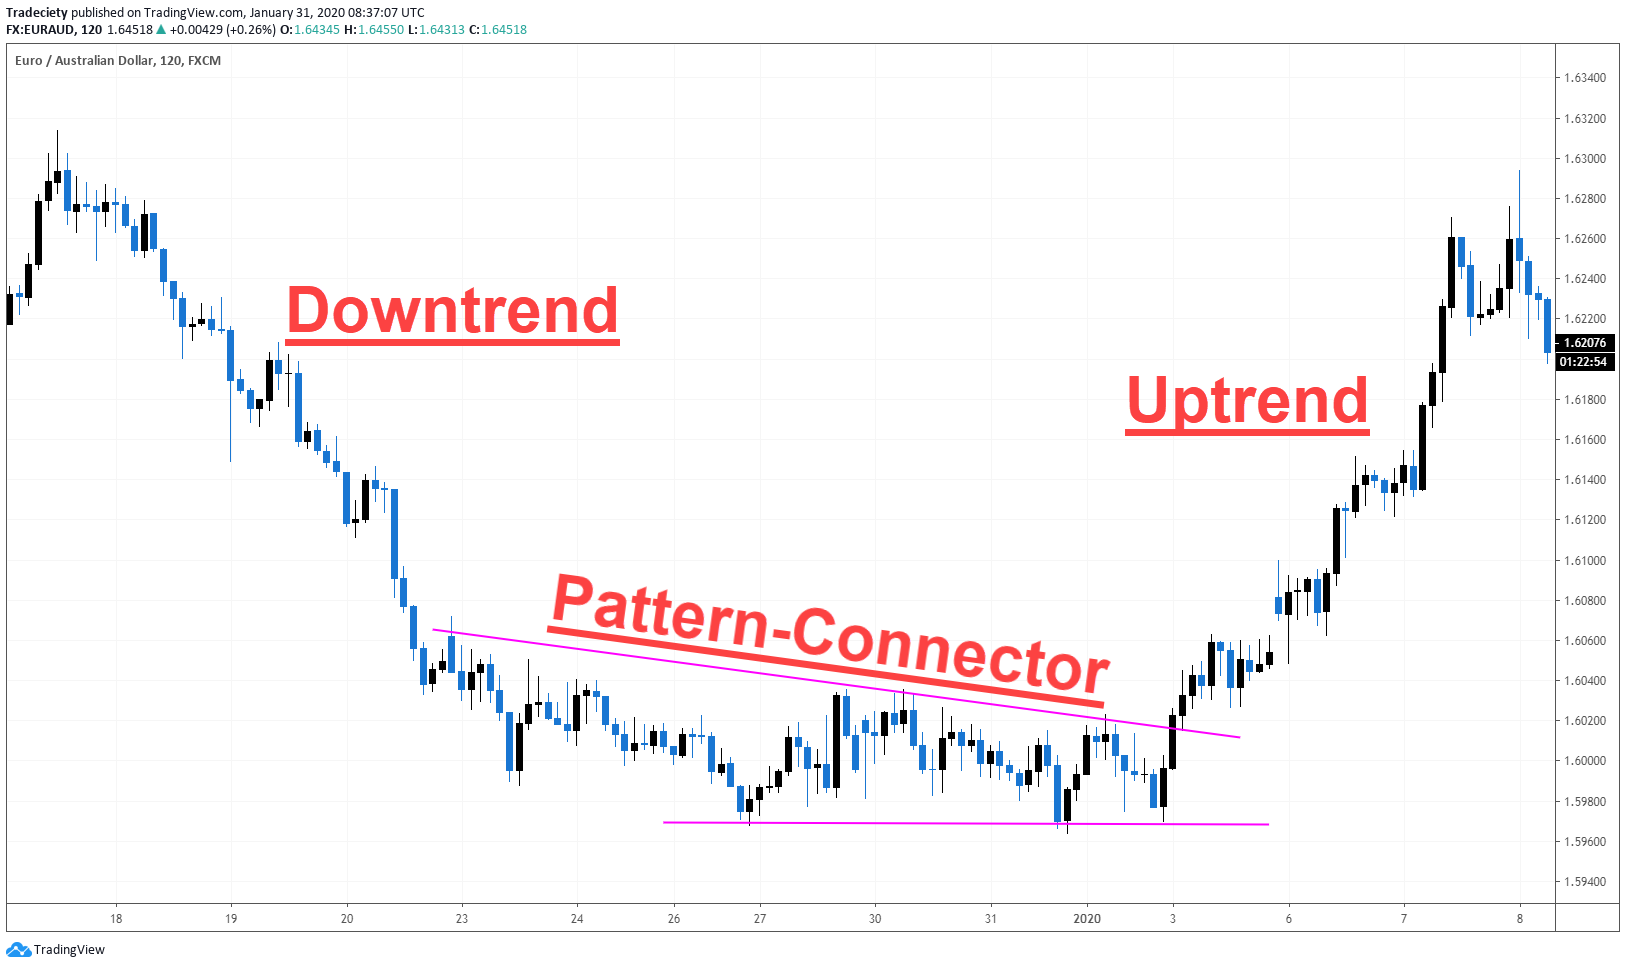
Rounding Bottom Saucer:
Rounding Bottom, jo ke Saucer pattern bhi kehlata hai, ek lambi muddat ka reversal pattern hai. Isme prices ki gradual bottoming hoti hai, jo ke downtrend se uptrend ki taraf ki taraf ishara karta hai. Traders aksar ek confirm breakout ka intezar karte hain ke unhain ek position mein dakhil ho sakte hai.
Ye ek classic reversal pattern hai, jo ke teen peaks se bana hota hai: a higher peak head do lower peaks shoulders ke darmiyan. Ye pattern bullish se bearish ya ulta hone ke liye ek trend reversal ko darust karti hai. Traders aksar neckline ka istemal karte hain, jo ke dono shoulders ke lows ko jornay wala ek line hota hai, potential entry ya exit points ke liye.
Double Top and Double Bottom:
Double Top pattern ek uptrend ke baad aata hai aur ek potential reversal ko darust karta hai. Isme do peaks hote hain jo ke lagbag barabar ke price level par hote hain, ek trough ke darmiyan. Ulti sthiti mein, Double Bottom pattern ek downtrend ke baad aata hai aur ek potential bullish reversal ko darust karta hai. Traders in patterns ki tasdeeq se pehle trading faislay karne mein madad lete hain.
Triangles:
Triangles, converging trendlines ke zariye bane hue continuation patterns hain. Inme teen mukhtalif qisam hain: ascending triangles, descending triangles, aur symmetrical triangles. Ascending triangles ek bullish continuation ko dikhate hain, jabke descending triangles ek bearish continuation ko ishara karte hain. Symmetrical triangles ye batate hain ke market pichle trend se bahar nikalne se pehle consolidate ho raha hai.
Flags and Pennants:
Flags aur pennants chhoti muddat ke continuation patterns hain jo ke pehle ke trend ka dobara shuru hone se pehle ek chota consolidation period darust karte hain. Flags rectangular hote hain, jabke pennants chhote symmetrical triangles hote hain. Traders strong price movement ke baad potential entry points ko pehchanne ke liye in patterns ka istemal karte hain.
Cup and Handle:
Cup and Handle pattern ek bullish continuation pattern hai jo ke ek chai ki cup ki shakal mein hota hai. Isme ek round bottom cup hoti hai, phir aik consolidation period handle aata hai. Traders handle ke resistance level ke upar breakout ka intezar karte hain taake wo long position mein dakhil ho sakein.
Wedges:
Wedges patterns hote hain jo converging trendlines se maloom hota hai, jo ke ya to oopar ki taraf slope karte hain rising wedge ya neeche ki taraf falling wedge. Rising wedges aksar bearish reversal ka nashana bante hain, jabke falling wedges bullish reversal ka sabab ban sakte hain. Traders breakout direction par tawajjuh dete hain potential trading mauka daryaft karne ke liye.
Gaps:
Gaps tab hota hain jab price kisi se pehle close se bohot zyada oopar ya neeche khulta hai. Aam types mein breakaway gaps, continuation gaps, aur exhaustion gaps shamil hain. Traders gaps ko doosre technical indicators ke sath milake tafseel se tajziya karte hain taake wo informe faislay le sakein.
Rounding Bottom Saucer:
Rounding Bottom, jo ke Saucer pattern bhi kehlata hai, ek lambi muddat ka reversal pattern hai. Isme prices ki gradual bottoming hoti hai, jo ke downtrend se uptrend ki taraf ki taraf ishara karta hai. Traders aksar ek confirm breakout ka intezar karte hain ke unhain ek position mein dakhil ho sakte hai.
