Butterfly Candlestick Chart Pattern

No announcement yet.
`
X
  • وقت
  • دکھائیں
Clear All
new posts
  • #1 Collapse

    Butterfly Candlestick Chart Pattern
    Assalamualaikum!

    Dear friend Kya hal hain umeed krta hon k ap sab kheriat sy hon gy our forex market mn acha kam kr rhe hon gy dosto aj ka hmara topic bhot he important h aj hm butterfly candlestick chart pattern k bary mn discuss krien gy.

    What is Butterfly candlestick chart pattern?

    Butterfly candlestick pattern ek technical analysis concept hai jo stock market aur financial markets mein istemal hota hai. Ye pattern traders ko market trends ko samajhne aur trading decisions lene mein madadgar hota hai. Butterfly pattern ko samajhne ke liye, apko candlestick charts ka istemal karna hoga, jo market ki price movements ko graphically darust dikhate hain.Butterfly candlestick pattern ek specific reversal pattern hai, jiska mukhya uddeshya market ke trend mein hone wale changes ko pesh karna hai. Is pattern mein, chand candlesticks ek khas tarah se arrange hoti hain.
    Click image for larger version

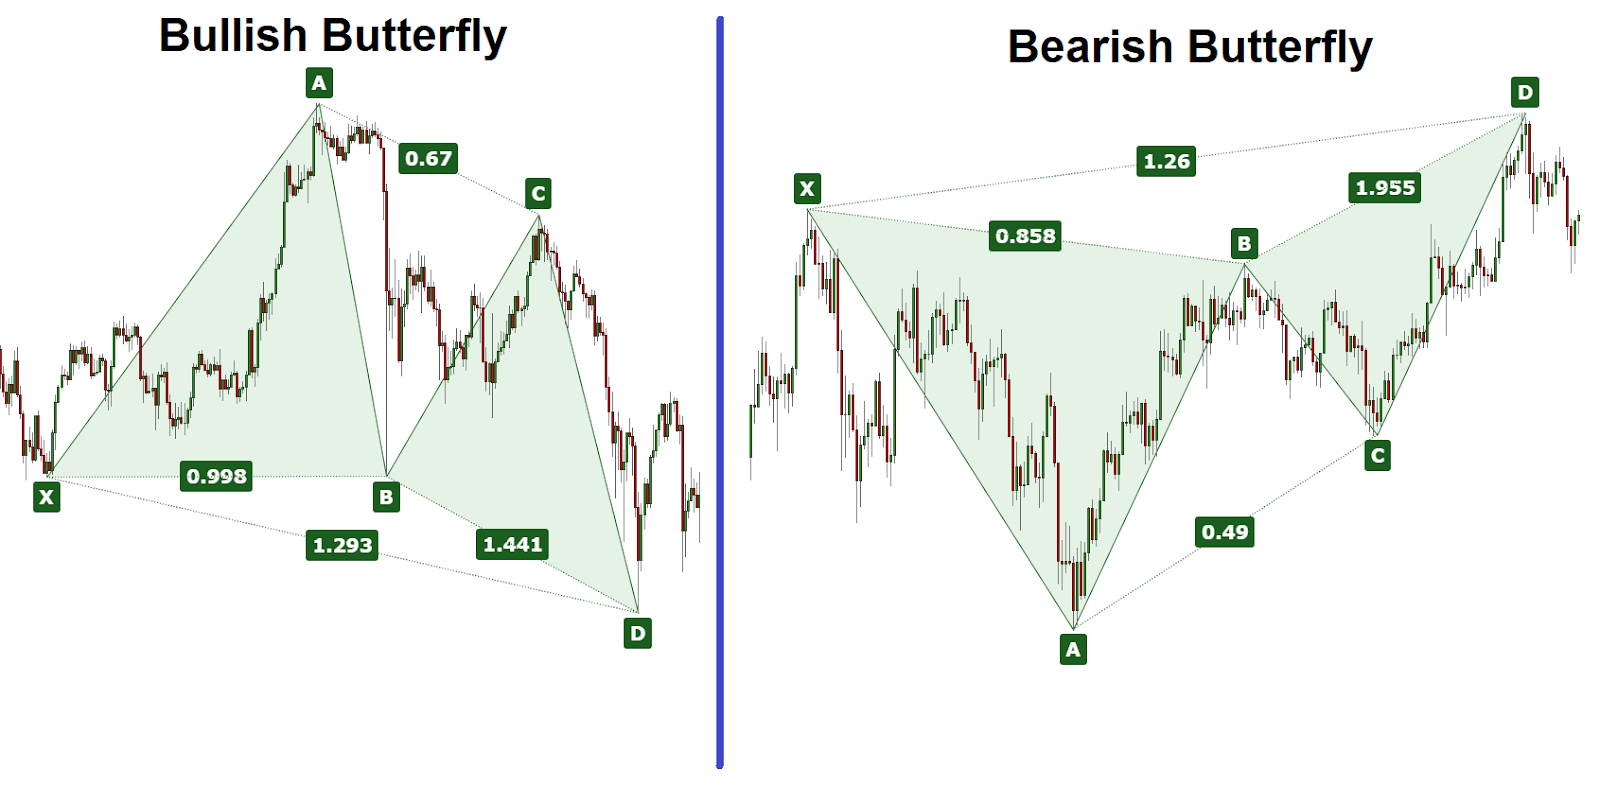
Name:	Bullish_and_Bearish_Butterfly.png
Views:	202
Size:	192.8 کلوبائٹ
ID:	12777810


    Pattern ko pehchanne ke liye, neeche diye gaye kuch steps ko follow kiya jata hai:

    Pehla Step (Starting Point):

    Butterfly pattern ka pehla step hota hai "X-A" leg, jahan se pattern ki shuruaat hoti hai. Is mein price uptrend mein hoti hai.

    Dusra Step (Price Reversal):

    X-A leg ke baad, market mein price mein ek reversal hota hai aur ye "A-B" leg ke roop mein dikhta hai. Is leg mein price down movement dikhata hai.

    Tisra Step (Retracement):

    Iske baad, market mein thoda sa retracement hota hai, jo "B-C" leg ke roop mein hota hai. Yahan par price phir se kuch had tak upar ja sakti hai.

    Choutha Step (Final Reversal):

    Butterfly pattern ka antim step hota hai "C-D" leg, jahan par price phir se down movement karta hai. Is leg mein price reversal hoti hai aur overall trend change hota hai.Pattern ko pehchanne ke liye, neeche diye gaye kuch steps ko follow kiya jata hai:


    Click image for larger version

Name:	0_butterfly.jpg
Views:	151
Size:	119.2 کلوبائٹ
ID:	12777811


    Butterfly pattern ko samajhne ke liye, main aapko uski components aur unke matlab ke bare mein batata hoon:

    Swing High (SH):

    Swing high ek point hai jahan price ek uptrend ke dauran highest level tak pahunchti hai.

    Swing Low (SL):

    Swing low ek point hai jahan price ek downtrend ke dauran lowest level tak pahunchti hai.

    XA Leg:

    XA leg butterfly pattern ka starting point hota hai. Yeh ek impulse move hota hai aur price ka ek significant swing hota hai. Is leg ko draw karne ke liye SH se SL tak line banayi jati hai.

    AB Leg:

    AB leg XA leg ke bad ka retracement move hota hai. Is leg mein price XA leg ki kuch had tak reverse hoti hai. Is leg ko draw karne ke liye SL se kisi resistance level tak line banayi jati hai.

    BC Leg:

    BC leg AB leg ka retracement move hota hai. Yeh leg AB leg ke levels ke bich mein rehta hai. Is leg ko draw karne ke liye AB leg ka Fibonacci retracement level 0.382 ya 0.618 ka use hota hai.

    CD Leg:

    CD leg butterfly pattern ka final leg hota hai. Yeh ek extension move hota hai, jahan price BC leg ke level se reverse hoti hai. Is leg ko draw karne ke liye BC leg ke high point tak line banayi jati hai.

    Explanation:


    Butterfly pattern ke peechle logic yeh hai ki isse market mein trend reversal ko pesh kiya jata hai. Agar aap market mein uptrend dekh rahe hain aur butterfly pattern detect hota hai, to iska matlab hai ki market mein downtrend hone ke chances hain. Yadi aap market mein downtrend dekh rahe hain aur butterfly pattern detect hota hai, to iska matlab hai ki market mein uptrend hone ke chances hain.Is pattern ko trading decisions lene mein istemal kiya ja sakta hai. Agar aapko lagta hai ki butterfly pattern market mein hone wale trend reversal ko indicate kar raha hai, to aap apni trading strategy ko usi disha mein adjust kar sakte hain. Yani ki, agar aap uptrend mein hain aur butterfly pattern detect hota hai, to aap short positions le sakte hain ya existing long positions ko close kar sakte hain.Is pattern ki safalti ke liye, traders ko candlestick chart analysis ki acchi samajh honi chahiye aur is pattern ko dusre technical indicators ke saath milakar istemal karna chahiye. Iske alawa, risk management bhi mahatvapurn hai, taki trading losses ko kam kiya ja sake.Butterfly candlestick pattern ek powerful tool ho sakta hai, lekin yeh kisi bhi trading decision ko confirm nahi karta hai. Market mein risk hamesha hota hai, isliye traders ko hamesha savdhan rehna chahiye aur apni research aur analysis ko mazbut banaye rakhna chahiye.


    Thanks for Attention.
  • <a href="https://www.instaforex.org/ru/?x=ruforum">InstaForex</a>
  • #2 Collapse


    Butterfly Candlestick Chart Pattern, candlestick chart analysis mein ek specific reversal pattern hai. Is pattern mein, market ki direction ko badalne ka ishara hota hai, aur traders isse potential trading opportunities ke liye istemal karte hain. Butterfly pattern doosre candlestick patterns ki tarah hota hai, aur iska main uddeshya market ke direction ke changes ko pesh karne mein madad karna hota hai.

    Butterfly Candlestick Pattern ki wazahat:

    Bullish Butterfly Pattern:
    1. Starting Point: Bullish Butterfly pattern ek bearish trend ke bich se shuru hota hai, yani market pehle ek downtrend mein hota hai.
    2. First Downward Move: Pehle stage mein, market ek downward move ka record rakhta hai, jo ek strong bearish candle ke sath hota hai.
    3. Reversal: Dusre stage mein, ek reversal candle hota hai, jise doji candle ke roop mein dekha jaa sakta hai. Yeh doji candle pehle bearish candle ke neeche hota hai.
    4. Second Downward Move: Teesre stage mein, market ek aur downward move ka record rakhta hai, jo pehle downward move se kam hota hai, lekin phir bhi bearish hota hai.
    5. Reversal: Aakhri stage mein, ek aur reversal candle hota hai, jise doji candle ke roop mein dekha jaa sakta hai. Is doji candle ka close pehle doji candle ke upper hota hai.

    Interpretation:

    Bullish Butterfly pattern, bearish trend ke baad hone wale reversal ke pehchanne ka ishara deta hai. Is pattern ko jab dekha jaata hai, to traders bullish (upward) reversal ki sambhavnaon ko samajhte hain.

    Bearish Butterfly Pattern:
    1. Starting Point: Bearish Butterfly pattern ek bullish trend ke bich se shuru hota hai, yani market pehle ek uptrend mein hota hai.
    2. First Upward Move: Pehle stage mein, market ek strong bullish candle ke sath ek upward move ka record rakhta hai.
    3. Reversal: Dusre stage mein, ek reversal candle hota hai, jise doji candle ke roop mein dekha jaa sakta hai. Yeh doji candle pehle bullish candle ke upper hota hai.
    4. Second Upward Move: Teesre stage mein, market ek aur upward move ka record rakhta hai, jo pehle upward move se kam hota hai, lekin phir bhi bullish hota hai.
    5. Reversal: Aakhri stage mein, ek aur reversal candle hota hai, jise doji candle ke roop mein dekha jaa sakta hai. Is doji candle ka close pehle doji candle ke neeche hota hai.

    Interpretation:

    Bearish Butterfly pattern, bullish trend ke baad hone wale reversal ke pehchanne ka ishara deta hai. Is pattern ko jab dekha jaata hai, to traders bearish (downward) reversal ki sambhavnaon ko samajhte hain.

    Remember that Butterfly patterns, jaise ke kisi bhi technical analysis pattern, hamesha 100% kamyaab nahi hote. Market conditions aur doosre factors ko madde nazar rakhte hue trading decisions lena zaroori hai. Isi liye, Butterfly pattern ko doosre technical aur fundamental analysis techniques ke sath istemal karna ahem hota hai.


    • #3 Collapse

      Butterfly candlestick pattern :

      Butterfly candlestick pattern ek reversal pattern hai jo price action analysis mein use hota hai. Is pattern mein ek strong move ke baad do small moves hote hain, jo ek butterfly ki shape banate hain. Ye pattern bullish ya bearish trend ke reversal ko indicate kar sakta hai. Butterfly candlestick pattern ko identify karne ke liye, aapko candlestick chart par dhyan dena hoga. Is pattern ko dhundne ke liye, aapko pehle ek strong move dekhna hoga, phir uske baad do small moves jo ek butterfly ki shape banate hain. Is pattern mein middle candlestick pe price ka reversal hota hai.

      Click image for larger version

Name:	images.jpeg
Views:	134
Size:	63.8 کلوبائٹ
ID:	12780034

      Butterfly candlestick pattern strategy :

      Butterfly candlestick pattern ki strategy mein aap ek bullish ya bearish reversal ki expectation rakhte hain. Agar aapko bullish reversal expect hai, toh aap long position le sakte hain jab price middle candlestick ke high level ko break kar leta hai. Aur agar aapko bearish reversal expect hai, toh aap short position le sakte hain jab price middle candlestick ke low level ko break kar leta hai. Stop loss aur target levels ko apne risk tolerance ke hisab se set karna na bhulein.

      Characteristics of Butterfly Pattern :

      Butterfly candlestick pattern ke kuch key characteristics hai:
      - Is pattern mein ek strong move ke baad do small moves hote hain, jo ek butterfly ki shape banate hain.
      - Middle candlestick ka size chhota hota hai compared to the other two candlesticks.
      - Middle candlestick ka open price previous candlestick ke close price se neeche hota hai.
      - Middle candlestick ka close price previous candlestick ke half tak pahunchta hai.
      - Is pattern mein middle candlestick ke baad ek strong reversal dekhne ko mil sakta hai.
       
      • #4 Collapse

        What is the Butterfly pattern and how does it work?


        ziyada Maroof graph dizaynon se mukhtalif, gartly design sakht febonaci tanasub se kaam karte hain. sab se mashhoor dizaynon mein se aik consowant butter flayi design hai. titlee misalon ke samfony group ka aik tukda hai, jis mein gartly, chimgaadar, kekray, aur pait ke pathon ki disk jaisi mukhtalif trqyat shaamil hain. yeh aik paanch nakati ulta khaka design hai jisay taajiron ke zareya khusoosi imthehaan mein istemaal kya jata hai taakay talaash ke lamhaat ko pehchanney mein madad ki jasakay. yeh aik khaas shakal aur misaal ke har taang ke darmiyan faaslay ke sath aik tabadlah design hai .


        misaal ka khaka drawing chaar paish riftoon par mushtamil hai jo aylyot lehron ki terhan nazar aati hai aur misaal ki tashkeel karti hai. turn foksaiz aur value driving forces ko aam tor par huroof ke sath allag kya jata hai. mutlaq ibtidayi tor par x taang hai, usay ibtidayi marhalay x se tayyar kya gaya hai aur nuqta a ke sath band kya gaya hai, jo poori taraqqi ka sab se qabil zikar ya mutlaq neechay hai. phir, is waqt, section pait ke pathon, bc, aur compact disk ghair mutawaqqa ke rush par aahista aahista zahir hotay hain .


        aik nuqta nazar se, butterfly consonant ki misaal aik ulta tabadlah design hai. is ke mukammal honay ke baad, laagat zabardasti badal jati hai aur aik directional drive ( oopar ki screen capture mein niilii lakeer ) banati hai. kisi bhi soorat mein, is soorat mein ke aap duniya bhar mein ziyada nazar atay hain, paros ka ulta design aksar aik barray patteren ke aaghaz ka jhanda lagaata hai .


        Butterfly harmonic pattern history


        hum ahangi ke tabadlay ka tareekhi pas manzar 1935 se shuru hota hai. aik mashhoor market master aur khusoosi muaina car, herald make kanly gartly ne laagat ki sar garmion ke design banaye hain jin ke baray mein unhon ne khufia mulakaton mein tawajah di aur jaanch ki hai. baad mein is ne apni kitaab benefits un di financial exchange mein gartly design ke tabadlay ki hikmat e amli ki tafseel ki tasweer kashi ki, jisay kansowant misalon par parhnay ke aik misali course ke tor par dekha jata hai .


        paanch nakati laagat ki taraqqi, jisay baad mein gartly butter flayi design kaha jata hai, brice gamlor ne paaya. kisi bhi soorat mein, tareef abhi naye tareeqa par nahi aayi. beeswin 100 saal ke ekhtataam par khusoosi imthehaan mein kansowant ka tabadlah aam ho gaya. is waqt, gartly ke kaam ko is ke aqeedat mandoon, scot am karni aur liri piswanto ne khatam kya tha aur is mein tarmeem ki thi. aakhri option ne febonaci tanasub ko paish kya, jo kisi ko ziyada durust tareeqay se faisla karne aur laagat mein honay wali paish Raft ko numaya karne ke liye baakhtyar banata hai. herat angaiz febonaci retracemt wali titlee ko piswanto butter flayi kaha jata hai .


        jaisa ke wahan gartly ke naye qisam ke design dukhaay jatay hain, un ke imtiazi saboot ki tknikin bhi badal jati hain. dealers phir kabhi jismani tor par tosiay le outd ki talaash nahi karte hain phir bhi metatrader aur mukhtalif marahil mein khusoosi markr istemaal karte hain .


        How to identify the Butterfly pattern chart pattern


        hamein yeh maloom karna chahiye ke aap dayagram mein butter flayi ki samfony misaal ko kaisay pehchan satke hain. jaisa ke mein ne pehlay tehreer kya tha, yeh misaal chaar lehron se bani hai. un mein se har aik aik dosray se jura sun-hwa hai jaisa ke taraqiyati usoolon ke zareya ishara kya gaya hai. jab bhi aap gartly ke mumkina design ko allag karte hain, har shart ko poora karne ke liye aik point shaamil karen. development score ko paanch fox mantay hue, aap ko yaqeen dilana chahiye ke yeh gartly design aik butter flayi hai aur aykschinjz daakhil karen jaisa ke is tarteeb se ishara kya gaya hai
        • #5 Collapse


          butterfly candlestick chart pattern


          Aghaaz (Introduction):


          Butterfly candlestick chart pattern ek technical analysis tool hai jo financial markets mein istemal hota hai. Ye pattern market trend ki prediction ke liye istemal hota hai aur traders ko potential reversals ka pata lagane mein madad karta hai.

          Butterfly Pattern Ki Pehchan (Identification of Butterfly Pattern):


          Butterfly pattern ko pehchan'ne ke liye trader ko candlestick charts par dhyan dena hota hai. Is pattern mein typically chaar candles shamil hote hain jinmein specific price movements dekhe ja sakte hain.

          Pehli Candle (First Candle):


          Butterfly pattern ki shuruaat ek lambi bullish candle se hoti hai, jo market mein strong buying activity ko darust karti hai.

          Dusri Candle (Second Candle):


          Dusri candle, pehli candle se kam lambi hoti hai aur ismein bhi bullish movement hoti hai, lekin zyada aggressive nahi hoti.

          Teesri Candle (Third Candle):


          Teestri candle ek sharp reversal ko darust karti hai, jismein price downtrend ki taraf move karti hai. Is candle ki body do pehli candles ki bodies ke beech mein hoti hai.

          Chouthi Candle (Fourth Candle):


          Chouthi candle, teesri candle se bhi lambi hoti hai aur ek strong bullish move ko indicate karti hai. Yeh candle market mein strong buying activity ko show karti hai.

          Butterfly Pattern Ka Matlab (Meaning of Butterfly Pattern):


          Butterfly pattern ka matlab hota hai ke market mein initial trend ko follow karte hue ek reversal hone ka chance hai. Is pattern ko dekh kar traders ko ye samajhna chahiye ke market mein trend change hone wala hai aur woh apne trading strategies ko adjust karein.
          Trading Strategies (Trading Strategies):


          Butterfly pattern ko samajh kar traders apni trading strategies ko modify kar sakte hain. Agar pattern confirm hota hai toh woh apne positions ko adjust karke potential profit kamane ki koshish kar sakte hain.
          • #6 Collapse

            Assalamualaikum!

            Dear friend Kya hal hain umeed krta hon k ap sab kheriat sy hon gy our forex market mn acha kam kr rhe hon gy dosto aj ka hmara topic bhot he important h aj hm butterfly candlestick chart pattern k bary mn discuss krien gy.

            What is Butterfly candlestick chart pattern?

            Butterfly candlestick pattern ek technical analysis concept hai jo stock market aur financial markets mein istemal hota hai. Ye pattern traders ko market trends ko samajhne aur trading decisions lene mein madadgar hota hai. Butterfly pattern ko samajhne ke liye, apko candlestick charts ka istemal karna hoga, jo market ki price movements ko graphically darust dikhate hain.Butterfly candlestick pattern ek specific reversal pattern hai, jiska mukhya uddeshya market ke trend mein hone wale changes ko pesh karna hai. Is pattern mein, chand candlesticks ek khas tarah se arrange hoti hain.

            Characteristics of Butterfly Pattern :

            Butterfly candlestick pattern ke kuch key characteristics hai:
            - Is pattern mein ek strong move ke baad do small moves hote hain, jo ek butterfly ki shape banate hain.
            - Middle candlestick ka size chhota hota hai compared to the other two candlesticks.
            - Middle candlestick ka open price previous candlestick ke close price se neeche hota hai.
            - Middle candlestick ka close price previous candlestick ke half tak pahunchta hai.
            - Is pattern mein middle candlestick ke baad ek strong reversal dekhne ko mil sakta hai.
            Interpretation:

            Bearish Butterfly pattern, bullish trend ke baad hone wale reversal ke pehchanne ka ishara deta hai. Is pattern ko jab dekha jaata hai, to traders bearish (downward) reversal ki sambhavnaon ko samajhte hain.

            Remember that Butterfly patterns, jaise ke kisi bhi technical analysis pattern, hamesha 100% kamyaab nahi hote. Market conditions aur doosre factors ko madde nazar rakhte hue trading decisions lena zaroori hai. Isi liye, Butterfly pattern ko doosre technical aur fundamental analysis techniques ke sath istemal karna ahem hota hai.

            hamein yeh maloom karna chahiye ke aap dayagram mein butter flayi ki samfony misaal ko kaisay pehchan satke hain. jaisa ke mein ne pehlay tehreer kya tha, yeh misaal chaar lehron se bani hai. un mein se har aik aik dosray se jura sun-hwa hai jaisa ke taraqiyati usoolon ke zareya ishara kya gaya hai. jab bhi aap gartly ke mumkina design ko allag karte hain, har shart ko poora karne ke liye aik point shaamil karen. development score ko paanch fox mantay hue, aap ko yaqeen dilana chahiye ke yeh gartly design aik butter flayi hai aur aykschinjz daakhil karen jaisa ke is tarteeb se ishara kya gaya hai

            Last edited by ; 16-11-2023, 10:32 AM.
            • #7 Collapse

              Butterfly candlestick pattern :

              Click image for larger version

Name:	download (22).png
Views:	115
Size:	8.5 کلوبائٹ
ID:	12780615

              "Butterfly" candlestick pattern ek complex reversal pattern hai jo market analysis mein istemal hota hai. Yeh pattern market mein potential reversal ko indicate karta hai. Chaliye is pattern ko detail mein samajhte hain:

              Butterfly Candlestick Pattern (Roman Urdu):
              1. Kya Hai:
                • Butterfly pattern ek technical analysis pattern hai jo market trend reversal ko darust karta hai.
                • Is pattern mein, aapko kuch specific candlesticks ki formation dekhi jaati hai.
              2. Kaise Pehchanein:
                • Butterfly pattern mein kuch specific candlesticks ko dekha jata hai jo ek particular sequence mein hote hain.
                • Pattern ko pehchane ke liye, aapko specific high, low, open, aur close prices par dhyan dena padta hai.
              3. Kyun Hota Hai:
                • Butterfly pattern market mein buying aur selling forces ke changing dynamics ko reflect karta hai.
                • Ye pattern ek trend reversal ko indicate karta hai, lekin iski confirmation ke liye doosre technical indicators ka bhi istemal hota hai.
              4. Trading Strategies:
                • Butterfly pattern ko dekhte hue traders apne trading decisions banate hain.
                • Agar pattern confirm hota hai, to traders buy ya sell positions enter kar sakte hain, depending on the direction of the reversal.
              5. Risk Management:
                • Trading decisions lene se pehle hamesha risk management ka khayal rakhna chahiye.
                • Stop-loss orders ka istemal karna ahem hai taki nuqsaan se bacha ja sake.
              6. Dhyan Dene Wale Points:
                • Butterfly pattern complex hota hai aur ise sahi se pehchanna mushkil ho sakta hai. Isliye iske istemal mein caution barta jana chahiye.
                • Confirmation ke liye doosre technical indicators ka istemal karna ahem hai.

              Remember ke market patterns aur indicators ke istemal mein hamesha caution barta jana chahiye. Butterfly pattern ke istemal se pehle, traders ko market context aur doosre factors ka bhi tajaweezat ke saath mawafiq hona chahiye.
              • #8 Collapse


                Introduction:

                "Butterfly Candlestick Chart Pattern" ek aham technical analysis tool hai jo market trends ko identify karne mein madad karta hai. Is pattern ka naam iske unique shape se aata hai, jo market mein hone wale potential reversals ko darust karta hai. Is post mein, hum Butterfly Candlestick Pattern ke baray mein 500 lafzon mein ghaur karenge.

                Butterfly Candlestick Pattern Kya Hai:

                Butterfly Candlestick Pattern ek reversal pattern hai, jo price action analysis mein istemal hota hai. Is pattern mein kuch specific candlesticks ka combination hota hai, jise dekhte hue traders ko ye samajh aata hai ke market mein trend change hone wala hai.

                Butterfly Pattern Ki Components:

                Butterfly Pattern mei kuch specific components hote hain, jinmein shamil hain:

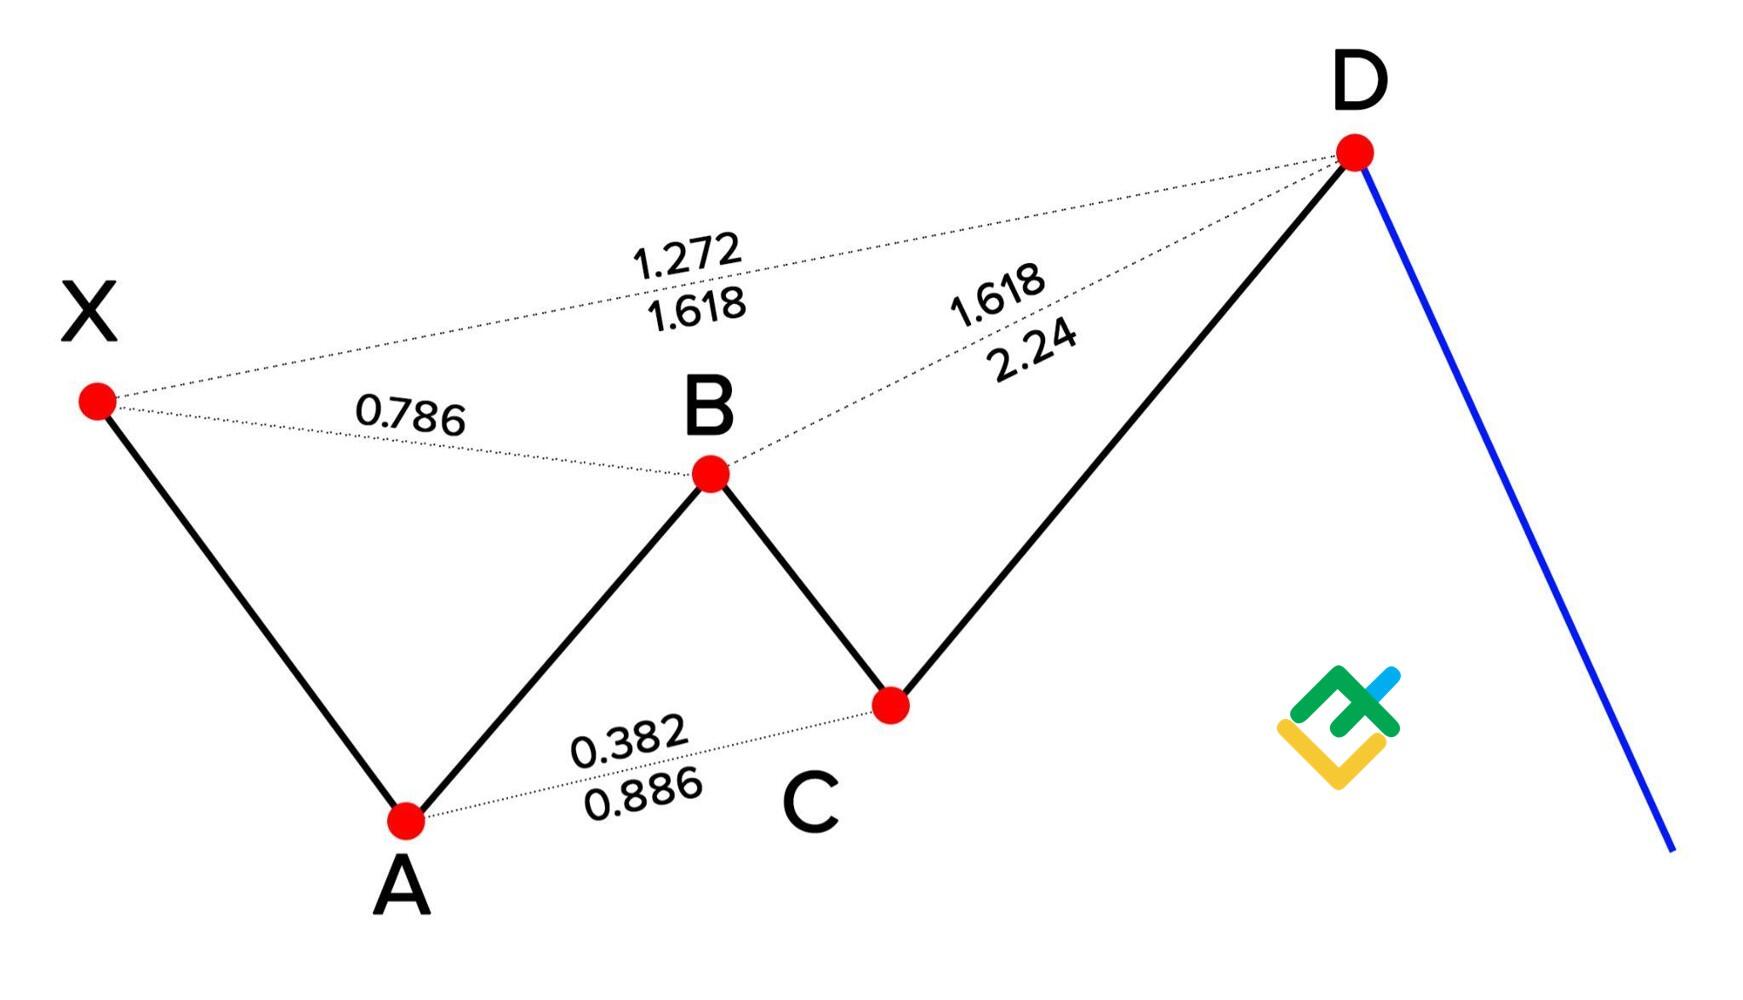
                X-Axis: Initial price move jo reversal ki starting point hoti hai.
                A-B Move: First counter-trend move jo X-Axis ke opposite direction mein hota hai.
                B-C Move: Retracement of A-B move.
                C-D Move: Extension of B-C move, completing the pattern.

                Recognition Aur Trading Rules:

                Butterfly Pattern ko recognize karne ke liye kuch specific rules hote hain. Yeh include karte hain:

                A-B Move: A ke baad B move mein retracement approximately 38.2% se 78.6% tak hota hai.
                B-C Move: B ke baad C move mein retracement approximately 38.2% se 88.6% tak hota hai.
                C-D Move: C ke baad D move approximately 161.8% se 224.2% tak extend hota hai.

                Trading Strategies Using Butterfly Pattern:

                Butterfly Pattern ka istemal karke traders kuch strategies adopt kar sakte hain:

                Entry Point:

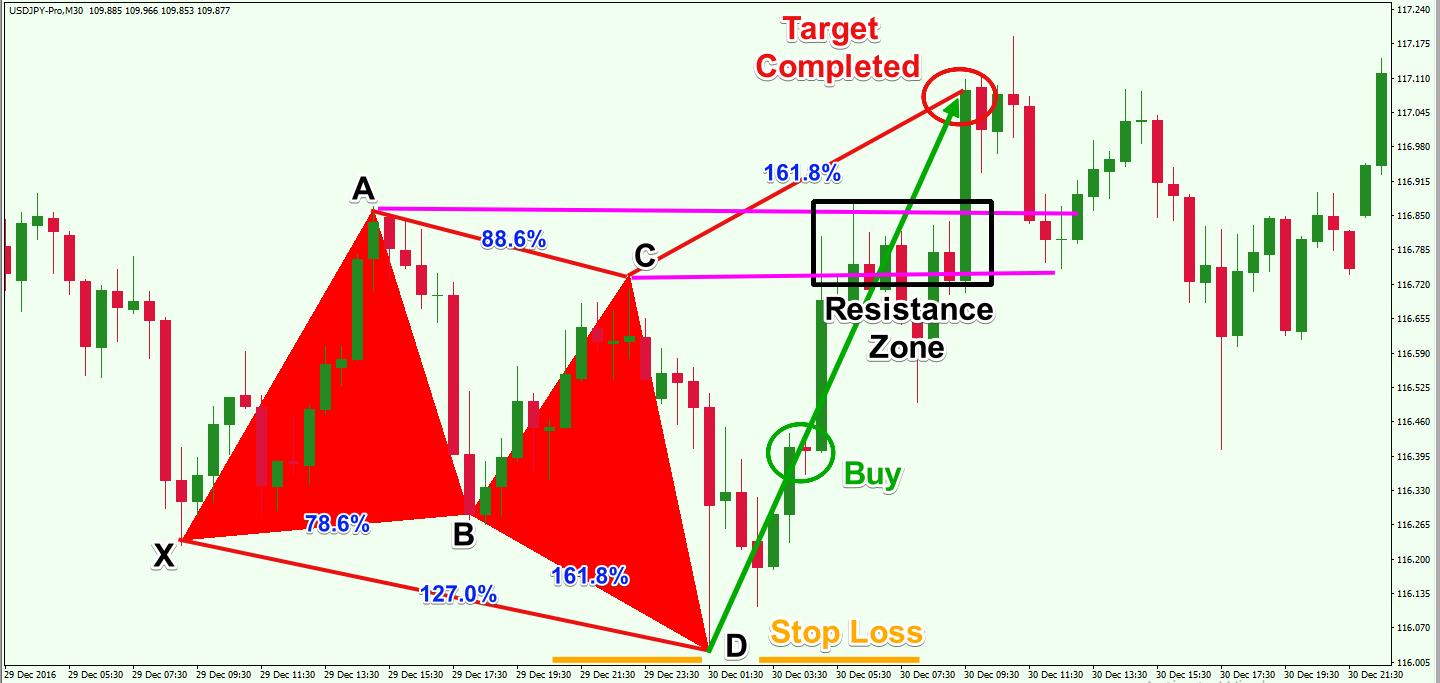
                Entry point ko confirm karne ke liye traders wait karte hain jab D point cross hota hai. Agar price D point ko cross karta hai aur volume bhi tezi dikhata hai, to ye entry point ho sakta hai.


                Stop-Loss Placement:

                Stop-loss order ko sahi jagah par lagana ahem hai. Isme D point ke just below stop-loss place karna common practice hai.

                Target Setting:

                Traders target ko previous swing high ya low ke around set kar sakte hain. Agar price ne D point ko cross kiya hai, to trend reversal confirm hoti hai aur traders target ko set kar sakte hain.

                Risk Management:

                Har trade mein risk management ka istemal karna zaroori hai. Butterfly Pattern ke sath trade karte waqt, traders ko apne risk tolerance ke hisab se position sizes decide karna chahiye. Iske alawa, stop-loss orders ka istemal bhi risk ko control mein rakhne mein madadgar sabit ho sakta hai.

                Limitations:

                Butterfly Pattern ka istemal karne ke liye acchi training aur experience ki zaroorat hoti hai. Is pattern ki accuracy market conditions par depend karti hai, aur iske successful recognition ke liye traders ko careful observation aur analysis ka istemal karna padta hai.

                Note ::

                Butterfly Candlestick Chart Pattern, maaliyat mein trend reversal ko identify karne ke liye ek powerful tool ho sakta hai. Lekin, is pattern ko samajhne aur istemal karne ke liye traders ko market dynamics aur price action ke mukhtalif pehluon ko samajhna hoga. Har trade ko mazboot tajaweezat aur market ke current conditions ke sath mila kar lena zaroori hai.


                There is a time to go long, a time to go short and a time to go fishing.
                ​​​​​​​

                ​​​​​​​
                • #9 Collapse


                  BUTTERFLY CANDLESTICK CHART PATTERN DEFINITION

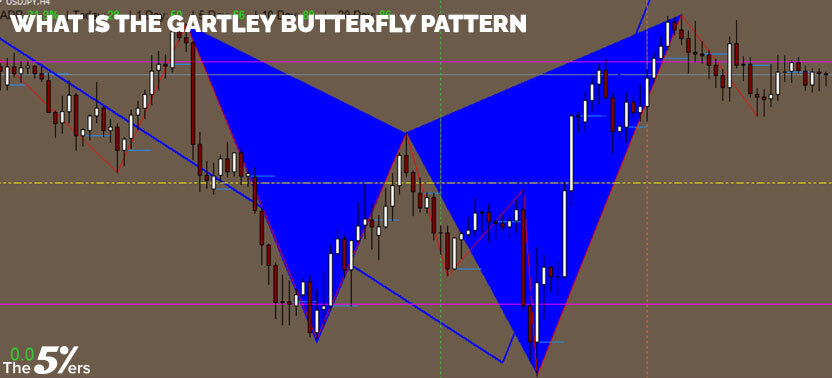
                  gartlet Pattern chart pattern ke mukabale mein future ki price action signals provides Karte Hain harmonic butterfly pattern se mutaalik hai Gartley ke sabse popular pattern mein se ek hai Jo Trend ke reversal ki predict karta hai and new trend ke phase ke Akaz ki define karne mein help karta hai fibonacci retracement ko applying Karke reversal zone ki define karne ke liye bhi butterfly ko kamyabi ke sath istemal Kiya jata hai butterfly pattern harmonic family ka Ek hissa Hai Jais mein gartlet ,bat crab ,and AB,CD Shamil Hai Jo traders ke technical analysis mein istemal kiya jata hai


                  COMPARISON TO THE GARTLEY PATTERN

                  Tanke market Mein turning points ki identify Mein help mile Jiski Ek specific shape aur Pattern Ki Har leg ke Darmiyan distance hai donon pattern Mein Ek Jaise structures four continuation aur five points hai harmonic butterfly apni geometry aur Market ke bad ke behavior donon mein gartley pattern se different hai gartley main point D sirf X ki taraf Ek roll back ki represent karta hai according to statistics butterfly Zyada kasrat se work karti hai use per trading zyada effective hai


                  KEY TIPS ABOUT BUTTERFLY

                  Butterfly patterns ki tashkeel ka analysis karne ke Amal Mein points X ki level ke sath point D ke intersection say Fark karna sabse Aasan hai last wave per price mein extended ke sath pattern ke liye sirf AX ke 141% ke distance per Stop loss Rakhe pattern ke sath work karne ka buniyadi problems yah hai ke iska Pata Lagana Mushkil Hai Sirf experience traders he harmonic pattern ki identify kar sakte hain yah zaruri hai ki trade mein inter hone se pahle dasti taur per trading levels ko Dobara check Karen butterfly harmonic waves ka determine karte waqt lambai Ke Darmiyan taaluk ko check karna na Bhule entry points ki confirmation ke liye apni trading strategy mein main oscillator Shamil Karen
                  • #10 Collapse

                    Butterfly Pattern :

                    Butterfly candlestick pattern ek technical analysis tool hai jo price action ko represent karta hai. Is pattern mein, candlestick chart par 4 distinct price points dikhayi dete hai, jinhe "wings" aur "body" kaha jata hai.
                    Butterfly pattern bullish ya bearish dono forms mein dekhne ko milta hai. Bullish butterfly pattern mein, price initially down move karta hai, phir ek sharp reversal hota hai aur price up move karta hai. Is pattern mein, wings ki length aur body ke size ko analyze karke entry aur exit points set kiye ja sakte hai.

                    Bearish butterfly pattern mein, price initially up move karta hai, phir ek sharp reversal hota hai aur price down move karta hai. Is pattern ko bhi wings ki length aur body ke size ke basis par analyze kiya ja sakta hai.

                    Click image for larger version

Name:	The-butterfly-pattern-.png
Views:	104
Size:	424.5 کلوبائٹ
ID:	12789951

                    Characteristics of butterfly Pattern :

                    Butterfly Pattern ke kuch characteristics hote hai:

                    1. Reversal pattern:

                    Butterfly Pattern ek reversal pattern hai, jiske baad price direction change hota hai. Agar bullish butterfly pattern hai, toh price initially down move karta hai aur phir sharp reversal ke baad up move karta hai. Agar bearish butterfly pattern hai, toh price initially up move karta hai aur phir sharp reversal ke baad down move karta hai.

                    2. Fibonacci retracement levels:

                    Butterfly Pattern mein Fibonacci retracement levels ka istemal kiya jata hai. Price points aur Fibonacci levels ko compare karke entry aur exit points set kiye ja sakte hai.

                    3. Symmetrical structure:

                    Butterfly Pattern ka structure symmetrical hota hai, jisme wings aur body ke size aur proportions important hote hai. Traders is structure ko analyze karke pattern ki validity aur potential price targets determine karte hai.

                    4. Confirmation:

                    Butterfly Pattern ki confirmation ke liye, traders dusre technical indicators aur price action signals ka istemal karte hai. Isse pattern ki strength aur validity ko confirm kiya ja sakta hai.

                    Trading with butterfly Pattern :

                    Butterfly candlestick pattern ke sath trade karne ke liye, aapko kuch steps follow karne honge:

                    1. Pattern recognition:

                    Sabse pehle, aapko candlestick chart par butterfly pattern ko recognize karna hoga. Iske liye, price action ko closely observe kare aur pattern ki characteristics ko dhyan se dekhe.

                    2. Confirmation:

                    Butterfly pattern ki confirmation ke liye, aap dusre technical indicators aur price action signals ka istemal kar sakte hai. Isse pattern ki strength aur validity ko confirm kar sakte hai.

                    3. Entry point:

                    Butterfly pattern ke entry point ko determine karne ke liye, aapko price action aur pattern ki characteristics ko analyze karna hoga. Entry point ko set karne ke liye, aap stop loss aur target levels ko bhi consider kare.

                    ​​​​​5. Exit strategy:

                    Butterfly pattern ke exit point ko determine karne ke liye, aapko price action aur pattern ki characteristics ko analyze karna hoga. Profit booking aur stop loss levels ko set kare.
                     
                    Last edited by ; 11-12-2023, 04:06 PM.
                    • #11 Collapse

                      BUTTERFLY CANDLESTICK PATTERN:-


                      Butterfly candlestick pattern Forex trading me ek technical analysis tool hai. Ye pattern market me reversals ko identify karne ke liye istemal hota hai. Butterfly pattern typically four price swings ko represent karta hai, aur ye harmonics analysis ka ek hissa hai.


                      Butterfly pattern ki pehchan ke liye, aapko specific price levels aur ratios ko dekhna padta hai. Ye pattern aksar Fibonacci retracement levels ke sath juda hota hai. Butterfly pattern me aam taur par ye four points hote hain:

                      BUTTERFLY CANDLESTICK PATTERN K KEY POINTS:-

                      1. XA leg: Initial price swing, jo downtrend ya uptrend ka part hota hai.
                      2. AB leg: Corrective price swing, jo XA leg ke against move karta hai.
                      3. BC leg: Another corrective swing, jo AB leg ke against move karta hai, lekin XA leg ke direction me.
                      4. CD leg: Final price swing, jo BC leg ke against move karta hai, lekin AB leg ke direction me.

                      Butterfly pattern me Fibonacci ratios ka use hota hai, jaise ki 0.786 retracement level aur 1.27 or 1.618 extension levels. Ye levels price swings ke proportion ko measure karte hain.

                      Butterfly pattern ka istemal traders is tarah se karte hain ki agar ye pattern complete hota hai, toh woh expect karte hain ki market me reversal hone ke chances hai. Traders apne entry aur exit points ko is pattern ke according set karte hain. Lekin yaad rahe, kisi bhi technical analysis tool ko istemal karte waqt market risks ko dhyan me rakhna important hai, aur aapko apne trading strategy par bharosa rakhna chahiye.
                      • #12 Collapse

                        Bearish butterfly pattern ek technical analysis tool hai jo market mein hone wale potential price reversals ke baare mein malumat farahem karta hai. Is pattern ka observation price ke initially up move ke baad hota hai, phir ek sharp reversal hota hai aur price down move karta hai. Butterfly pattern ko wings ki length aur body ke size ke basis par analyze kiya ja sakta hai.

                        Butterfly pattern ke kuch characteristics hote hain:

                        1. **Reversal Pattern:** Butterfly pattern ek reversal pattern hai, iska matlab hai ki iske baad price direction change hota hai. Agar bullish butterfly pattern hai, to price initially down move karta hai aur phir sharp reversal ke baad up move karta hai. Agar bearish butterfly pattern hai, to price initially up move karta hai aur phir sharp reversal ke baad down move karta hai.

                        2. **Fibonacci Retracement Levels:** Butterfly pattern mein Fibonacci retracement levels ka istemal hota hai. Traders price points aur Fibonacci levels ko compare karke entry aur exit points set karne mein madad lete hain.

                        3. **Symmetrical Structure:** Butterfly pattern ka structure symmetrical hota hai, jisme wings aur body ke size aur proportions important hote hain. Traders is structure ko analyze karke pattern ki validity aur potential price targets determine karte hain.

                        4. **Confirmation:** Butterfly pattern ki confirmation ke liye, traders dusre technical indicators aur price action signals ka istemal karte hain. Isse pattern ki strength aur validity ko confirm kiya ja sakta hai.

                        Butterfly pattern ke sath trade karne ke liye, traders ko kuch steps follow karne hote hain:

                        1. **Pattern Recognition:** Sabse pehle, traders ko candlestick chart par butterfly pattern ko recognize karna hota hai. Iske liye, price action ko closely observe kare aur pattern ki characteristics ko dhyan se dekhe.

                        2. **Confirmation:** Butterfly pattern ki confirmation ke liye, traders dusre technical indicators aur price action signals ka istemal kar sakte hain. Isse pattern ki strength aur validity ko confirm kar sakte hain.

                        3. **Entry Point:** Butterfly pattern ke entry point ko determine karne ke liye, traders ko price action aur pattern ki characteristics ko analyze karna hota hai. Entry point ko set karne ke liye, traders stop loss aur target levels ko bhi consider karte hain.
                        • #13 Collapse

                          Butterfly candlestick chart pattern
                          Click image for larger version

Name:	8_butterfly_GBPUSD.jpg
Views:	92
Size:	64.1 کلوبائٹ
ID:	12790479


                          Butterfly Candlestick Chart Pattern ek technical analysis tool hai jo financial markets mein use hota hai. Ye pattern price chart par candlesticks ke arrangement ko dekhte hue market trends ko identify karne mein madad karta hai. Butterfly pattern, market mein trend reversal ya trend continuation ko indicate karne ke liye istemal hota hai.

                          Butterfly pattern ka basic structure do impulse legs aur do corrective legs se milta hai. Ye pattern usually trend reversal ko indicate karta hai, lekin kabhi-kabhi trend continuation ke bhi liye use kiya ja sakta hai. Butterfly pattern ko dekhne ke liye aapko kuch key points notice karne hote hain:
                          1. Impulse Legs: Butterfly pattern mein do impulse legs hote hain. Yeh upward ya downward price movement ko represent karte hain.
                          2. Corrective Legs: Impulse legs ke beech mein do corrective legs hote hain. Ye price mein correction ko indicate karte hain.
                          3. Proportions: Butterfly pattern ka ek important aspect hai proportions. Corrective legs ka length, impulse legs ke lengths ke sath specific proportions mein hota hai.
                          4. Swing Highs/Lows: Butterfly pattern ko identify karne ke liye swing highs aur lows ko connect karna important hai.

                          Butterfly pattern ka use traders aur investors price movements ko predict karne mein karte hain. Ye pattern market psychology aur demand-supply dynamics ko samajhne mein madad karta hai. Lekin, jaise ki kisi bhi technical analysis tool ki tarah, butterfly pattern ka bhi 100% accuracy nahi hota, aur market risks hamesha hote hain. Isliye, iska istemal karne se pehle, aapko market analysis aur risk management ko samajhna important hai.
                          • #14 Collapse

                            Butterfly candlestick pattern :


                            "Butterfly candlestick pattern" ka mein taaruf dena chahunga. Butterfly candlestick pattern ek technical analysis ka hissa hai jo traders istemal karte hain tijarat ki taqat aur maqamiyati raqamat ka andaza lagane ke liye. Yeh pattern ek harmonics pattern ka hissa hai, jo ke asal ke trend reversal ya continuation points ko pehchanne ka maqsad rakhta hai.

                            Yahan Butterfly candlestick pattern ki kuch ahem khasoosiyat hain:
                            1. Banawat: Butterfly pattern chaar mukhtalif price swings se bani hoti hai, jinhe XA, AB, BC, aur CD ke naam se darust kiya jata hai.
                            2. Fibonacci Ratios: In price swings ka talaash Fibonacci retracement aur extension levels ke saath hoti hai. Butterfly pattern ke liye ahem Fibonacci ratios hain:
                              • AB: Aam taur par XA ka 78.6% retracement hota hai.
                              • BC: Aam taur par AB ka 38.2% se lekar 88.6% retracement hota hai.
                              • CD: Aam taur par BC ka 161.8% se lekar 261.8% extension hota hai.
                            3. Completion Point: Butterfly pattern tab pura hota hai jab CD leg BC ke 161.8% Fibonacci extension tak pahunch jata hai.
                            4. Reversal Ki Umeed: Woh traders jo Butterfly pattern ka istemal karte hain, woh CD leg puri hone par trend ka mawafiq umid karte hain, jise aam taur par downside reversal ke roop mein dekha jata hai.
                            5. Mukhtalif Khasoosiyat: Butterfly pattern ko is baat se pehchana ja sakta hai ke AB leg aam taur par 61.8% se zyada retracement karti hai, jo ke Gartley ya Bat jaise doosre harmonic patterns mein nahi hota.

                            Yaad rahe ke harmonic patterns ya Butterfly pattern ke istemal ko khud mein nahi liya ja sakta. Traders aksar doosre technical indicators, price action analysis, aur risk management ke tareeqon ka istemal karte hain taake unhain signals ko tasdeeq karne mein aur maqamiyati faislay lene mein madad mile. Iske ilawa, market ki shirkaat aur asal trend ko bhi mad-e-nazar rakhna zaroori hai. Jaise ke har tijarat ki strategy mein, ehtiyaat aur thoray tajaweezat ka amal karna bohat zaroori hai.
                            • <a href="https://www.instaforex.org/ru/?x=ruforum">InstaForex</a>
                            • #15 Collapse

                              Butterfly candlestick pattern:-

                              Butterfly candlestick pattern ek technical analysis ka part hai, jo financial markets, especially stock markets, forex markets, aur commodities markets mein istemal hota hai. Butterfly pattern ek specific type ka reversal pattern hai, jise traders use karte hain to identify potential trend reversals.
                              Butterfly pattern ka naam isliye hai kyunki iski shape butterfly ke wings ki tarah hoti hai. Yeh pattern typically four price swings (legs) se bana hota hai, jinme se do swings (legs) extend hokar ek central point par milti hain. Butterfly pattern ki formation kaafi specific hoti hai, aur traders is pattern ko dekhkar future price movement predict karne ki koshish karte hain.
                              Butterfly pattern ko identify karne ke liye traders candlestick charts ka istemal karte hain, jisme har candlestick ek specific time period ki price movement ko represent karta hai. Butterfly pattern ka formation dekhne par traders assume karte hain ki market mein trend reversal hone ke chances hain, aur unhe apne trading strategies ko adjust karne ki zarurat mehsoos hoti hai.
                              Yaad rahe ki kisi bhi technical analysis tool ya pattern ko puri tarah se rely karna risk bhara ho sakta hai, aur market conditions mein changes hone par yeh accurate nahi reh sakta. Butterfly pattern ko use karte waqt prudent risk management aur dusre confirmatory signals ko bhi consider karna important hai.

                              Butterfly pattern ki Ratios:-

                              Butterfly pattern ek complex pattern hai, aur iske formation mein kuch specific rules hote hain. Yeh pattern 4 legs se bana hota hai, jinhe XA, AB, BC, aur CD ke naam se denote kiya jata hai. Yeh legs Fibonacci levels aur ratios ka use karte hain.
                              1. XA Leg: Yeh pehli leg hoti hai aur trend ka initial move ko represent karti hai.
                              2. AB Leg: XA leg ke baad market mein retracement hota hai, jise AB leg kehte hain. AB leg ka retracement usually 38.2% se 78.6% tak hota hai.
                              3. BC Leg: BC leg ek aur strong move ko represent karta hai, jo XA leg ke opposite direction mein hota hai. BC leg ka extension 1.27 se 1.618 Fibonacci ratio ke beech hota hai.
                              4. CD Leg: CD leg market mein reversal ko show karta hai, jo BC leg ke opposite direction mein hota hai. CD leg ka extension 1.618 se 2.618 Fibonacci ratio ke beech hota hai.


                              Butterfly pattern ka complete hone par traders assume karte hain ki market mein reversal hone ke chances hain, aur woh apne trading strategies ko adjust karte hain.

                              Yeh important hai ki traders market mein hone wale changes ko accurately predict nahi kar sakte, isliye proper risk management ke saath saath, confirmation ke liye dusre technical indicators aur tools ka bhi istemal karte hain.

                              اب آن لائن

                              Working...
                              X