Aslam u alaikum,
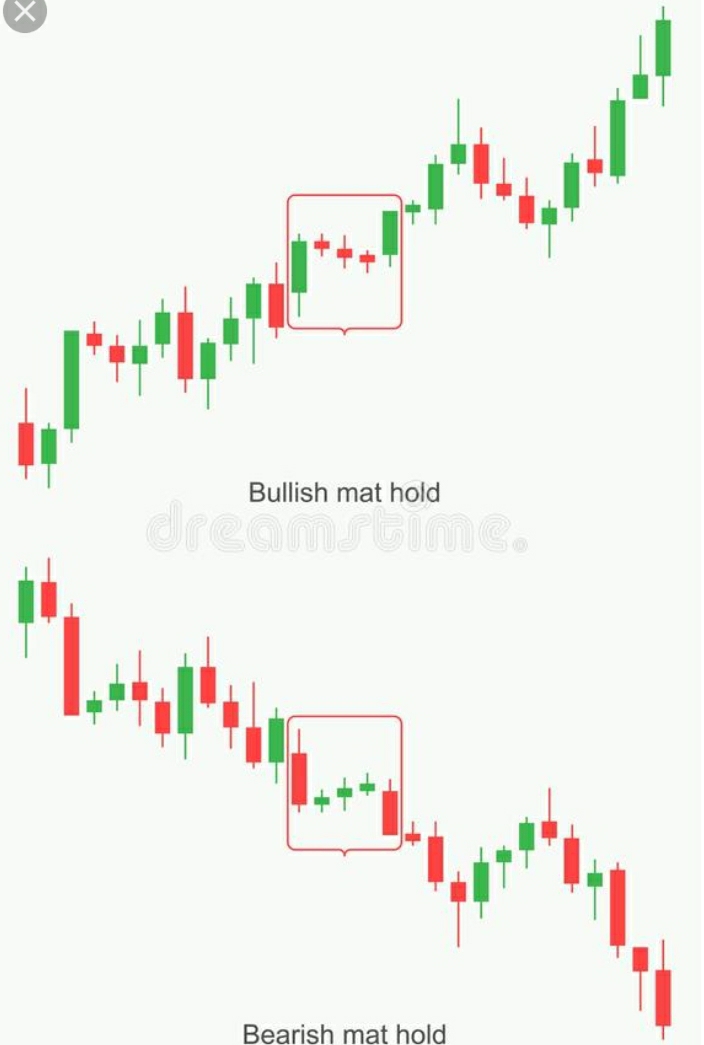
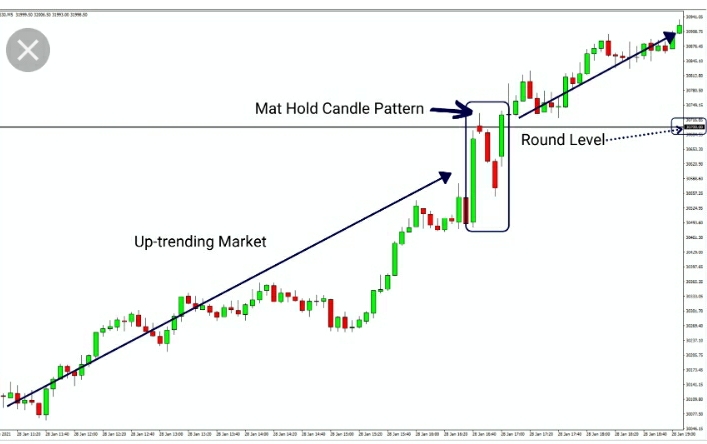
Dear Forex member umeed karta hun aap sab khairiyat se honge dear members Mat hold pattern bullish as well as bearish both ho sakta hai. Bullish pattern upswing ma appear hota hai or bearish mat hold pattern price kay decline kay time par appear hota hai. Bullish variant ma ik candlestick long or vast hoti hai jb kay baki three candlesticks small hoti hai jb kay bearish mat hold ki bat ki jaye to es ma ik long bearish candlestick form hoti hai phr three consecutive small bullish candlesticks form hoti hai or phr last ma again long or bearish candlestick form hoti hai jo es pattern ko form kar deti hai. So hamy ye pata chala kay mat hold pattern market ki continuous move ko show karta hai. Es pattern ma pehle candlestick market ki direction ma form hoti hai or other three candlesticks small or current direction kay opposite form hoti hai jo market ki correctness ko show karta hai. Last ma mat hold pattern ko jo candlestick form karti hai wo bi previous direction ko continue karti hai or ye information melti hai kay market apna trend resume kar chuki hai.


Bearish mat hold pattern.
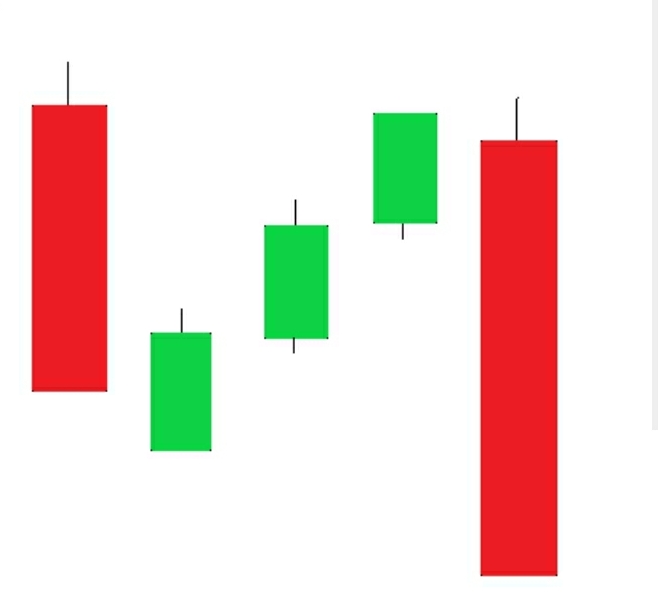
Bearish mat hold pattern ik continuation pattern hai jo five candlestick par mushtamil hota hai. Es pattern ma pehle candlesrick long or bearish hoti hai jo ye show karti hai kay market ma bearish force ka control hai. Es kay bad ki three candlesticks small or bullish hoti hai ko market ki retracement or consolidation ko shoe karti hai. Fifth candlestick jo es pattern ko complete karti hai wo first candlestick ki direction ma hoti hai or ye indicate karti hai kay market apny trend ko resume kar chuki hai.
Precaution.
Technical analysis ma ye pattern reliable to hai but ye uncommon hai. Esko ham kbi kbi rising three method pattern kay sath confuse kar lety hain. Analyst or investor es pattern ko use karty hain or es base par continue movement ko find kar lety hain. Wo ye believe karty hain kay market ki movement kay doran total momentum stable rehta hai. Es pattern ko trade kay laye alone consider ni karna chahe balky positive results kay laye es pattern kay sath other technical tools ko conjuction ma use karna chahe. Es laye kay forex chart ka kio pattern bi 100 percent success ki gurantee mohaya ni karta. Different pattern ko conjuction ma es laye use kiya jata hai kay es kay drawbacks ko dosray kay advantages sy filtet kiya ja saky.

Dear Forex member umeed karta hun aap sab khairiyat se honge dear members Mat hold pattern bullish as well as bearish both ho sakta hai. Bullish pattern upswing ma appear hota hai or bearish mat hold pattern price kay decline kay time par appear hota hai. Bullish variant ma ik candlestick long or vast hoti hai jb kay baki three candlesticks small hoti hai jb kay bearish mat hold ki bat ki jaye to es ma ik long bearish candlestick form hoti hai phr three consecutive small bullish candlesticks form hoti hai or phr last ma again long or bearish candlestick form hoti hai jo es pattern ko form kar deti hai. So hamy ye pata chala kay mat hold pattern market ki continuous move ko show karta hai. Es pattern ma pehle candlestick market ki direction ma form hoti hai or other three candlesticks small or current direction kay opposite form hoti hai jo market ki correctness ko show karta hai. Last ma mat hold pattern ko jo candlestick form karti hai wo bi previous direction ko continue karti hai or ye information melti hai kay market apna trend resume kar chuki hai.
Bearish mat hold pattern.
Bearish mat hold pattern ik continuation pattern hai jo five candlestick par mushtamil hota hai. Es pattern ma pehle candlesrick long or bearish hoti hai jo ye show karti hai kay market ma bearish force ka control hai. Es kay bad ki three candlesticks small or bullish hoti hai ko market ki retracement or consolidation ko shoe karti hai. Fifth candlestick jo es pattern ko complete karti hai wo first candlestick ki direction ma hoti hai or ye indicate karti hai kay market apny trend ko resume kar chuki hai.
Precaution.
Technical analysis ma ye pattern reliable to hai but ye uncommon hai. Esko ham kbi kbi rising three method pattern kay sath confuse kar lety hain. Analyst or investor es pattern ko use karty hain or es base par continue movement ko find kar lety hain. Wo ye believe karty hain kay market ki movement kay doran total momentum stable rehta hai. Es pattern ko trade kay laye alone consider ni karna chahe balky positive results kay laye es pattern kay sath other technical tools ko conjuction ma use karna chahe. Es laye kay forex chart ka kio pattern bi 100 percent success ki gurantee mohaya ni karta. Different pattern ko conjuction ma es laye use kiya jata hai kay es kay drawbacks ko dosray kay advantages sy filtet kiya ja saky.
