Tripple Top Chart Pattern:
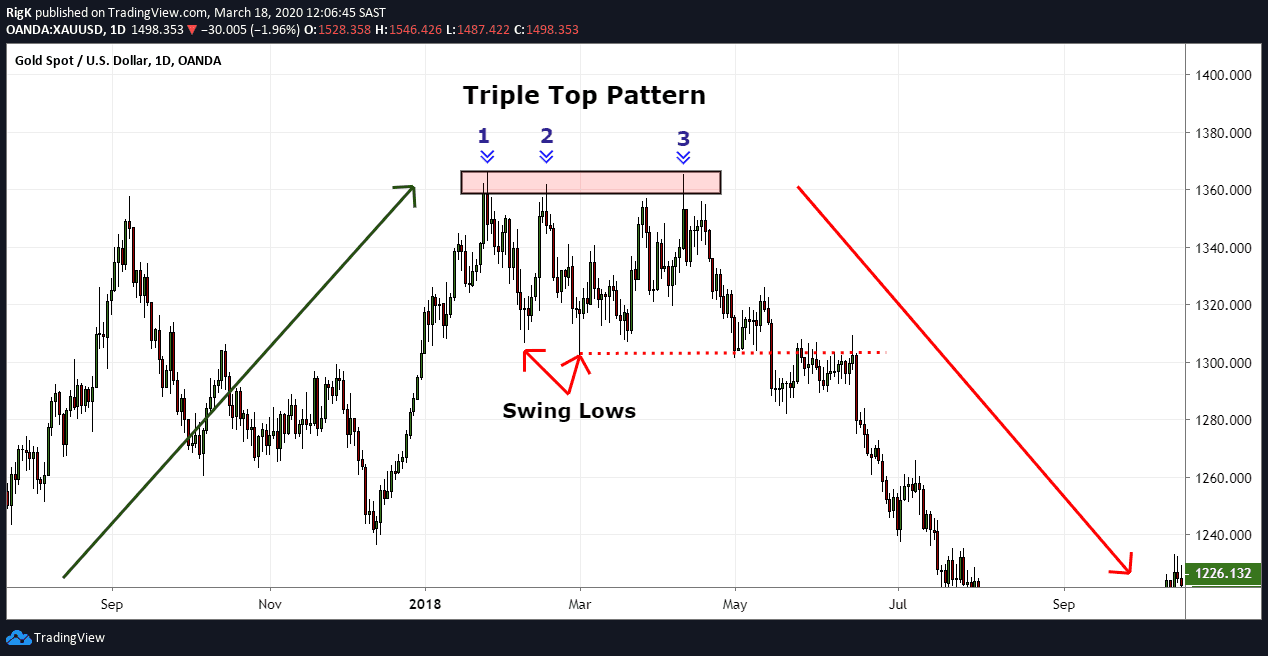
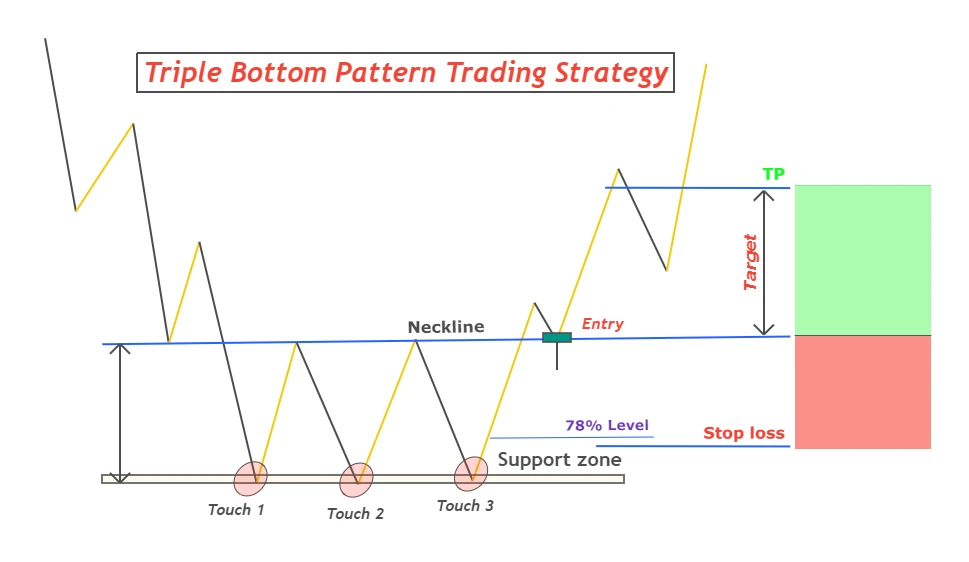
Tripple Top Chart Pattern man market price three same hight ki peaks banati hai aur uska bad market price long down fall man jati hai. Is pattern man buyer three time market price ko oper le jana ki koshish kerta han lakin hold nahe ker pata aur sellers price nicha le atta hai. Pattern ka matlab ye hai k market kuch khas shapes form karti hai jis ki bena par trader ko market k future ka pata chal jata hai. Agr market us shape ko follow karti hai to trader k lae acha moka ho jata hai profit hasil karny ka. But market hamesa ik he pattern ko ya ik he shape ko follow ni karti balky market kisi b time kisi b shape ma khud ko transform kar leti hai so trader ko pattern sy zyada apny experience par focus karna chahe.

Tripple Top Chart Pattern ka tafseeli jaizah
Tripple Top Chart Pattern ki mazeed confimation k liye iska sath technical indicator ka use kia ja sakta hai. Is pattern k sath ager trader Relatve Strength Index Indicator ko use ker raha hai to is pattern ki third peak banna k doran jab price oper ja rahe ho to RSI line nicha ki taraf move ho rahe ho. Ye is pattern per trade ki confirmation hai. Buyers k three attempts kerna k bad sellers completely market ko apni direction man move kerwata hai. Ye pattern hamasha long bullish trend k bad banna to zayada effective hota hai.

Tripple Top Chart Pattern k sath trading strategy
Tripple top ko dekhen to yahan par apko top par same point nazar ayngi isi liay unko bhi follow lazmi hay . Trade ko samjhna hay to sab say phly hamen market ko time dena hoga jab hum market ko time dengy to hi hum success hongy isi liay dear members hameen chhaiy candlestick ko samjhen and yahan trade kren agar ap trade krengy to apko is chart iki samjh aygi isi liay apko chhaiy kay hamesha best kam kren is say apko yeh faida hoga kay apko chart ki samjh jaygi and ap jald say jald sucessful hojayngyisi liay dear members hamen chhiay kay strong kam kren daily is say hamen yeh faida hoga kay hum strong hojayngy and successful hojayngy

Tripple Top Chart Pattern man market price three same hight ki peaks banati hai aur uska bad market price long down fall man jati hai. Is pattern man buyer three time market price ko oper le jana ki koshish kerta han lakin hold nahe ker pata aur sellers price nicha le atta hai. Pattern ka matlab ye hai k market kuch khas shapes form karti hai jis ki bena par trader ko market k future ka pata chal jata hai. Agr market us shape ko follow karti hai to trader k lae acha moka ho jata hai profit hasil karny ka. But market hamesa ik he pattern ko ya ik he shape ko follow ni karti balky market kisi b time kisi b shape ma khud ko transform kar leti hai so trader ko pattern sy zyada apny experience par focus karna chahe.
Tripple Top Chart Pattern ka tafseeli jaizah
Tripple Top Chart Pattern ki mazeed confimation k liye iska sath technical indicator ka use kia ja sakta hai. Is pattern k sath ager trader Relatve Strength Index Indicator ko use ker raha hai to is pattern ki third peak banna k doran jab price oper ja rahe ho to RSI line nicha ki taraf move ho rahe ho. Ye is pattern per trade ki confirmation hai. Buyers k three attempts kerna k bad sellers completely market ko apni direction man move kerwata hai. Ye pattern hamasha long bullish trend k bad banna to zayada effective hota hai.
Tripple Top Chart Pattern k sath trading strategy
Tripple top ko dekhen to yahan par apko top par same point nazar ayngi isi liay unko bhi follow lazmi hay . Trade ko samjhna hay to sab say phly hamen market ko time dena hoga jab hum market ko time dengy to hi hum success hongy isi liay dear members hameen chhaiy candlestick ko samjhen and yahan trade kren agar ap trade krengy to apko is chart iki samjh aygi isi liay apko chhaiy kay hamesha best kam kren is say apko yeh faida hoga kay apko chart ki samjh jaygi and ap jald say jald sucessful hojayngyisi liay dear members hamen chhiay kay strong kam kren daily is say hamen yeh faida hoga kay hum strong hojayngy and successful hojayngy


تبصرہ
Расширенный режим Обычный режим