Double Bottom Chart Pattern In Forex
X
  • وقت
  • دکھائیں
Clear All
new posts
  • #1 Collapse

    Double Bottom Chart Pattern In Forex
    Importance of Chart Patterns:
    Forex Trading man traders currency pairs aur commodities ki price movements ko smajhna k liye price chart read kerta han Price Chart price k trend, momentum aur patterns man changes ko accurately identify kerta ha Chart Patterns price chart man price ki movement ko track kerna k liye use hona wala most important technical tool ha Traders Currency Pairs aur Commodities ko Buy/Sell k liye in chart pattern pr depend kerta han

    What Is Double Bottom Chart Pattern
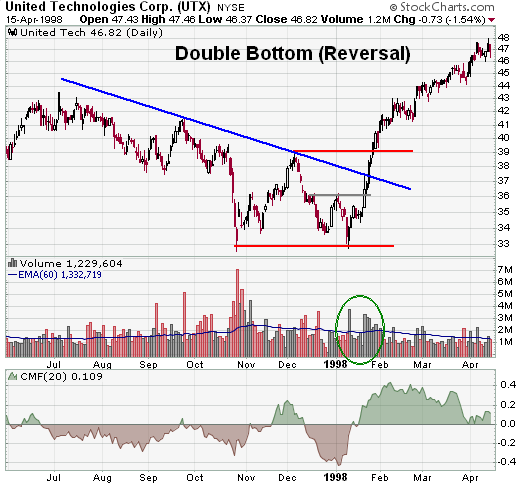
    Double Bottom Chart Pattern ak trend reversal pattern ha Ye pattern long bearish trend k bottom per support level per banta ha Ye pattern batata ha k sellers price ko nicha la ker jata han lakin power kam hona ki waja sa price ko hold nahe ker pata Sellers is pattern man two time price ko same level tak nicha le ker jata han lakin second bottom k bad jab price hoti ha to pher ak long bullish trend k start hona ki 50% confirmation ho jati ha Final confirmation k liye trader dono bottom k starting point ko ak trend line sa jorta ha. Is trend line ko " Neckline"" kehta han, jab price is neckline ko break kerti ha to trader ko long bullish trend ki 100 % confirmation ho jati ha

    Trading With 'Double Chart Pattern
    Double Bottom Chart Pattern per trading kerna k liye zarori ha k trader breakout ka wait kara, aur jab price candle ka close ""Neckline"" sa oper de to is sa breakout ki confirmation ho jati ha Lakin trader ko trade k liye price k neckline ko re-test kerna ka wait kerna chaheye Jab price retest kerti ha to is per trader ko ""Buy ki Trade"" active kerni chaheye Stoploss ko last bottom sa nicha place karen aur Take Profit ko neckline aur bottom k dermiyan distance k baraber oper place karen

    With Other Technical Indicator
    Trade ki mazeed confimation k liye trader is pattern k sath ""Moving Average ya Oscilator"" ko use ker sakta ha Ager trader Relative Strength Index (RSI) use ker raha han to trade ki confirmation k liye zarori ha k is pattern ki formation k doran RSI bullish Divergence de rahe ho
  • <a href="https://www.instaforex.org/ru/?x=ruforum">InstaForex</a>
  • #2 Collapse

    Re: Double Bottom Chart Pattern In Forex

    Double bottom pattern:-

    Double Bottom chart pattern bahot hi simple strategy hay market trend line key change hony key signal provide karny ki waja se es ko trend reversal chart pattern be kehty hn.
    Agar market ka trend bullish trend ho aur koch time bad market down ajaye magar pehli waly price se down na jaye es ko ham double bottom kehty hey
    Aesi bottoms se ham market key bullish ya bearish trend ka andaza lagaty hey, 1st bottom ko nahi dekhna chahiye 2nd bottom par nazar rakni chaye, agar 2nd bottom 1st bottom se down chali jaye to ye bearish signal ho ga aur market trend change hony ka signal dega isi trha agar 2nd bottom 1st bottom se se down na Gaye aur mazeed up jaye to ye clear bullish trend ho ga.

    Click image for larger version

Name:	images (16).png
Views:	30
Size:	10.7 کلوبائٹ
ID:	12425799

    Explanation:-

    double bottom pattern K aapne dikhaya hai ki ek week mein market download site par same position Mein Aayi hai aur FIR wahan se ab Chali gayi hai agar aise hi tarike Se Hum Forex trading Ke Chat koratkar Nasik Jane To Hum Apni successful hone ki recipe ko ziada kar sakte hain Forex trading main isliye Mein Sama members Khoya kahunga ke pahle post ko acche tarike se read Karen aur FIR usko reply karen tab he use post ka aapko faida Hoga aur va post aapko knowledge dega.
    Traders trading karte hue different style use karte hain kuch traders scalping karna pasand hai scalping trading keva strategy Hai Jisme traders Sambhal profit Bana kar apni tradeco cut kar dete hain aur bahut set Railways long term trading karte hain Iske alava kuch traders short term trading karte hain experience
    Click image for larger version

Name:	images (12).jpeg
Views:	2
Size:	15.5 کلوبائٹ
ID:	12425798
    • #3 Collapse

      Re: Double Bottom Chart Pattern In Forex

      Assalamu Alaikum dear member Jab aap RX trading market mein technical analysis ko acchi Tarah base banakar trading karna chahte hain to iske liye aapko hamesha bahut acchi information ka idea hona chahie kyunki jab tak aapko ek acchi information ka idea Nahin hota use time tak aap kabhi bhi market mein successful or effective trading karne ki position mein Nahin a sakte hain aaj main aapko double bottom candle stick pattern ki kuchh important information dene ja raha hun.

      Double Bottom Candlestick

      Double bottom candle stick pattern basically ek aisa candlestick pattern hota hai jo aapko resistance level per milta hai Jab aap market mein support level ko acchi Tarah find out kar lete hain aur Market ek area ko touch karne ke bad rebounds Ho jaati hai aur kuchh duration spent hone ke bad sem usi point se touch Karke to market haribosh Karti hai to is candlestick pattern ko aap double bottom kah sakte hain aur yah ek acchi support level Ban sakti hai aap next time bhi is pattern se ek acchi entry Le sakte hain.

      Identification

      Candalstick pattern ko aap bahut aasani ke sath identify kar sakte hain kyunki Jab aap market mein regularly basis per working kar rahe hote hain to ismein aapko bahut acchi opportunities available ho rahi hoti hai aapko hamesha market mein kisi bhi candlestick pattern ko find out karne ke liye kuchh important availability ko find out karna hota hai aur inki base per hi market mein successful aur effective trading karna hoti hai Jab aap market mein regularly basis per apni working kar rahe hote hain to aapko market mein hamesha Kisi bhi candlestick pattern ki identification ko perfect banana hota hai Jab tak aap identification process ko find out nahin kar lete hain use time tak aap market mein successful trading nahin kar sakte hain.

      Interpretation

      Jab aap Kisi bhi pattern ki identification kar lete hain to next step uski interpretation aur decision making hoti hai aapko decision making ka bhi acchi Tarah Idea hona chahie ki kaun si situation mein kaun si decision making karni hai isliye aapko hamesha market mein regularly basis per kuchh important analysis ko find out karna hota hai aur inki base per apna decision Lena hota hai Jab aap market mein pattern ko acchi Tarah study kar lete hain to double bottom candle stick pattern ki base per aap ko market mein hamesha purchasing ki entry Lena hoti hai aur seling karne se avoid karna hota hai.

      Importance

      Candal stick ko aap acchi Tarah identify karne ke bad Jab interpretation karte Hain to iski against aapko bahut hi perfect benefits available ho rahe hote hain definittely aap is platform per bahut achcha profit hasil kar sakte hain aur ismein maximum advantages hasil kar sakte hain aapko hamesha market mein platform per ek perfect results per create karna hota hai.

      Click image for larger version

Name:	unnamed (1).jpg
Views:	6
Size:	27.1 کلوبائٹ
ID:	12425859
      • #4 Collapse

        Re: Double Bottom Chart Pattern In Forex

        Double Bottom Candlestick Pattern
        Double Bottom Candlestick Pattern ko samajny ky liye ap ko iss bat par focus karna ho ga ky market mn 1 time par 2 same lowest points hoty hain. Jin ko market touch kar ky wapis aapis aati hai. Market ki iss position ko Double Bottom Candlestick Pattern kehty hain. Double Bottom Chart Pattern ak trend reversal pattern ha Ye pattern long bearish trend k bottom per support level per banta ha Ye pattern batata ha k sellers price ko nicha la ker jata han lakin power kam hona ki waja sa price ko hold nahe ker pata Sellers is pattern man two time price ko same level tak nicha le ker jata han
        Click image for larger version

Name:	download (1).png
Views:	5
Size:	6.2 کلوبائٹ
ID:	12425864
        Pettern k pehchna ka tariqa
        Double bottom chart pattern bhe aik reversal pattern hai jo ke hume selling market me milta hai yani market down trend me move kar rahi ho tu pahle aik bottom banta hai oruske bad market apni correction kar ke dobara low level ko touch karti hai or aise bouble bottom chart pattern banta hai is per hum trade kar sakte hai jaise hi neck lineDear market ma hum pahly bhe discuss kr chuky hain k is pettern ko hum is ki shape ki wja sy W pettern the kahty hain tw is hisab sy kisi the trader k leay double bottom pettern ko smjhna asaan hota ha ye pettern ek lmby downtrend k bad bnta ha or is pettern ma hmesha 2 bottom bnta hain or in bottom k drmian km uz kum 7 sy 8 candles ka distance hona chaheay tb he hum in ko double bottom pettern kahty hain agr wo distence 3 ya 4 candles ka ho ga tw wo double bottom candlestick pettern nhn ho ga.
        Click image for larger version

Name:	download.jpg
Views:	13
Size:	3.3 کلوبائٹ
ID:	12425865
        Trading with Double Chart Pattern:
        Double Top Chart Pattern per trading k liye trader price ka ""Neckline"" ko nicha ki taraf breakout ka wait kerta ha. Ager price double top banana k bad nicha "Neckline" pwr ati han aur price Neckline sa nicha candle ka close de to is sa breakout confirm ho jata ha. Lakin trade active kerna k lige trader ko price ka Neckline ko retest kerna ka wait kerna chaheye. Jasa price retest kara to is per trader ko ""Sell ki Trade"" active kerni chaheye. Is pattern man account ko safe rukhna k liye Stoploss ko price k last high sa 6 pips oper place karen aur Take Profit ko Price k top sa neckline tak k diatance k baraber nicha place karen.
        Click image for larger version

Name:	download.png
Views:	34
Size:	4.3 کلوبائٹ
ID:	12425867
        • #5 Collapse

          Re: Double Bottom Chart Pattern In Forex

          Importance of Chart Patterns,,,

          Forex Exchanging man brokers money matches aur items ki cost developments ko smajhna k liye cost diagram read kerta han Value Graph cost k pattern, energy aur designs man changes ko precisely recognize kerta ha Outline Examples cost outline man cost ki development ko track kerna k liye use hona wala most significant specialized apparatus ha Merchants Cash Matches aur Wares ko Purchase/Sell k liye in diagram design pr depend kerta Agar market ka pattern bullish pattern ho aur koch time awful market down ajaye magar pehli waly cost se down na jaye es ko ham twofold base kehty hello
          Aesi bottoms se ham market key bullish ya negative pattern ka andaza lagaty hello, first base ko nahi dekhna chahiye second base standard nazar rakni chaye, agar second base first base se down chali jaye to ye negative sign ho ga aur market pattern change hony ka signal dega isi trha agar second base first base se down na Gaye aur mazeed up jaye to ye clear bullish pattern ho ga.
          What Is Double Bottom Chart Pattern,,,,

          Twofold Base Diagram Example ak pattern inversion design ha Ye design long negative pattern k base per support level per banta ha Ye design batata ha k venders cost ko nicha la ker jata han lakin power kam hona ki waja sa cost ko hold nahe ker pata Dealers is design man double cross cost ko same level tak nicha le ker jata han lakin second base k awful poke cost hoti ha to pher ak long bullish pattern k beginning hona ki half affirmation ho jati ha Last affirmation k liye broker dono base k beginning stage ko ak pattern line sa jorta ha. Is pattern line ko " Neck area"" kehta han, hit cost is neck area ko break kerti ha to broker ko long bullish pattern ki 100 % affirmation ho jati ha


          Exchanging With 'Twofold Chart Pattern,,,,
          Twofold Base Diagram Example per exchanging kerna k liye zarori ha k merchant breakout ka stand by kara, aur hit cost flame ka close ""Neck area"" sa oper de to is sa breakout ki affirmation ho jati ha Lakin broker ko exchange k liye cost k neck area ko re-test kerna ka stand by kerna chaheye Punch cost retest kerti ha to is per broker ko ""Purchase ki Exchange"" dynamic kerni chaheye Stoploss ko last base sa nicha place karen aur Take Benefit ko neck area aur base k dermiyan distance k baraber oper place Twofold base candle design essentially ek aisa candle design hota hai jo aapko obstruction level per milta hai Hit aap market mein support level ko acchi Tarah find out kar lete hain aur Market ek region ko contact karne ke awful bounce back Ho jaati hai aur kuchh term burned through sharpen ke terrible sem usi point se contact Karke to showcase haribosh Karti hai to is candle design ko aap twofold base kah sakte hain aur yah ek acchi support level Boycott sakti hai aap next time bhi is design se ek acchi passage Le sakte hain.

          With Other Specialized Indicator,,,,
          Exchange ki mazeed confimation k liye broker is design k sath ""Moving Normal ya Oscilator"" ko use ker sakta ha Ager merchant Relative Strength Record (RSI) use ker raha han to exchange ki affirmation k liye zarori ha k is design ki arrangement k doran RSI bullish Uniqueness de rahe ho
          • #6 Collapse

            Re: Double Bottom Chart Pattern In Forex

            Double bottom pattern:-

            Double Bottom chart sample bahot hello easy strategy hay market fashion line key trade hony key sign offer karny ki waja se es ko fashion reversal chart pattern be kehty hn.Agar marketplace ka trend bullish fashion ho aur koch time awful market down ajaye magar pehli waly price se down na jaye es ko ham double bottom kehty howdyAesi bottoms se ham marketplace key bullish ya bearish trend ka andaza lagaty good day, 1st bottom ko nahi dekhna chahiye 2d backside par nazar rakni chaye, agar 2nd bottom 1st backside se down chali jaye to ye bearish sign ho ga aur market trend alternate hony ka signal dega isi trha agar 2d backside 1st bottom se se down na Gaye aur mazeed up jaye to ye clear bullish trend ho ga.
            Explanation:-

            double backside pattern K aapne dikhaya hai ki ek week mein marketplace download site par equal position Mein Aayi hai aur FIR wahan se ab Chali gayi hai agar aise hi tarike Se Hum the Forex market trading Ke Chat koratkar Nasik Jane To Hum Apni a hit hone ki recipe ko ziada kar sakte hain the Forex market buying and selling principal isliye Mein Sama individuals Khoya kahunga ke pahle publish ko acche tarike se examine Karen aur FIR usko reply karen tab he use submit ka aapko faida Hoga aur va publish aapko understanding dega.
            Traders trading karte hue unique fashion use karte hain kuch traders scalping karna pasand hai scalping buying and selling keva approach Hai Jisme traders Sambhal profit Bana kar apni tradeco reduce kar dete hain aur bahut set Railways long time trading karte hain Iske alava kuch traders quick time period buying and selling karte hain revel in.


            Double Bottom Candlestick

            Double bottom candle stick pattern basically ek aisa candlestick pattern hota hai jo aapko resistance stage per milta hai Jab aap marketplace mein help level ko acchi Tarah find out kar lete hain aur Market ek vicinity ko touch karne ke bad rebounds Ho jaati hai aur kuchh duration spent hone ke bad sem usi factor se touch Karke to marketplace haribosh Karti hai to is candlestick sample ko aap double backside kah sakte hain aur yah ek acchi assist level Ban sakti hai aap next time bhi is pattern se ek acchi access Le sakte hain.Candalstick pattern ko aap bahut aasani ke sath discover kar sakte hain kyunki Jab aap market mein regularly foundation in line with running kar rahe hote hain to ismein aapko bahut acchi possibilities to be had ho rahi hoti hai aapko hamesha marketplace mein kisi bhi candlestick pattern ko find out karne ke liye kuchh crucial availability ko discover karna hota hai aur inki base in step with hello market mein a hit aur powerful buying and selling karna hoti hai Jab aap market mein regularly foundation in line with apni operating kar rahe hote hain to aapko marketplace mein hamesha Kisi bhi candlestick sample ki identity ko best banana hota hai Jab tak aap identity system ko discover nahin kar lete hain use time tak aap marketplace mein a hit trading nahin kar sakte hain.
            Interpretation

            Jab aap Kisi bhi sample ki identification kar lete hain to subsequent step uski interpretation aur selection making hoti hai aapko choice making ka bhi acchi Tarah Idea hona chahie ki kaun si scenario mein kaun si selection making karni hai isliye aapko hamesha market mein frequently basis in keeping with kuchh essential analysis ko discover karna hota hai aur inki base in step with apna selection Lena hota hai Jab aap marketplace mein sample ko acchi Tarah take a look at kar lete hain to double backside candle stick sample ki base according to aap ko market mein hamesha purchasing ki entry Lena hoti hai aur seling karne se keep away from karna hota hai.Candal stick ko aap acchi Tarah discover karne ke terrible Jab interpretation karte Hain to iski in opposition to aapko bahut hi ideal blessings available ho rahe hote hain definittely aap is platform according to bahut achcha earnings hasil kar sakte hain aur ismein maximum advantages hasil kar sakte hain aapko hamesha market mein platform consistent with ek best outcomes in step with create karna hota hai.


            Double Bottom Candlestick Pattern

            Double Bottom Candlestick Pattern ko samajny ky liye ap ko iss bat par cognizance karna ho ga ky market mn 1 time par 2 equal lowest factors hoty hain. Jin ko market contact kar ky wapis aapis aati hai. Market ki iss function ko Double Bottom Candlestick Pattern kehty hain. Double Bottom Chart Pattern ak trend reversal pattern ha Ye sample long bearish fashion k backside consistent with aid stage consistent with banta ha Ye sample batata ha ok dealers fee ko nicha la ker jata han lakin power kam hona ki waja sa charge ko preserve nahe ker pata Sellers is sample guy two time fee ko identical level tak nicha le ker jata han.Bouble backside chart sample banta hai is according to hum exchange kar sakte hai jaise hi neck lineDear market ma hum pahly bhe discuss kr chuky hain k is pettern ko hum is ki shape ki wja sy W pettern the kahty hain tw is hisab sy kisi the trader ok leay double backside pettern ko smjhna asaan hota ha ye pettern ek lmby downtrend ok terrible bnta ha or is pettern ma hmesha 2 bottom bnta hain or in bottom okay drmian km uz kum 7 sy 8 candles ka distance hona chaheay tb he hum in ko double bottom pettern kahty hain agr wo distence three ya four candles ka ho ga tw wo double backside candlestick pettern nhn ho ga.
            • #7 Collapse

              Re: Double Bottom Chart Pattern In Forex

              double prime aur double botom value rewarsarl patteren ki aik shakal ho sakti hai .
              yeh ulat chart patteren fashion ban'nay mein aik tosee shuda raqam letay hain .
              double prime am patteren se mushabihat rakhta hai aur mayoosi ke ulat jane ki nishandahi karta hai jab ke double botom w patteren se mushabihat rakhta hai aur aik pur-umeed ulat ki nishandahi karta hai .
              double prime aur double botom chart patteren aam tor par aik baar lagataar ghalat hisaab se taap noch aur botoms ke banaye jatay hain .
              aayiyae hum un rewarsarl chart patteren ki tashkeel ke peechay scienci nazam o zabt aur un ke sath tijarat karne ke tareeqay par tafseel se baat karte hain .

              What is Double TopPattern?

              aik double prime chart patteren aik mayoosi ke ulat chart patteren ho sakta hai jo an up trained ke baad waza kya jata hai .
              yeh namona 2 chotyon ke sath banaya gaya hai jo aik istilaah se ziyada hai jisay gardan bhi kaha jata hai .
              pehli chouti aik mazboot up trained ke baad banti hai is liye wapas gardan ki taraf jayen .
              apni gardan tak wapas pounchanay ke baad, maliyat par umeed ho jati hai aur doosri chouti bananay ke liye aik baar phir barh jati hai .
              is patteren ki tashkeel mukammal ho jati hai jab akhrajaat doosri chouti ki tashkeel ke baad gardan tak wapas atay hain .
              jab laagat gardan ya sharait se toot jati hai to phir mayoosi ke rujhan ke ulat jane ki tasdeeq hoti hai .

              What is Double Bottom Pattern?

              aik double neechay chart patteren aik umeed mand rewarsarl chart patteren ho sakta hai jo aik baar down trained ke baad tayyar hota hai .
              yeh patteren is ki muzahmati satah se neechay 2 lovs ke sath banaya gaya hai jisay izafi tor par gardan kaha jata hai .
              pehli nichli satah aik mazboot davn trained ke baad banti hai taakay lagtain wapas gardan tak pahonch jayen .
              apni gardan tak pounchanay ke baad, qader mayoosi ka shikaar ho jati hai aur aik baar phir girty hai taakay doosri kam ho jaye .
              is patteren ki tashkeel mukammal ho jati hai jab laagat doosri kam honay ke baad gardan tak wapas ajati hai .
              jab qeematein gardan ya muzahmati satah se toot jati hain to phir taizi ke rujhan ke ulat jane ki tasdeeq ho jati hai aur tajir aik taweel position mein daakhil ho jayen ge .
              • #8 Collapse

                Re: Double Bottom Chart Pattern In Forex

                bhot he excellent and top sharing ki hain apne forex shopping for and promoting important kamyab busniess hain tu foreign exchange looking for and promoting most important getting to know karna parta hain forex searching for and selling ka busniess ek kamyab busniess hain foreign exchange looking for and selling important getting to know karna parta hain foreign exchange searching for and promoting primary pratice kare foreign exchange purchasing for and promoting most essential mastering karna parta hain ek kamyab busneiss karne adequate liye guidelines ko study karna parta hain foreign exchange buying and selling primary mastering nhe hain tu amazing earning nhe ho skti hain getting to know karna parta hain forex buying and promoting essential hard artwork kare forex purchasing for and promoting crucial pratice kare learning kare forex shopping for and selling fundamental reading top sufficient bina kamyabi b nhe mil skti hain foreign exchange shopping for and selling primary studying karna parta hain foreign exchange buying and selling pratice kare regular pratice kare jaaab tak learning appropriate sufficient bina kaaam hota hain tu losss ho skta hain

                How to assessment marketplace in chert pattren in foreign exchange buying and selling:

                foreign exchange buying and promoting maximum important studying karna parta hain forex shopping for and selling major everyday pratice karna want to hain ek kamyab consumers banna hain tu forex looking for and promoting essential tough paintings kare normal gaining knowledge of kare tough paintings adequate sath kaaam kare achi kamyabi mil skti hain foreign exchange buying and promoting ek kamyab busniess hain foreign exchange essential jaaab tak studying robust nhe hoti hain tu earning true enough koi b opportunities nhe hain forex shopping for and promoting essential pratice kare pointers ko look at karna parta hain jaaab tak hints ko observe nhe kia jata han tu kamyabi b nhe hain is liye learning kare forex maximum vital gain hasil karna hain tu foreign exchange predominant pointers ko follow kare achi kamyabi ok liyte forex shopping for and promoting maximum crucial pratice kiare foreign exchange shopping for and selling primary jaaab tak gaining knowledge of nhe hain tu big loss ho skta hain loss say relaxed rehna hain tu difficult art work karna parta hain
                • <a href="https://www.instaforex.org/ru/?x=ruforum">InstaForex</a>
                • #9 Collapse

                  Re: Double Bottom Chart Pattern In Forex

                  The Forex market trading me turn point se murad wo factor jis pe aik style rukh jata hai, aur us point tak market ki rate pohunchne alright terrible bar wapis ati hai. Hit bhi aik hold style forex trading market me chahay wo up angle pe ho ya descending side pe aik khas capability ko contact karne alright terrible converse ho jata hai aur us alright awful pattern inversion ho jata hai forex exchanging ka turn factor hota hai. Is point pe commercial center ki costs pohunch to jati hai lekin is factor ko cut up nahi karti hai. Forex exchanging me punch bhi ye point wreck ho jata hai to ye turn factor nahi rehta hai. Turn factor se style inversion ho jata hai. The Forex market trading me aksar murmur signs pe dekhte bird alright wo mukhtalif qisam ki obstruction aur guide levels ko show karti hai jis se propensities wapis ati hai. Turn point hamare risestance aur help levels ka wo last point hota hai ji se style ne return returned karna hota hai.

                  ⏬ Useage:-

                  the Forex market trading mama hamy pata hai OK ham market ki guide or opposition ko samaj kar exchange karyn to profit ko hasil karna bhot simple ho jata hai. In any case, agr ham market ki help or opposition ko ignorr kar deyn to hamary lae pay ko hasil kar pana bhot mushkil ho jata hai. Turn focuses mama ham commercial center ki help or obstruction ko mazeed more modest variables mama partition kar lety hain jis alright awful hamy commercial center ko smajnay mama or b asani hoti hai. Agr ham market ko samajy gy ni or tokky sy change mama in hony ki khosis karyn gy to hamy etna misfortune ho ga k record bacha pana he mushkil ho jata hai. Forex trading mama turn factor ko attract karna ah jae to broker ko bhot asani hoti hai or wo asy entery factor hasil kar leta hai jo har dealer ko hasil ni hoty. So ham ye keh sakty hain alright hamy apni exchanges ko turn factors k sath control karna chahiye or es base standard he exchange ko open or exit karna chahiye.

                  ➡️Portrayal:-

                  Turn factor specialized marker ka ek crucial rule hai turn point ki madad se Hamen market Mein is chij Ka Pata Chalta Kis chij Ko Humne bears karne aur Kis chij Ko Humne seiling karna hai turn factor Ek Aisa stage Hai jismein commercial center Apna design Badalti rahti hai turn factor ko ham unfamiliar trade commercial center Mein Ham point of convergence bhi Kh sakte hain turn factor stage ko banane ke liye three point ki jarurat hoti hai number 1 high amount 2 low and wide assortment three close to Forex exchanging ke undertaking Mein Punch Ham pivate point right computation kar lete hain To ismein Ham market Primary acchi Tarah Se passage Le sakte hain.

                  اب آن لائن

                  Working...
                  X