Harmonic price chart patterns

No announcement yet.
`
X
  • وقت
  • دکھائیں
Clear All
new posts
  • #1 Collapse

    Harmonic price chart patterns
    Harmonic price chart patterns, trading mein aik aham technical analysis tool hain jo traders istemal karte hain taake wo financial markets mein potential reversal points ko pehchaan sakein. Ye patterns Fibonacci retracement levels aur geometric price formations par mabni hoti hain. Traders ka khayal hai ke harmonic patterns market trends ke bare mein qeemati insights faraham kar sakti hain aur unhein zyada behtar trading decisions lene mein madad kar sakti hain.

    Gartley Pattern

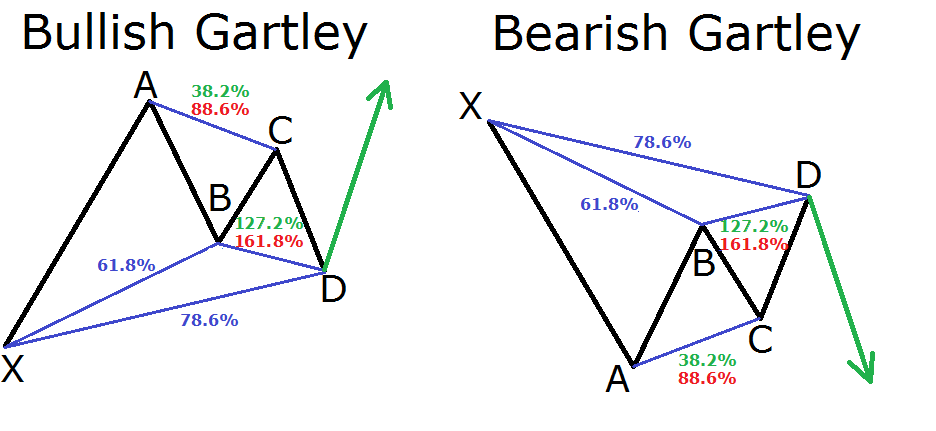
    Ek mashhoor harmonic pattern Gartley pattern hai. Ye pattern char price swings se bana hota hai, jo chart par M ya W shape banata hai. Gartley pattern ko pehchaan ne ke liye istemal hone wale key Fibonacci retracement levels 0.618 aur 0.382 hote hain. Traders specific ratios ko check karte hain in levels ke darmiyan taake pattern ki sahiyat ko confirm kar sakein.

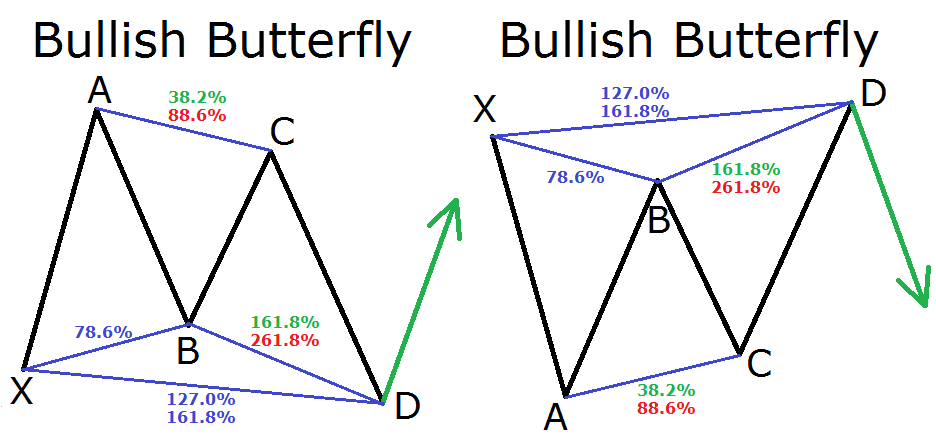
    Ek aur common harmonic pattern Butterfly pattern hai. Ye pattern ek butterfly ke wings jaise hota hai aur paanch price swings se bana hota hai. Butterfly pattern ke liye key Fibonacci levels 0.786 aur 1.272 hote hain. Traders in ratios ko istemal karte hain ek valid Butterfly pattern ko doosri price movements se pehchaan ne ke liye.


    Bat Pattern

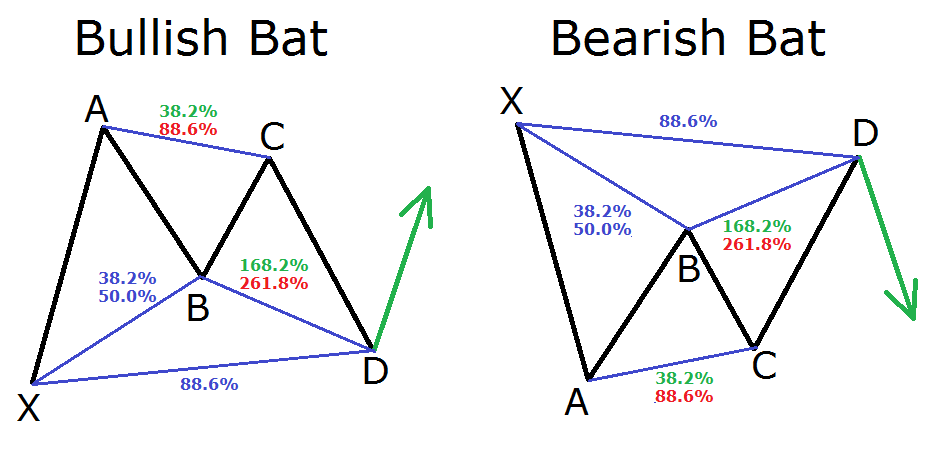
    Bat pattern bhi ek aham harmonic pattern hai jo traders aksar dhoondhte hain. Ye pattern Gartley pattern ki tarah hota hai lekin alag Fibonacci ratios ke saath. Bat pattern ke liye key levels 0.886 aur 0.786 hote hain. Traders in levels ke aas paas price action ko analyze karte hain taake Bat pattern ki mojoodgi ko confirm kar sakein.

    Harmonic patterns ka aik faida ye hai ke ye clear entry aur exit points faraham kar sakti hain trades ke liye. Traders ek harmonic pattern ka completion as a signal istemal kar sakte hain ek trade mein enter hone ke liye expected reversal ke direction mein. Wo pattern ki structure ke basis par stop-loss orders set kar sakte hain risk ko effectively manage karne ke liye.

    Magar yaad rahe ke harmonic patterns foolproof nahi hoti aur inhein doosre technical analysis tools aur risk management strategies ke saath istemal karna chahiye. Market conditions jaldi badal sakti hain aur patterns hamesha expected tarah se kaam nahi kar sakte. Traders ko hamesha ehtiyaat aur thorough analysis ka amal karna chahiye trading decisions lene se pehle harmonic patterns par buniyadi research karte hue.

    Shark Pattern

    Gartley, Butterfly, aur Bat patterns ke ilawa bhi kai aur harmonic patterns hote hain jo traders ko milte hain. Ye patterns include karte hain Crab pattern, Shark pattern, aur Cypher pattern, har pattern apni set of Fibonacci ratios aur price characteristics ke saath. Traders jo harmonic pattern trading mein specialize karte hain wo in patterns ko extensively study karte hain takay unki trading accuracy improve ho sake.

    Kuch traders automated tools aur software programs ka istemal karte hain harmonic patterns ko scan karne ke liye price charts par. Ye tools potential opportunities ko zyada efficiently identify karne mein madadgar ho sakti hain aur manual analysis par zyada time na lagayein. Magar zaroori hai ke traders harmonic patterns ke principles ko samajhne ke liye aur automated signals par pura bharosa na karein.

    Harmonic price chart patterns traders ke liye aik aisa qeemati tool hain jo unhein financial markets mein potential reversal points ko pehchaanne mein madad faraham kar sakti hain. Ye patterns Fibonacci retracement levels aur geometric price formations par mabni hote hain, clear entry aur exit points faraham kar ke trades ke liye. Halan ke harmonic patterns trading strategies ko enhance kar sakti hain, lekin inhein doosri analysis techniques aur risk management strategies ke saath istemal karna chahiye behtareen nataij ke liye.
    Believe in yourself and your abilities. When you fight for your dreams, you can achieve anything.
  • <a href="https://www.instaforex.org/ru/?x=ruforum">InstaForex</a>
  • #2 Collapse

    Double Top (Dohra Chhat):

    A double top pattern is a technical analysis charting pattern that indicates a potential reversal of an uptrend. It forms when the price reaches a peak, retreats, then rallies to a similar peak before reversing direction. The two peaks create a resistance level, suggesting that buyers are struggling to push the price higher. Traders often wait for confirmation, such as a break below the pattern's neckline, before considering short positions.

    2. Double Bottom (Dohra Neecha):

    Conversely, a double bottom pattern signals a potential reversal of a downtrend. It occurs when the price reaches a low, bounces back, then revisits the same low before reversing direction. The two lows form a support level, indicating that sellers are losing momentum and buyers are gaining control. Traders typically wait for confirmation, such as a break above the pattern's neckline, before considering long positions.

    3. Head and Shoulders (Sar aur Kandhon):

    The head and shoulders pattern is one of the most well-known reversal patterns. It consists of three peaks: a higher peak (head) flanked by two lower peaks (shoulders). The neckline connects the lows of the two shoulders. This pattern suggests that an uptrend is losing momentum, with the central peak acting as a key resistance level. Traders often look for a break below the neckline as confirmation of a trend reversal.

    4. Inverse Head and Shoulders (Ulat Sar aur Kandhon):

    An inverse head and shoulders pattern is the bullish counterpart to the head and shoulders pattern. It consists of three troughs: a lower trough (head) between two higher troughs (shoulders). The neckline connects the highs of the two shoulders. This pattern indicates that a downtrend is losing momentum, with the central trough acting as a key support level. Traders often look for a break above the neckline as confirmation of a trend reversal.

    5. Triangles (Tikona):

    Triangle patterns form when the price consolidates, creating converging trendlines. They indicate a period of indecision in the market, with buyers and sellers closely matched. Ascending triangles have a flat top and a rising bottom, suggesting bullish continuation. Descending triangles have a flat bottom and a declining top, suggesting bearish continuation. Symmetrical triangles have both trendlines converging, indicating a potential breakout in either direction.

    6. Flags (Jhanda):

    Flag patterns occur within a short-term trend and represent brief pauses or consolidation periods. They consist of a sharp price movement (flagpole) followed by a rectangular-shaped consolidation (flag). Bullish flags slope against the prevailing trend, while bearish flags slope with the trend. Traders often enter trades in the direction of the prevailing trend when the price breaks out of the flag pattern.

    7. Pennants (Nishan-e-Nau):

    Pennants are similar to flags but have a narrower consolidation range. They occur after strong price movements and represent temporary pauses in the trend. Bullish pennants slope against the prevailing trend, while bearish pennants slope with the trend. Traders typically enter trades in the direction of the breakout when the price exits the pennant pattern.

    8. Wedges (Kila):

    Wedge patterns resemble triangles but have a narrower shape, with both trendlines slanting in the same direction. They indicate a decrease in volatility and often precede trend continuation or reversal. Rising wedges have a bearish bias, with lower highs and lower lows. Falling wedges have a bullish bias, with higher lows and lower highs.

    9. Cup and Handle (Kap aur Handle):

    A cup and handle pattern consists of a rounded bottom (cup) followed by a small consolidation (handle). It's a bullish continuation pattern that suggests a temporary pause in the uptrend before further upside movement. Traders often enter long positions when the price breaks out above the handle's resistance level, targeting a measured move based on the depth of the cup.

    10. Gartley Pattern (Gartley Mawaqay):

    The Gartley pattern is a harmonic chart pattern that consists of four distinct price swings, forming specific geometric shapes. It's based on Fibonacci ratios and helps traders identify potential trend reversals. The pattern is named after H.M. Gartley, who introduced it in his book "Profits in the Stock Market."

    11. Bat Pattern (Chamgadar Mawaqay):

    The bat pattern is another harmonic pattern derived from Fibonacci ratios. It consists of precise price movements that form distinct geometric shapes. The pattern helps traders identify potential trend reversals and provides specific entry and exit points based on Fibonacci levels.

    12. Crab Pattern (Keera Mawaqay):

    The crab pattern is a harmonic chart pattern that also relies on Fibonacci ratios. It consists of precise price movements that form specific geometric shapes. Like other harmonic patterns, the crab pattern helps traders identify potential trend reversals and plan their trading strategies accordingly.

    13. Butterfly Pattern (Titli Mawaqay):

    The butterfly pattern is a harmonic chart pattern based on Fibonacci ratios. It consists of precise price movements that form distinct geometric shapes. The pattern helps traders identify potential trend reversals and provides specific entry and exit points based on Fibonacci levels.
    Understanding these harmonic chart patterns can enhance a trader's ability to analyze price action and make informed trading decisions. However, it's essential to combine pattern recognition with other technical indicators and risk management strategies for successful trading outcomes. Additionally, traders should always practice due diligence and verify patterns with multiple timeframes and confirmation signals before executing trades.
    • #3 Collapse


      Harmonic Price Chart Patterns in Forex Trading

      Forex trading, ek challenging aur dynamic market hai jahan traders different strategies aur patterns ka istemal karte hain taake predict karein future price movements. Harmonic price chart patterns ek aham tool hain jise traders istemal karte hain taake market trends ko analyze karein aur profitable trading decisions lein.

      Harmonic Patterns Ki Ahmiyat: Harmonic patterns, market ka natural behavior darust karte hain aur price movements mein geometric structures aur ratios ka use karte hain. In patterns mein Fibonacci retracement aur extension levels ka istemal hota hai, jo price movements ko analyze karne mein madadgar hota hai.

      Click image for larger version

Name:	download.jpg
Views:	64
Size:	11.8 کلوبائٹ
ID:	12892750

      Mukhtalif Harmonic Patterns:
      1. ABCD Pattern: Ye pattern market mein common hota hai aur price ka direction identify karne mein madad karta hai. Is pattern mein 3 retracement levels hote hain: AB, BC, CD.
      2. Gartley Pattern: Ye pattern market mein reversal points ko indicate karta hai. Gartley pattern mein price ka movement specific Fibonacci levels ke around hota hai.
      3. Butterfly Pattern: Butterfly pattern mein bhi price ka movement Fibonacci levels ke around hota hai, lekin is pattern mein BC retracement level 0.786 hota hai.
      4. Bat Pattern: Bat pattern bhi reversal points ko identify karta hai. Is pattern mein CD extension level 0.886 hota hai.
      Click image for larger version

Name:	Crab-Harmonic-4.png
Views:	60
Size:	18.2 کلوبائٹ
ID:	12892751

      Harmonic Patterns Ka Istemal:
      1. Identifying Entry Points: Harmonic patterns ko istemal karke traders entry aur exit points ko identify karte hain. Ye patterns specific points pe price ka reversal ya continuation indicate karte hain.
      2. Risk Management: Ye patterns risk management ke liye bhi ahem hain. Traders in patterns ko istemal karke stop loss aur take profit levels set karte hain taake apne trades ko control mein rakhein.
      3. Confirmation Ke Liye: Harmonic patterns ko confirm karne ke liye traders doosre technical indicators aur price action analysis ka istemal karte hain. Is tarah se, ye patterns ki reliability ko barhate hain.
      Click image for larger version

Name:	5d158e17e574b5594dce6d3440151861.jpeg
Views:	60
Size:	222.5 کلوبائٹ
ID:	12892752

      Nateeja: Harmonic price chart patterns, forex trading mein ek powerful tool hain jo traders ko market movements ko samajhne aur profitable trades execute karne mein madad karta hai. Lekin, traders ko patterns ko sahi tarah se samajhna aur unka istemal karne ke liye proper training aur practice ki zarurat hoti hai. Is tarah se, traders apne trading strategies ko enhance karke consistent profits earn kar sakte hain.
      • #4 Collapse


        Harmonic price chart patterns


        Harmonic price chart patterns forex trading mein istemal hone wale kuch specific chart patterns hote hain jo market mein price movements ka analysis karne mein madadgar hote hain. Ye patterns market mein price ka direction aur potential future movements ko anticipate karne mein madad karte hain. Kuch popular harmonic price chart patterns hain:
        1. Gartley Pattern: Ye pattern market mein price reversal ko indicate karta hai. Isme typically price ka correction hota hai aur phir original trend mein wapis jaane ka indication hota hai. Gartley pattern mein Fibonacci retracement levels ka bhi use hota hai.
        2. Bat Pattern: Bat pattern mein bhi Fibonacci retracement levels ka use hota hai. Ye pattern market mein potential reversals ko identify karta hai.
        3. Butterfly Pattern: Butterfly pattern bhi price reversals ko indicate karta hai, lekin ismein specific Fibonacci levels ka use hota hai.
        4. Cypher Pattern: Cypher pattern bhi price reversals ko highlight karta hai. Is pattern mein Fibonacci retracement levels ka use hota hai aur market mein trend reversal ka potential hota hai.
        5. ABCD Pattern: ABCD pattern mein price movement ka specific structure hota hai, jismein Fibonacci levels ka bhi use hota hai. Ye pattern price ka potential target point bhi indicate karta hai.
        Harmonic price chart patterns ka use traders aur investors market mein price movements ko predict karne ke liye karte hain. Ye patterns technical analysis ka important hissa hote hain aur sahi taur par identify karke istemal kiye ja sakte hain trading decisions ke liye.

        Harmonic price chart patterns ko identify karne ke liye traders Fibonacci retracement aur extension tools ka istemal karte hain, aur ye patterns ke liye specific rules aur guidelines follow karte hain. Ye patterns ki madad se traders market mein price movements ka better understanding karte hain aur trading decisions lete hain.


        • #5 Collapse

          Forex trading ek bohot hi dynamic aur exciting market hai jahan har second kuch naya ho sakta hai. Yahan currencies ke buying aur selling ka khel hota hai, jisme traders apne strategies aur analysis ke zariye profits earn karte hain. Ek important aspect jo traders ke liye crucial hota hai woh hai market ki trends aur patterns ko samajhna. Aur isme ek powerful tool hai "Harmonic Price Chart Patterns". In patterns ko samajh kar, traders apni trading decisions ko refine kar sakte hain aur market mein successful trades kar sakte hain.

          1. Harmonic Price Chart Patterns Kya Hain?

          Harmonic price chart patterns, market mein hone wale price movements ka graphical representation hote hain jo Fibonacci numbers aur ratios par based hota hai. In patterns ko analyze karne ke liye, traders Fibonacci retracement aur extension levels ka istemal karte hain. Yeh patterns market mein hone wale potential reversals aur price targets ko identify karne mein madad karte hain.Harmonic patterns ki basic understanding ke liye Fibonacci retracement aur extension levels ka knowledge zaroori hai. Fibonacci retracement levels market ke previous high aur low points ke beech draw kiya jata hai. Ye levels market mein potential reversal points ko indicate karte hain. Fibonacci extension levels, on the other hand, traders ko market mein potential price targets provide karte hain.

          2. Gartley Pattern

          Gartley pattern ek popular harmonic pattern hai jo market mein reversals ko identify karne mein madad karta hai. Yeh pattern Fibonacci retracement aur extension levels par based hota hai. Gartley pattern mein price action specific ratios ko follow karta hai, jinmein se sabse important ratio hota hai 0.618. Jab price action Fibonacci levels ke sath match karta hai, Gartley pattern confirm hota hai aur traders ko entry aur exit points ka idea milta hai.Gartley pattern ko identify karne ke liye, traders ko price action aur Fibonacci levels ko closely monitor karna hota hai. Agar market mein Gartley pattern detect hota hai, toh traders ko market ke movement ko samajh kar apne trading strategies ko adjust karna chahiye. Gartley pattern ka istemal karke, traders market mein hone wale reversals ko anticipate kar sakte hain aur profitable trades execute kar sakte hain.

          3. Butterfly Pattern

          Butterfly pattern bhi ek powerful harmonic pattern hai jo market mein reversals ko indicate karta hai. Is pattern mein price action ko Fibonacci levels ke sath compare kiya jata hai. Butterfly pattern mein price action Fibonacci ratios ke combinations par depend karta hai, jaise ki 0.786 retracement level. Jab price action specific Fibonacci levels ke sath match karta hai, Butterfly pattern confirm hota hai aur traders ko entry aur exit points decide karne mein madad milti hai.Butterfly pattern ko identify karne ke liye, traders ko market ke movements ko closely observe karna hota hai. Agar market mein Butterfly pattern detect hota hai, toh traders ko market sentiment ko samajh kar apne trading strategies ko adjust karna chahiye. Butterfly pattern ka istemal karke, traders market mein hone wale reversals ko anticipate kar sakte hain aur profitable trades execute kar sakte hain.

          4. Crab Pattern

          Crab pattern bhi ek interesting harmonic pattern hai jo market mein reversals ko predict karta hai. Is pattern mein price action ko Fibonacci levels ke sath analyze kiya jata hai. Crab pattern mein price action Fibonacci ratios ke combinations par depend karta hai, jaise ki 0.382 retracement level. Jab price action specific Fibonacci levels ke sath match karta hai, Crab pattern confirm hota hai aur traders ko entry aur exit points decide karne mein madad milti hai.Crab pattern ko identify karne ke liye, traders ko market ke movements ko closely observe karna hota hai. Agar market mein Crab pattern detect hota hai, toh traders ko market sentiment ko samajh kar apne trading strategies ko adjust karna chahiye. Crab pattern ka istemal karke, traders market mein hone wale reversals ko anticipate kar sakte hain aur profitable trades execute kar sakte hain.

          5. Bat Pattern

          Bat pattern bhi ek useful harmonic pattern hai jo market mein reversals ko identify karta hai. Is pattern mein bhi price action ko Fibonacci levels ke sath compare kiya jata hai. Bat pattern mein price action Fibonacci ratios ke combinations par depend karta hai, jaise ki 0.886 retracement level. Jab price action specific Fibonacci levels ke sath match karta hai, Bat pattern confirm hota hai aur traders ko entry aur exit points decide karne mein madad milti hai.Bat pattern ko identify karne ke liye, traders ko market ke movements ko closely observe karna hota hai. Agar market mein Bat pattern detect hota hai, toh traders ko market sentiment ko samajh kar apne trading strategies ko adjust karna chahiye. Bat pattern ka istemal karke, traders market mein hone wale reversals ko anticipate kar sakte hain aur profitable trades execute kar sakte hain.

          6. Harmonic Patterns ka Istemal

          Harmonic patterns ko samajh kar, traders market mein hone wale potential reversals aur price targets ko identify kar sakte hain. In patterns ko istemal karke, traders apni entry aur exit points ko define kar sakte hain, jisse unka trading performance improve hota hai. Harmonic patterns ka istemal karke, traders apne trading strategies ko enhance kar sakte hain aur market mein consistent profits generate kar sakte hain.
          Harmonic patterns ke istemal mein, traders ko market ki movements ko closely monitor karna hota hai aur patterns ko accurately identify karna hota hai. Jab traders patterns ko samajh lete hain, toh unhe market mein hone wale potential reversals aur price targets ka pata chal jata hai. Isse traders apne trades ko better plan kar sakte hain aur market mein successful trades execute kar sakte hain.

          7. Risks aur Challenges

          Harmonic patterns ka istemal karne ke bawajood, market mein hamesha risks aur challenges hote hain. Market volatility, false signals, aur unexpected events traders ke liye challenges create kar sakte hain. Isliye, traders ko hamesha proper risk management aur thorough analysis par focus karna chahiye.
          Harmonic patterns ki understanding ke saath-saath, traders ko market risks ko bhi samajhna zaroori hai. Market mein hone wale sudden changes aur unexpected events traders ke liye challenges create kar sakte hain. Isliye, traders ko hamesha apne trades ko monitor karna chahiye aur market ki movements ko closely observe karna chahiye.


          8. Market Analysis aur Strategy Development

          Harmonic patterns ke sath-sath, traders ko market analysis aur strategy development par bhi focus karna chahiye. Market analysis karne se traders ko market trends aur potential opportunities ka pata chalta hai. Iske liye, traders ko technical aur fundamental analysis ka istemal karna chahiye. Technical analysis mein price action, indicators, aur chart patterns ka study hota hai, jabki fundamental analysis mein economic indicators, news, aur geopolitical events ka impact study kiya jata hai.Strategy development mein, traders ko apni risk tolerance, trading goals, aur market conditions ko consider karna chahiye. Ek robust trading strategy banane ke liye, traders ko entry aur exit rules ko clearly define karna chahiye, sath hi risk management techniques ka istemal karna chahiye. Strategy development process mein, traders ko apne strengths aur weaknesses ko bhi analyze karna chahiye aur unke hisab se apni strategy ko customize karna chahiye.

          9. Technical Tools aur Indicators

          Harmonic patterns ke sath-sath, traders ko technical tools aur indicators ka bhi istemal karna chahiye. Technical tools aur indicators market analysis mein madad karte hain aur traders ko entry aur exit points ka pata lagane mein help karte hain. Kuch popular technical tools aur indicators mein Moving Averages, Relative Strength Index (RSI), aur Bollinger Bands shamil hain.Moving Averages traders ko market trend ko identify karne mein madad karte hain. RSI overbought aur oversold conditions ko identify karne mein madad karta hai. Bollinger Bands volatility aur price range ko analyze karne mein help karte hain. In technical tools aur indicators ka sahi istemal karke, traders apni analysis ko aur bhi reliable bana sakte hain aur market mein hone wale opportunities ko identify kar sakte hain.

          10. Risk Management

          Harmonic patterns trading mein ek important aspect hai risk management. Traders ko apne trades ko properly manage karne ke liye risk management techniques ka istemal karna chahiye. Ismein position sizing, stop-loss orders, aur risk-reward ratio ka dhyan rakhna zaroori hai. Traders ko apne trading capital ko protect karne ke liye apne risk exposure ko control karna chahiye.Risk management ke bina, trading mein losses ka risk badh jata hai aur traders ka confidence bhi kam ho jata hai. Isliye, traders ko apne trades ko monitor karna aur losses ko minimize karne ke liye proactive approach rakhna chahiye. Ek robust risk management strategy traders ko market volatility aur uncertainties ke against protect karta hai aur unhe long-term success ki taraf le jata hai.

          11. Trading Psychology

          Trading psychology bhi ek crucial aspect hai jo traders ke success par impact dalta hai. Emotions jaise ki fear, greed, aur overconfidence traders ke decisions ko influence kar sakte hain aur unhe impulsive trades par le jate hain. Isliye, traders ko apne emotions ko control karna aur disciplined approach maintain karna chahiye.
          Trading psychology ko samajhne ke liye, traders ko apne mental state ko monitor karna chahiye aur apne trading decisions par rational approach rakhna chahiye. Iske liye, traders ko apne trades ko journal mein record karna, aur apne trading plan ko follow karna chahiye. Discipline aur patience ke sath trading karne se traders apne psychological biases ko overcome kar sakte hain aur consistent profits generate kar sakte hain.

          12. Continuous Learning aur Improvement

          Harmonic patterns trading mein, learning aur improvement ka process hamesha chalta rehta hai. Market dynamics mein hone wale changes aur new strategies ke sath-sath, traders ko bhi apne knowledge ko update karte rehna chahiye. Iske liye, traders ko books, online courses, aur webinars ka istemal karna chahiye. Sath hi, traders ko apne trades ko review karna aur mistakes se seekhna bhi zaroori hai.
          Continuous learning aur improvement ke through, traders apne skills ko enhance kar sakte hain aur market mein successful trades execute kar sakte hain. Ismein, traders ko apne weaknesses ko identify karke unpar kaam karna chahiye aur apne strengths ko maximize karne ke liye efforts lagana chahiye. Sath hi, traders ko apne trading strategies ko adapt karte hue market ke changes ke sath pace rakhna chahiye.

          13. Conclusion

          Harmonic price chart patterns forex trading mein ek important aspect hai jo traders ko market trends aur reversals ko samajhne mein madad karta hai. In patterns ko samajh kar, traders apni trading strategies ko refine kar sakte hain aur consistent profits generate kar sakte hain. Lekin, traders ko hamesha market risks, technical tools, risk management, aur trading psychology ka bhi dhyan rakhna chahiye.
          Market mein hone wale uncertainties aur risks ke against, traders ko disciplined aur rational approach maintain karna chahiye. Iske sath-sath, traders ko apne skills ko continuously improve karte rehna chahiye aur market ke changes ke sath pace rakhna chahiye. Overall, harmonic patterns trading journey ko enhance karte hain aur traders ko market mein ek edge provide karte hain jo unhe successful aur profitable trades karne mein madad karta hai.


          • #6 Collapse

            Harmonic price chart patterns


            Click image for larger version

Name:	download (45).png
Views:	59
Size:	5.9 کلوبائٹ
ID:	12892803


            Harmonic price chart patterns, ya phir sirf harmonic patterns, ek advanced technical analysis concept hai jo traders aur investors ke liye market trends aur price movements ko analyze karne mein madadgar hota hai. Ye patterns price action, Fibonacci levels, aur geometry principles par based hote hain aur market mein potential entry aur exit points ko identify karne mein istemal kiye jate hain.

            Harmonic patterns ka concept traders aur investors ko market mein specific geometric structures aur price relationships ko dhyan mein rakhne ke liye sikhaata hai. Ye patterns ek combination hote hain Fibonacci retracement levels, extensions, aur price swings ke sath.

            Yahaan kuch pramukh harmonic price chart patterns ka zikar kiya gaya hai:
            1. ABCD Pattern:
              • ABCD pattern ek basic harmonic pattern hai jismein ek price movement ko represent karte hain.
              • Is pattern mein price movement ko four legs mein divide kiya jata hai: AB leg, BC leg, CD leg, aur AD leg.
              • Fibonacci retracement levels aur extensions ko use karke traders price ke potential reversal points ko identify karte hain.
            2. Gartley Pattern:
              • Gartley pattern mein price movement ko ABCD pattern ke sath harmonic relationships ke sath combine kiya jata hai.
              • Is pattern mein Fibonacci retracement levels aur extensions ka istemal hota hai aur traders ko market mein reversal points ko anticipate karne mein madad karta hai.
            3. Butterfly Pattern:
              • Butterfly pattern ek complex harmonic pattern hai jismein price movement ko specific Fibonacci relationships ke sath combine kiya jata hai.
              • Is pattern mein price movement ko AB=CD structure ke sath dekha jata hai aur Fibonacci retracement levels ka bhi istemal hota hai.
            4. Bat Pattern:
              • Bat pattern mein bhi price movement ko Fibonacci retracement levels aur extensions ke sath analyze kiya jata hai.
              • Is pattern mein specific ratios aur geometric structures ko dhyan mein rakha jata hai jo ki market mein potential reversal points ko indicate karte hain.
            5. Cypher Pattern:
              • Cypher pattern mein price movement ko AB=CD structure aur Fibonacci ratios ke sath evaluate kiya jata hai.
              • Is pattern mein specific Fibonacci retracement levels aur extensions ka istemal hota hai market mein potential entry aur exit points ko identify karne ke liye.

            Harmonic price chart patterns ka istemal karke traders aur investors market mein potential reversal points, trend continuations, aur price targets ko identify kar sakte hain. Ye patterns market sentiment aur price action ko analyze karne mein madad karte hain aur trading decisions lene mein helpful hote hain.

            Lekin, harmonic patterns ka istemal karne ke liye traders ko in patterns ko samajhna, recognize karna, aur unhe confirm karna seekhna zaroori hai. Iske sath hi, proper risk management aur trading strategy ka bhi istemal karna important hai taki trading decisions robust aur successful ho sakein.


            • #7 Collapse

              Harmonic Price Chart Patterns: Ek Ghair Mawafiq Tarz-e-Charts


              Click image for larger version

Name:	download (46).png
Views:	57
Size:	11.4 کلوبائٹ
ID:	12893325

              Introduction: Harmonic price chart patterns ek aham tool hain jo investors aur traders ke liye technical analysis mein istemal hoti hain. Ye patterns market ki behavior ko samajhne aur future price movements ka andaza lagane mein madadgar sabit ho sakte hain. Is blog mein, hum harmonic price chart patterns ke bare mein gehraee se baat karenge aur inke kuch mukhtalif qismon par roshni dalenge.

              1. Kya Hain Harmonic Price Chart Patterns? Harmonic price chart patterns market mein mukhtalif price movements ko identify karne ka tareeqa hain. Ye patterns geometrical shapes ki shakal mein hote hain jo price charts par ban jate hain. In patterns ko recognize kar ke traders price movements ka andaza lagate hain aur trading decisions lete hain.

              2. Mukhtalif Qisam ki Harmonic Price Chart Patterns:
              • Bat Pattern: Ye pattern market mein trend reversal ko indicate karta hai. Is pattern mein price chart par specific shape banti hai jo bullish ya bearish trend ko indicate karta hai.
              • Gartley Pattern: Gartley pattern ek complex pattern hai jo Fibonacci retracement levels par based hota hai. Ye pattern market mein trend reversal aur continuation ko indicate karta hai.
              • Butterfly Pattern: Butterfly pattern mein price chart par butterfly ki shakal banti hai jo price reversals ko indicate karta hai.
              • Cypher Pattern: Cypher pattern ek complex pattern hai jo market mein trend reversal ko indicate karta hai. Is pattern mein Fibonacci retracement levels ka istemal hota hai.

              3. Kaise Harmonic Price Chart Patterns Istemal Kiye Jate Hain?
              • Traders harmonic price chart patterns ko price charts par identify karte hain.
              • In patterns ko confirm karne ke liye Fibonacci retracement levels aur other technical indicators ka istemal hota hai.
              • Jab patterns confirm ho jate hain, traders trading decisions lete hain jaise ke entry aur exit points tay karna.

              4. Fawaid aur Nuqsanat:
              • Fawaid:
                • Harmonic price chart patterns trading mein madadgar ho sakte hain price movements ko predict karne mein.
                • In patterns ka istemal kar ke traders apne trading strategies ko improve kar sakte hain.
                • Ye patterns market trends ko samajhne aur analyze karne mein madadgar sabit ho sakte hain.
              • Nuqsanat:
                • In patterns ko identify karna mushkil ho sakta hai aur galat identification se nuqsaan ho sakta hai.
                • Ye patterns complex hote hain aur beginners ke liye samajhna mushkil ho sakta hai.
                • Kabhi kabhi false signals bhi generate ho sakte hain jo traders ko nuqsaan mein daal sakte hain.

              5. Usool aur Tips:
              • Harmonic price chart patterns ko identify karne ke liye traders ko patience aur practice ki zaroorat hoti hai.
              • In patterns ko confirm karne ke liye always doosre technical indicators ka istemal karna chahiye.
              • Traders ko apni risk management strategy ko bhi dhyan mein rakhna chahiye jab wo in patterns ka istemal karte hain.

              6. Misaal:
              • Ek misaal ke tor par, agar ek trader Gartley pattern ko price chart par identify karta hai aur wo pattern confirm hota hai toh trader ek bullish ya bearish trade enter kar sakta hai, depending on the direction of the pattern.

              Ikhtitami Guftagu: Harmonic price chart patterns trading mein ek ahem tool hain jo traders ko price movements ko analyze karne aur trading decisions lene mein madad dete hain. Lekin, in patterns ko samajhna aur sahi tareeqe se istemal karna traders ke liye mushkil ho sakta hai. Isliye, traders ko patience aur practice ke sath in patterns ko samajhna chahiye aur always apni risk management strategy ko dhyan mein rakhna chahiye.
              • #8 Collapse

                Harmonic price chart patterns Kya hain?

                Harmonic price chart patterns are geometric patterns that are formed by the movement of prices in financial markets. They are based on the Fibonacci sequence, which is a series of numbers in which each number is the sum of the two previous numbers. The Fibonacci sequence is often used in technical analysis to identify potential support and resistance levels.
                Harmonic price chart patterns are believed to be predictive of future price movements. They are based on the idea that prices tend to retrace or extend to specific Fibonacci levels. For example, a bullish Gartley pattern is a harmonic pattern that is formed by a series of five price swings. The first four swings form a bullish ABCD pattern, and the fifth swing extends to the 1.618 Fibonacci level of the first swing. This pattern is believed to be a sign of a potential trend reversal.
                There are many different harmonic price chart patterns. Some of the most common patterns include the Gartley pattern, the Butterfly pattern, the Bat pattern, and the Crab pattern. Each pattern has its own set of rules that must be met in order for it to be considered valid.
                Click image for larger version

Name:	t211.png
Views:	54
Size:	41.6 کلوبائٹ
ID:	12893489
                Harmonic price chart patterns can be used to trade stocks, forex, commodities, and other financial instruments. They can be used to identify potential trend reversals, support and resistance levels, and trading targets. However, it is important to remember that harmonic price chart patterns are not a guarantee of future profits. They should be used in conjunction with other technical analysis tools to make informed trading decisions.


                Here are some of the benefits of using harmonic price chart patterns:
                • They can help you to identify potential trend reversals.
                • They can help you to identify support and resistance levels.
                • They can help you to identify trading targets.
                • They can be used to trade stocks, forex, commodities, and other financial instruments.


                Here are some of the drawbacks of using harmonic price chart patterns:
                • They can be difficult to identify.
                • They are not a guarantee of future profits.
                • They should be used in conjunction with other technical analysis tools.
                Click image for larger version

Name:	fetch.php
Views:	52
Size:	76.0 کلوبائٹ
ID:	12893490
                If you are interested in learning more about harmonic price chart patterns, there are a number of resources available online. There are also a number of books and courses that can teach you how to use harmonic patterns to trade financial markets.


                Here are some resources where you can learn more about harmonic price chart patterns:
                • Harmonic Trading by Scott M. Carney: [Invalid URL remove kiya gaya]
                • Harmonic Patterns: Trading the Markets Using Fibonacci Ratios by Larry Pesavento: [Invalid URL remove kiya gaya]
                • The Harmonic Trader by Scott Carney: [Invalid URL remove kiya gaya]
                • Harmonic Patterns for Dummies by Mark A. Davis: [Invalid URL remove kiya gaya]
                • #9 Collapse

                  Harmonic price chart patterns.


                  Harmonic price chart patterns geometric shapes hote hain jo price action ko analyze karne ke liye istemal kiye jate hain. Ye patterns traders ko market mein potential reversal points ya trend continuation points ka pata lagane mein madadgar hote hain.

                  Kuch popular Harmonic patterns hain.


                  1.ABCD Pattern.


                  Ye ek basic pattern hai jisme price ek ABCD structure follow karta hai. Ye pattern trend reversal ya continuation ka signal deta hai.

                  2.Gartley Pattern.


                  Ye pattern AB=CD pattern par based hota hai, lekin isme Fibonacci levels bhi istemal kiye jate hain.


                  3.Butterfly Pattern.


                  Ye pattern Gartley pattern ka extension hai, jisme price ka movement specific Fibonacci ratios ko follow karta hai.
                  .

                  4.Bat Pattern.


                  Ye pattern bhi Fibonacci ratios par based hai aur price ka movement specific levels ko follow karta hai.


                  5.Cypher Pattern.


                  Is pattern mein bhi Fibonacci levels ko dekhte hue price action ko analyze kiya jata hai.

                  Click image for larger version

Name:	download (3).png
Views:	53
Size:	7.5 کلوبائٹ
ID:	12893552


                  Harmonic price chart patterns ka istemal.


                  Harmonic price chart patterns ka istemal forex trading mein kai maqsadon ke liye kiya jata hai.


                  1.Trend Reversal ki Pehchan.


                  Harmonic patterns traders ko market mein trend reversal points ka pata lagane mein madad karte hain. Jab price pattern ki shape ko follow karta hai, traders reversal ki possibility ko samajhte hain.


                  2.Entry aur Exit Points.


                  In patterns ko follow karke traders entry aur exit points decide karte hain. Agar ek pattern complete hota hai, to traders iska matlab nikal sakte hain ki ab price kis direction mein ja sakta hai.


                  3.Risk Management.


                  Harmonic patterns ke istemal se traders apni stop loss aur take profit levels ko set kar sakte hain. Ye patterns unhein guide karte hain ki kahan stop loss set karna hai aur kahan profit booking karni hai.


                  4.Trading Strategies ki Development.


                  Traders in patterns ko apni trading strategies mein integrate karke apne trading systems ko refine karte hain.


                  5.Market Sentiment ki Samajh.


                  Harmonic patterns ki madad se traders market sentiment ko bhi samajh sakte hain. Agar market mein koi specific pattern zyada bar repeat ho raha hai, to ye ek indication ho sakta hai ki market ka sentiment kya hai.


                  Harmonic price chart patterns ke tips.


                  Harmonic price chart patterns trading mein istemal karte waqt kuch tips aur guidelines hain jo traders ke liye madadgar ho sakte hain.


                  1.Complete Pattern Wait Karen.


                  Pattern complete hone ka wait karen jab tak ki pattern ke sare rules fulfill na ho jayen. Partially formed patterns par trading karne se bachen.


                  2.Confirmatory Indicators Ka Istemal Karein.


                  Harmonic patterns ko confirm karne ke liye kuch aur indicators jaise ki RSI, MACD ya moving averages ka istemal karen. Ye indicators aapko pattern ki validity aur strength ke bare mein additional information provide karenge.


                  3.Risk Management.


                  Har trade mein stop loss aur take profit levels set karen. Ye aapko losses se bachane aur profits ko lock karne mein madadgar honge.


                  4.Multiple Timeframe Analysis.


                  Harmonic patterns ko identify karne aur confirm karne ke liye multiple timeframes ka analysis karen. Choti timeframes aur bade timeframes dono ko dekhte hue pattern ki validity ko confirm karen.


                  5.Patterns ki Accuracy Par Dhyan Dein.


                  Kuch patterns zyada reliable hote hain compared to others. Un patterns par zyada focus karen jinmein aapko zyada confidence ho.


                  6.Practice and Education.


                  Harmonic patterns ko samajhne aur pehchanne ke liye regular practice aur education zaroori hai. Demo account par practice karen aur trading books, courses aur webinars ka istemal karen.


                  7.Emotional Control.


                  Trading mein emotions ko control karna bahut zaroori hai. Trading plan ko follow karen aur apne decisions par confident rahen.


                  8.Pattern Fail Hone Ka Bhi Plan Banaye.


                  Har trade mein profit expectation rakhna zaroori hai, lekin agar pattern fail ho jaye to loss ko manage karne ka bhi plan banaye.

                  Click image for larger version

Name:	download.jpeg
Views:	51
Size:	11.9 کلوبائٹ
ID:	12893553


                  summary.


                  Harmonic price chart patterns ko sahi tareeke se samajhna aur istemal karna traders ke liye challenging ho sakta hai, lekin practice aur patience ke saath ye ek powerful tool ho sakta hai trading mein success ke liye.
                  • #10 Collapse

                    Harmonic price chart patterns


                    Harmonika Keemat Ki Charai Pattern

                    Harmonika keemat ki charai patterns aik mufeed tool hain jo kisi bhi market mein price ki movement ko analyze karne mein istemal ki jati hai. Ye patterns traders ko market trends aur price reversals ka andaza lagane mein madad deti hain. In patterns ki pehchan karke traders apne trading strategies ko improve kar sakte hain aur sahi waqt par trade karte hue apna faida barha sakte hain.
                    1. Head and Shoulders (Sar aur Kandhon ka Pattern): Ye pattern ek trend reversal indicator hai. Ismein price pehle upar jati hai (left shoulder), phir mazeed upar jati hai (head), phir neeche aa jati hai (right shoulder). Jab price right shoulder se neeche jaati hai, to ye bullish trend ka indication hota hai.
                    2. Double Top aur Double Bottom (Do Top aur Do Neeche): Ye patterns bhi trend reversal ke indicators hote hain. Double top mein price do martaba ek level tak pohanchti hai aur phir neeche gir jati hai. Double bottom mein price do martaba ek level tak gir jati hai aur phir upar jaati hai.
                    3. Symmetrical Triangle (Mutmain Samraj): Ye pattern ek continuation indicator hai. Ismein price higher lows aur lower highs ke darmiyan ek triangle form karta hai. Jab price triangle ke kisi taraf se bahar nikalti hai, to ye trend continuation ka signal hota hai.
                    4. Ascending aur Descending Triangle (Bartari aur Girti Samraj): In dono triangles mein bhi price ka movement ek specific direction mein hota hai. Ascending triangle mein price ki highs constant hoti hain jabke lows upar ki taraf badte hain. Descending triangle mein lows constant rehti hain jabke highs neeche ki taraf girte hain.
                    5. Flag aur Pennant (Jhanda aur Parcham): Ye patterns short-term price continuation indicators hote hain. Flag mein price ek horizontal range mein trade karti hai, jabke pennant mein price ek chhoti si range mein trade karti hai.

                    In patterns ko samajhna aur pehchanana traders ke liye zaroori hai taake wo sahi waqt par trading decisions le sakein. Lekin, hamesha yaad rahe ke kisi bhi pattern ka istemal karne se pehle thorough analysis aur risk management zaroori hai.


                    • #11 Collapse

                      **Harmonic Price Chart Patterns: Aaraishat-e-Qeemat Ka Tarteeb**

                      **Introduction:**
                      Harmonic price chart patterns, ya aaraishat-e-qeemat ka tarteeb, forex aur stock market mein istemal honay walay muhim tareen chart patterns mein se ek hain. In patterns ka istemal traders aur investors dwara price movement ko analyze karne ke liye kiya jata hai, taki woh market ki movement ko samajh sakein aur trading decisions le sakein. Aaraishat-e-qeemat ka tarteeb, price action aur Fibonacci retracement levels ke aadhar par banayi jati hain, jo ke market psychology aur supply aur demand dynamics ko reflect karti hain.

                      **1. Aaraishat-e-Qeemat ka Tarteeb ki Ahmiyat:**
                      Aaraishat-e-qeemat ka tarteeb ki pehchan aur samajh traders aur investors ke liye zaroori hai kyunki ye unhein market ki future movement ko predict karne mein madad karta hai. Ye patterns market ki stability, trend reversal aur trend continuation ko samajhne mein madadgar sabit ho sakte hain.

                      **2. Aaraishat-e-Qeemat ka Tarteeb ki Bunyadi Tareeqay:**
                      Aaraishat-e-qeemat ka tarteeb ki bunyadi tareeqay Fibonacci retracement levels aur geometric structures par mabni hoti hain. Ye patterns ke taur par Gartley pattern, Butterfly pattern, Bat pattern, aur Crab pattern shamil hain.

                      **3. Gartley Pattern:**
                      Gartley pattern ek common harmonic pattern hai jo ke price reversal ko indicate karta hai. Ye pattern 4 distinct swings ke zariye banaya jata hai aur price ke retracement levels par mabni hota hai. Gartley pattern ko identify karne ke liye Fibonacci retracement levels ka istemal hota hai.

                      **4. Butterfly Pattern:**
                      Butterfly pattern bhi ek price reversal pattern hai jo ke Gartley pattern ki tarah hota hai. Is pattern mein bhi Fibonacci retracement levels ka istemal hota hai aur price ke movements ko analyze kiya jata hai.

                      **5. Bat Pattern:**
                      Bat pattern bhi ek common harmonic pattern hai jo ke trend reversal ko indicate karta hai. Is pattern mein bhi Fibonacci retracement levels ka istemal hota hai aur price ke movements ko analyze kiya jata hai.

                      **6. Crab Pattern:**
                      Crab pattern ek complex harmonic pattern hai jo ke trend reversal ko indicate karta hai. Is pattern mein bhi Fibonacci retracement levels ka istemal hota hai aur price ke movements ko analyze kiya jata hai.

                      **7. Aaraishat-e-Qeemat ka Tarteeb ke Istemal ka Tareeqa:**
                      Aaraishat-e-qeemat ka tarteeb ke istemal ka tareeqa traders aur investors ke liye ahem hai. Isko samajhne ke liye technical analysis ke maharat aur market ke dynamics ko samajhna zaroori hai.

                      **8. Trading mein Aaraishat-e-Qeemat ka Tarteeb ka Istemal:**
                      Trading mein aaraishat-e-qeemat ka tarteeb ka istemal karte waqt, traders ko price patterns ko recognize karna aur unka significance samajhna zaroori hai. Iske saath hi risk management aur proper entry aur exit points ka dhyan rakhna bhi zaroori hai.

                      **9. Aaraishat-e-Qeemat ka Tarteeb ke Fawaid:**
                      Aaraishat-e-qeemat ka tarteeb ke istemal se traders ko market ki movement ko samajhne mein madad milti hai aur unhein trading decisions lene mein confidence ata hai. Iske saath hi, ye patterns trading strategies ko refine karne mein madadgar sabit ho sakte hain.

                      **10. Aaraishat-e-Qeemat ka Tarteeb ke Challenges:**
                      Aaraishat-e-qeemat ka tarteeb ke istemal mein kuch challenges bhi hote hain jaise ke false signals aur complex patterns ko identify karna. Isliye, traders ko proper training aur practice ki zaroorat hoti hai.

                      **Conclusion:**
                      Aaraishat-e-qeemat ka tarteeb, forex aur stock market mein trading ke liye ahem tools hain jo ke price movement ko analyze karne mein madadgar sabit hote hain. Traders aur investors ko in patterns ko samajhna aur sahi tareeqay se istemal karna zaroori hai taki woh market mein safar kar saken aur apne trading goals ko achieve kar saken.
                      • #12 Collapse

                        Harmonic price chart patterns
                        Harmonic price chart patterns, technical analysis mein use hone wale patterns hote hain jo ki price action aur Fibonacci retracement levels ke combination par based hote hain. In patterns ko traders aur investors use karte hain market movements ko predict karne aur trading opportunities ko identify karne ke liye.

                        Kuch pramukh harmonic price chart patterns hain:
                        1. Gartley Pattern: Gartley pattern ek retracement pattern hai jo ki AB=CD structure par based hota hai. Is pattern mein price mein initial move (AB leg) ke baad retracement hoti hai, phir ek corrective move (BC leg) hoti hai, followed by extension move (CD leg). Ye pattern bullish ya bearish reversals ko indicate karta hai.
                        2. Butterfly Pattern: Butterfly pattern ek reversal pattern hai jo ki Gartley pattern ki variation hai. Ismein retracement levels Fibonacci ratios (typically 0.786) ka use hota hai. Butterfly pattern bullish ya bearish reversals ko indicate karta hai.


                        1. Bat Pattern: Bat pattern ek retracement pattern hai jo ki Gartley pattern ki tarah hota hai, lekin ismein CD leg ki extension hoti hai beyond XA leg ke levels. Ye pattern price reversals ko predict karne mein use hota hai.


                        1. Cypher Pattern: Cypher pattern ek retracement pattern hai jo ki minor price retracements ko identify karta hai major trend ke against mein. Is pattern mein BC leg typically 0.382 se 0.618 Fibonacci retracement level tak hoti hai.
                        2. Shark Pattern: Shark pattern ek reversal pattern hai jo ki strong price reversals ko indicate karta hai. Is pattern mein CD leg typically 1.13 se 1.618 Fibonacci extension level tak extend hoti hai.


                        Treading pattern
                        Ye patterns typically swing trading ya position trading ke liye use kiye jaate hain, aur traders ko entry aur exit points provide karte hain. Har pattern ke specific rules aur guidelines hote hain jinhe follow karke traders in patterns ko identify aur confirm karte hain. Fibonacci retracement aur extension levels ke saath-saath price action analysis aur confirmatory indicators ka bhi istemal hota hai harmonic patterns ko validate karne ke liye.
                        • #13 Collapse

                          Harmonic price chart patterns


                          Harmonic price chart patterns forex trading mein ahem role ada karte hain. Ye patterns market analysis mein istemal hotay hain taake traders ko potential price reversals aur trend continuation ka pata chal sake. Harmonic patterns market ki natural price movements ko capture karte hain aur traders ko entry aur exit points ke liye madadgar hotay hain.
                          Sab se pehlay, ek common harmonic pattern hai "Bat pattern." Ye pattern fibonacci retracement aur fibonacci extension levels ka use karta hai. Bat pattern typically ek price reversal pattern hota hai jise bullish aur bearish market mein dekha ja sakta hai. Is pattern ko identify karne ke liye, traders ko fibonacci ratios aur price action ko closely monitor karna hota hai.


                          Click image for larger version

Name:	images (4) (28).jpeg
Views:	45
Size:	28.8 کلوبائٹ
ID:	12893743


                          Phir aata hai "Gartley pattern," jo ki ek popular harmonic pattern hai. Ye pattern Fibonacci levels aur retracement ratios ka istemal karta hai. Gartley pattern typically ek trend reversal pattern hota hai aur traders ko price reversal ke potential entry aur exit points provide karta hai.
                          "ABCD pattern" bhi ek common harmonic pattern hai jo market mein dekha ja sakta hai. Ye pattern typically ek price continuation pattern hota hai. Traders is pattern ko use karke current trend ke direction mein trading opportunities ko capture kar sakte hain.
                          "Crab pattern" bhi ek important harmonic pattern hai jo market analysis mein istemal hota hai. Ye pattern Fibonacci retracement aur extension levels ka use karta hai aur price reversals ko predict karne mein madadgar hota hai.


                          Click image for larger version

Name:	images (4) (27).jpeg
Views:	43
Size:	48.8 کلوبائٹ
ID:	12893744


                          Harmonic patterns ko identify karne ke liye, traders ko technical analysis aur price action ki acchi understanding honi chahiye. In patterns ko sahi tarah se samajh kar aur analysis karke traders market mein hone wale price movements ko predict kar sakte hain aur trading decisions le sakte hain.
                          In sabhi harmonic patterns ka sahi tarah se istemal karke, traders apne trading strategies ko improve kar sakte hain aur market mein successful trading opportunities explore kar sakte hain. Lekin, harmonic patterns ko identify karna aur unka sahi istemal karne ke liye, traders ko thorough research aur practice ki zarurat hoti hai.


                          • #14 Collapse

                            Harmonic price chart patterns
                            Click image for larger version

Name:	download (38).png
Views:	52
Size:	15.4 کلوبائٹ
ID:	12893751
                            Harmonic price chart patterns forex aur stock markets mein istemal hone wale mukhtalif patterns hain jo traders ko market movements ko predict karne aur trading opportunities ko identify karne mein madadgar hote hain. Ye patterns market mein price action aur geometric relationships par mabni hote hain. Neeche kuch ahem harmonic price chart patterns ke naam aur unke mukhtalif features diye gaye hain:
                            1. Bat Pattern:
                              • Bat pattern ek retracement pattern hai jo fibonacci ratios par based hota hai.
                              • Is pattern mein retracement wave ka extension hota hai jise "XABCD" structure mein represent kiya jata hai.
                            2. Butterfly Pattern:
                              • Butterfly pattern bhi fibonacci ratios par based hota hai.
                              • Is pattern mein retracement wave ka extension hota hai jise "XABCD" structure mein represent kiya jata hai, jahan AB aur CD legs equal hoti hain.
                            3. Gartley Pattern:
                              • Gartley pattern mein retracement aur extension waves ko fibonacci ratios par based kiya jata hai.
                              • Is pattern mein AB aur CD legs equal ya nearly equal hoti hain.
                            4. Cypher Pattern:
                              • Cypher pattern mein retracement aur extension waves ko fibonacci ratios par based kiya jata hai.
                              • Is pattern mein retracement wave ka extension hota hai jise "XABCD" structure mein represent kiya jata hai.
                            5. Crab Pattern:
                              • Crab pattern mein retracement aur extension waves ko fibonacci ratios par based kiya jata hai.
                              • Is pattern mein CD leg ke extension AB leg se zyada hota hai.
                            6. Shark Pattern:
                              • Shark pattern mein retracement aur extension waves ko fibonacci ratios par based kiya jata hai.
                              • Is pattern mein CD leg ke extension XA leg se zyada hota hai.

                            Harmonic price chart patterns ke istemal se traders market mein potential reversals aur continuation points ko identify kar sakte hain. In patterns ko recognize karne ke liye traders ko technical analysis aur fibonacci ratios ke concept ko samajhna zaroori hai. In patterns ke istemal se traders apne trading strategies ko improve kar sakte hain aur market movements ko sahi tareeke se analyze kar sakte hain.
                             
                            • <a href="https://www.instaforex.org/ru/?x=ruforum">InstaForex</a>
                            • #15 Collapse

                              Harmonic price chart patterns


                              Harmonic price chart patterns trading mein ahem hotay hain, jo ke traders ko market trends aur price movements ko samajhne mein madadgar hotay hain. In patterns ki madad se traders market mein mukhtalif price reversals aur trend changes ka andaza lagate hain, jo ke unhein trading decisions mein madad dete hain.

                              Harmonic price chart patterns ka concept technical analysis par mabni hai aur ye patterns price charts par specific geometric shapes banate hain. Ye patterns Fibonacci retracement aur extension levels par base hote hain, jo ke price movements ke specific ratios hote hain.

                              Kuch ahem harmonic price chart patterns darj zail hain:

                              . **Gartley Pattern**: Gartley pattern ek bullish ya bearish reversal pattern hai jo market mein trend ki change ko nishandah karta hai. Is pattern mein price chart par specific Fibonacci levels aur geometric ratios ko follow karte hue specific shape ban jata hai.

                              . **Butterfly Pattern**: Butterfly pattern bhi ek reversal pattern hai jo market mein trend ki change ko indicate karta hai. Is pattern mein price chart par specific retracement aur extension levels ko follow karte hue specific shape ban jata hai.
                              *Bat Pattern**: Bat pattern bhi ek reversal pattern hai jo market mein trend ki change ko darust karta hai. Is pattern mein price chart par specific Fibonacci levels ko follow karte hue specific shape ban jata hai.


                              Click image for larger version

Name:	images (10).jpeg
Views:	56
Size:	54.9 کلوبائٹ
ID:	12893754
                              4Cypher Pattern**: Cypher pattern market mein trend ki continuation ya reversal ko darust karta hai. Is pattern mein price chart par specific retracement aur extension levels ko follow karte hue specific shape ban jata hai.

                              Harmonic price chart patterns ka istemal karke traders market mein price movements ko predict karte hain aur apni trading strategies ko behtar banate hain. Ye patterns market analysis ka aham hissa hain aur traders ko market mein kamiyabi haasil karne mein madad dete hain.

                              Magar, harmonic price chart patterns ko samajhna aur unka sahi istemal karna mushkil ho sakta hai. Iske liye traders ko technical analysis ka mazid kaafi acha hona chahiye, taake wo patterns ko sahi tareeqe se identify kar sakein aur trading decisions le sakein.

                              Iske alawa, harmonic price chart patterns par rely karte waqt, traders ko doosre technical indicators aur market analysis tools ka bhi istemal karna chahiye taake wo apni trading decisions ko confirm kar sakein. Overall, harmonic price chart patterns market analysis ke ek aham hissa hain aur traders ke liye useful tool hain market mein kamiyabi haasil karne ke liye


                              Click image for larger version

Name:	images (3).png
Views:	46
Size:	10.1 کلوبائٹ
ID:	12893755

                              اب آن لائن

                              Working...
                              X