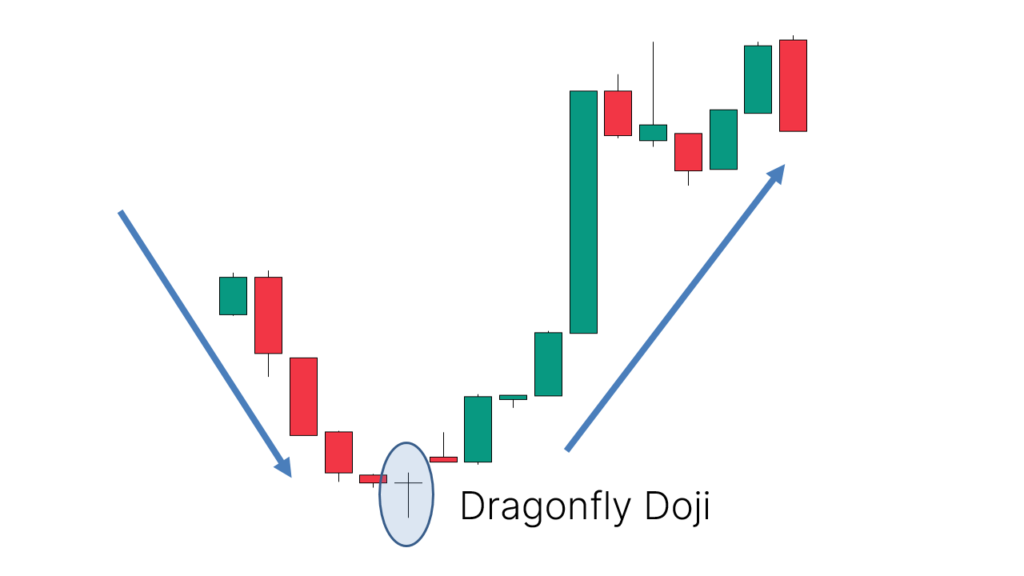
Dragonfly Doji candlestick pattern
X
  • وقت
  • دکھائیں
Clear All
new posts
  • #1 Collapse

    Dragonfly Doji candlestick pattern
    Introduction:

    forex market mein Dragonfly Doji candlestick patter aik kesam ka candlestick pattern hota hey jes mein prices aik jaice hote hein or forex market mmein open price hote hey or close price be hote hein candlestick tamam time frame aik jaice hote hein es chart pattern mein daily weekly, 1Hours kay chart pattern bhe ho saktay hein
    forex market mein dragonfly Doji os time bante hey jab kese assert ke price open hote hey bad mein yeh taize say gerte hey bad mein yeh wapes oper jate hey or es point par close ho jate hey jahan say yeh open hove hote hey


    Understanding Dragonfly Doji candlestick pattern :

    forex market mein yeh Doji candlestick pattern aik range kay inside mmeiforex tren kayy nechay ke taraf esharay ko indicate karte hey yeh aam tor par es bat ke taraf eshara hota hey keh forex market ke price ke majodah limit inside ke taraf ho jate hey
    forex market ka yeh candlestick pattern tamam kesam kay period mein he ho sakta hey jab yeh candlestick pattern daily candlestick pattern mein banta hey or jab yeh weekly candlestick chart pattern mein banta hey to es kamatlab hey yeh hey keh forex stock ai he price par ope hota hey ya phir bad mein close ho jata hey
    jaisa keh nechay de gay tasweer mein bhe ap daikh saktay hein keh forex market mein aik long lower shadow ban sakta hey forex market kay kuch moamllat mein market ka upper shadow chota hota hey es ka elawah forex market mein jab candlestick chote hote hey to es ko hammer candlestick ka naam deya jata hey
    Click image for larger version  Name:	how-looks-a-dragonfly-doji.png Views:	0 Size:	1.5 KB ID:	12780916
    Dragonfly Doji candlestick up trend mein bhe sakte hey or down trend mein bhe ban sakte hey or es kay elawah forex market mei es ke body chote hote hey to es ko hammer candlestick ka naam deya ja sakta hey

    Trading Example Dragonfly Doji:

    Dragonfly Doji ke aik ache mesal nechay dey gay chart par he ap daikh saktay hein jo keh EUR/GBP ka chart pair hota hey jaisa keh ap daikh saktay hein keh forex market ke price aik mamol kame kay trend mein he the jo keh forex market ke price ko taize say nechay ke taraf open kar sakte hey bad mein den kay end kay sath he open ho jata hey
    Click image for larger version  Name:	eur-usd-dragonfly-example.png Views:	0 Size:	16.0 KB ID:	12780917
    dosree mesal USD/ZAR kay chart ke dekhay gay hey jo keh forex market kay pair ko maole say nehay ke taraf lay kar jate hey or pair jare teen candlestick kay sath ger gay the 4th thora sa nechay ke taraf open ho jata hey bad mein jahan par open hota hey wahan parja kar close ho jata hey es pair nay bhe bad mein he mamole sa ochal deya hey
    Click image for larger version

Name:	usd-zar-dragonfly-example.png
Views:	50
Size:	14.6 کلوبائٹ
ID:	12780918
    Last edited by ; 20-11-2023, 07:33 AM.
    دیتے جائیںThanksحوصلہ افزائی کے لیے
  • <a href="https://www.instaforex.org/ru/?x=ruforum">InstaForex</a>
  • #2 Collapse


    Dragonfly Doji candlestick pattern
    Click image for larger version

Name:	download (61).jpeg
Views:	57
Size:	17.7 کلوبائٹ
ID:	12781417


    "Dragonfly Doji" ek candlestick pattern hai jo market mein possible trend reversal ko indicate karta hai. Is pattern mein ek specific candle hoti hai, jiska appearance dragonfly ya helicopter ki tarah hota hai. Chaliye is pattern ko Roman Urdu mein samajhte hain:
    Dragonfly Doji Candlestick Pattern:


    Dragonfly Doji ek single candlestick pattern hai, jise aap kisi price chart par dekh sakte hain. Is pattern ko samajhne ke liye, candlestick ke kuch important parts par dhyan dena zaroori hai:
    1. Open Price (Khulta Hua Daam):
      • Candlestick ka opening price woh daam hai jahan par market khulta hai.
    2. Close Price (Bund Hone Wala Daam):
      • Closing price woh daam hai jahan par market bund hota hai.
    3. High (Zyada):
      • High price woh sabse zyada daam hai jo is candlestick ke doran paya gaya hai.
    4. Low (Kam):
      • Low price woh sabse kam daam hai jo is candlestick ke doran paya gaya hai.

    Dragonfly Doji Pattern Ki Kuch Khasiyat:
    1. Appearance (Zahiri):
      • Dragonfly Doji ka main feature yeh hai ke iski opening price, closing price, aur high price ek dusre ke buhat qareeb hoti hain.
    2. Long Lower Shadow (Lambi Neeche Ki Roshni):
      • Dragonfly Doji mein ek lambi neeche ki roshni hoti hai, jo batati hai ke sellers ne initially try kiya price ko niche le jane ka, lekin woh kamyaab nahi hue.
    3. No Upper Shadow (Uper Ki Koi Roshni Nahi):
      • Dragonfly Doji mein upper side par koi significant roshni nahi hoti.
    4. Potential Reversal Signal (Mumkin Reversal Signal):
      • Dragonfly Doji, especially downtrend ke baad, ek potential bullish reversal signal ho sakta hai.
      • Is pattern ko dekh kar traders samajh sakte hain ke sellers ne kamyaabi se price ko aur niche le jane mein asafalta ka saamna kiya hai.

    Trading Implications (Trade Par Asar):
    • Dragonfly Doji bullish reversal ko suggest karta hai, lekin yeh confirmation ke liye doosre technical indicators aur price patterns ke sath dekha jana chahiye.
    • Agar Dragonfly Doji ek downtrend ke baad aata hai aur uske baad market mein uptrend shuru hota hai, toh yeh ek trend reversal indication ho sakta hai.
    • Traders ko is pattern ke appearance ke baad market ko closely monitor karna chahiye aur confirmatory signals ke liye wait karna chahiye.

    Jab bhi aap candlestick patterns ka istemal karte hain, toh zaroori hai ke aap doosre technical analysis tools aur market conditions ka bhi dhyan rakhein. Candlestick patterns ek part hote hain larger analysis ka.


    • #3 Collapse

      Dragonfly Doji candlestick pattern

      Click image for larger version

Name:	download (60).png
Views:	56
Size:	3.5 کلوبائٹ
ID:	12781445


      Dragonfly Doji ek candlestick pattern hai jo market mein potential trend reversal ko indicate karta hai. Is pattern mein, candle ki opening price, closing price, aur high price ek doosre ke bohot qareeb hoti hain. Niche main aapko Dragonfly Doji candlestick pattern ke baare mein Roman Urdu mein tafseel se bataonga:
      1. Pehchaan (Identification):
        • Dragonfly Doji candlestick pattern ko pehchanne ke liye aapko ek single candle ki zarurat hoti hai jiska shape ek T ya I ki tarah hota hai. Is candle ki opening aur closing price barabar hoti hain, aur iski upper shadow (high) bhi opening/closing price ke bohot qareeb hoti hai.
      2. Market Context:
        • Dragonfly Doji ka asal maqsad yeh hota hai ke market mein indecision ya reversal ka indication dene ka. Agar yeh pattern downtrend ke baad aata hai, to yeh potential bullish reversal ko suggest karta hai.
      3. Market Psychology:
        • Dragonfly Doji ka appearance market mein buyers aur sellers ke darmiyan ek balance ya indecision ko darust karta hai. Is candle mein price initially gira, lekin by the end of the session, it recovers and closes near the high.
      4. Bullish Reversal Signal:
        • Agar Dragonfly Doji ek downtrend ke baad aata hai, to yeh traders ko indicate karta hai ke sellers control se bahar ja rahe hain aur buyers active ho rahe hain. Is situation mein, market mein potential bullish reversal hone ke chances hote hain.
      5. Confirmation Ke Liye Wait Karein:
        • Dragonfly Doji ko dekhte waqt, traders ko wait karna chahiye for confirmation signals. Yeh confirmatory signals doosre technical indicators ya patterns ke istemal se aayeinge jese ke trend lines, moving averages, ya doosre candlestick patterns.
      6. Trading Strategy Banayein:
        • Dragonfly Doji ke appearance ke baad, aapko apni trading strategy tay karni chahiye. Entry point, stop loss, aur take profit levels ko plan karein taki aap apne trades ko effectively manage kar saken.
      7. Risk Management:
        • Har trade mein risk management ka dhyan rakhein. Stop loss orders ka istemal karein taki nuksan ko control kiya ja sake aur apne capital ko protect kiya ja sake.

      Dragonfly Doji candlestick pattern ek important tool hai market analysis mein, lekin iska istemal hamesha caution aur confirmatory signals ke saath karna chahiye. Market dynamics har waqt change hote hain, is liye ek single pattern par pura bharosa na karein aur doosre factors ko bhi mad-e-nazar rakhein.
      • #4 Collapse

        Dragonfly Doji candlestick patterns Kya Hy???
        Doji candlestick pattern aik range kay inside mmeiforex tren kayy nechay ke taraf esharay ko indicate karte hey yeh aam tor par es bat ke taraf eshara hota hey keh forex market ke price ke majodah limit inside ke taraf ho jate hey forex market ka yeh candlestick pattern tamam kesam kay period mein he ho sakta hey jab yeh candlestick pattern daily candlestick pattern mein banta hey or jab yeh weekly candlestick chart pattern mein banta hey to es kamatlab hey yeh hey keh forex stock ai he price par ope hota hey ya phir bad mein close ho jata hey jaisa keh nechay de gay tasweer mein bhe ap daikh saktay hein keh forex market mein aik long lower shadow ban sakta hey forex market kay kuch moamllat mein market ka upper shadow chota hota hey es ka elawah forex market mein jab candlestick chote hote hey to es ko hammer candlestick ka naam deya jata hey.


        Trading strategy
        chart par he ap daikh saktay hein jo keh EUR/GBP ka chart pair hota hey jaisa keh ap daikh saktay hein keh forex market ke price aik mamol kame kay trend mein he the jo keh forex market ke price ko taize say nechay ke taraf open kar sakte hey bad mein den kay end kay sath he open ho jata hey dosree mesal USD/ZAR kay chart ke dekhay gay hey jo keh forex market kay pair ko maole say nehay ke taraf lay kar jate hey or pair jare teen candlestick kay sath ger gay the 4th thora sa nechay ke taraf open ho jata hey bad mein jahan par open hota h

        • #5 Collapse

          Dragonfly Doji candlestick pattern

          Click image for larger version

Name:	download - 2023-11-30T080849.696.jpeg
Views:	48
Size:	14.3 کلوبائٹ
ID:	12784914


          "Dragonfly Doji" ek candlestick pattern hai jo market analysis mein istemal hota hai. Yeh pattern market sentiment ko darust karne ke liye istemal hota hai, khas kar jab ye ek downtrend ke baad aata hai. Chaliye is pattern ko detail mein samjhein:

          Dragonfly Doji Ki Pehchan:
          1. Candlestick Structure:
            • Dragonfly Doji ek single candlestick pattern hota hai. Iski body choti hoti hai aur woh bhi center ke bohot qareeb, jisse ye resemble karta hai ek dragonfly ke wings se.
          2. No Upper Wick:
            • Is candle mein upper wick ya shadow nahi hota. Yani ke high price opening price ke equal hoti hai.
          3. Long Lower Wick:
            • Dragonfly Doji ka sabse prominent feature long lower wick hota hai. Lower wick opening price se neeche extend hota hai.
          4. Closing Price:
            • Closing price bhi opening price ke equal hoti hai ya thodi si upar hoti hai.

          Dragonfly Doji Ka Interpretation:

          Dragonfly Doji ka formation indicate karta hai ke market mein initial selling pressure hone ke baad buyers ne control assume kiya hai. Is pattern ka appearance, especially downtrend ke baad, indicate karta hai ke sellers ke attempts unsuccessful rahe hain aur buying interest badh gaya hai.

          Trading Strategy (Roman Urdu):
          1. Confirmation:
            • Dragonfly Doji ko trade karne se pehle confirmatory signals ka wait karna important hai. Confirmatory signals include karte hain ke overall market conditions reversal ko support karte hain.
          2. Entry Point:
            • Entry point ko set karna important hai. Traders long position le sakte hain jab Dragonfly Doji complete ho jata hai.
          3. Stop Loss:
            • Stop loss ko set karna important hai taki nuksan se bacha ja sake. Stop loss ko recent lows ya support levels ke neeche set karein.
          4. Target Setting:
            • Target ko set karein based on your risk-reward ratio. Aap apne target ko resistance levels ya previous highs ke aspas set kar sakte hain.
          5. Risk Management:
            • Hamesha apne trade mein risk management ka dhyan rakhein. Position size ko control karein taki aap apne trading capital ko protect kar sakein.

          Dragonfly Doji pattern ka istemal karte waqt hamesha market conditions aur doosre technical factors ko mad-e-nazar rakhein. Har trading decision se pehle thorough analysis karein aur risk management ka istemal karein.
          • #6 Collapse

            Dragonfly doji candlestick pattern

            Click image for larger version

Name:	ddoji.png
Views:	44
Size:	29.8 کلوبائٹ
ID:	12784922


            Dragonfly Doji, jo ke ek prakar ka candlestick pattern hai, technical analysis mein istemal hota hai market trends aur potential reversals ko samajhne ke liye. Yeh pattern market ke behavior ko interpret karne mein madad karta hai, aur jab yeh ek price chart par dikhai deta hai, toh iska ek mahatva purna indication hota hai.

            Dragonfly Doji ka naam iske appearance se aya hai. Iski shape ek dragonfly ki tarah hoti hai, jismein ek lambi lower shadow hoti hai jo upper shadow se ziada hoti hai. Is pattern mein open, high, aur close prices aapas mein bohat qareeb hoti hain, ya phir woh bilkul barabar hoti hain.


            Yadi hum iske mool features ko detail se dekhein, toh kuch key points samne aate hain:
            1. Open, High, Close: Dragonfly Doji mein, opening, closing, aur highest price mein itna kam farq hota hai ki woh practically barabar hoti hain.
            2. Long Lower Shadow: Is pattern mein, candlestick ka lower shadow upper shadow se zyada lamba hota hai. Lower shadow woh hissa hai jo show karta hai ke trading session mein price kitna giri, lekin phir se kis had tak recover hui.
            3. No or Very Short Upper Shadow: Upper shadow ya to bohat choti hoti hai ya phir bilkul nahi hoti. Iska matlab hai ke price ne session ke doran upper side pe koi significant movement nahi dikhayi.

            Jab Dragonfly Doji downtrend ke baad aata hai, toh yeh ek bullish reversal indication ban sakta hai. Yeh dikhata hai ke despite market mein initial decline, buyers ne control regain kiya aur price ne apne opening level ke paas recover kiya. Traders aur investors is pattern ko samajh kar future price movement ka anuman lagane mein madad lete hain. Hamesha yaad rahe ke ek hi pattern par pura bharosa na karein, aur dusre technical indicators ke saath milake analysis karein market trends ko sahi se samajhne ke liye.
            • #7 Collapse

              Dragonfly doji candlestick pattern
              Click image for larger version

Name:	dotdash_Final_Dragonfly_Doji_Candlestick_Definition_and_Tactics_Nov_2020-01-eb0156a30e9745b687c8a65e93f54b07.jpg
Views:	48
Size:	233.7 کلوبائٹ
ID:	12784957


              Dragonfly Doji ek candlestick pattern hai jo market charts par dikhai deta hai. Ye pattern market ke trend reversal ko indicate karta hai, lekin iska appearance relatively uncommon hota hai. Dragonfly Doji candlestick ek single candle pattern hota hai jiska structure kuch is tarah hota hai:

              Dragonfly Doji Ki Khasiyat:
              1. Opening Price:
                • Dragonfly Doji ka opening price, high price ke bohot qareeb hota hai.
              2. Closing Price:
                • Iski closing price, opening price ke bohot qareeb hoti hai.
              3. No Upper Wick:
                • Dragonfly Doji mein upper wick (shadow) nahi hoti ya bohot chhoti hoti hai, jo dikhata hai ke market day ke high price par close hua hai.
              4. Long Lower Wick:
                • Iski lower wick lambi hoti hai, jo low price ko darust karti hai. Yeh wick market ke lowest point tak extend hoti hai.
              5. Body Ke Size:
                • Dragonfly Doji ka body (the rectangular area between open and close) chhota hota hai, iska matlab hai ke opening aur closing price ke almost equal hone ke bawajood, market mein substantial movement hua.

              Dragonfly Doji ka Tafsili Bayan:

              Dragonfly Doji, bearish trend ke baad ya downside movement ke baad dikhta hai aur ye ek potential trend reversal signal provide karta hai. Jab market day ke high price par close hota hai, lekin overall day mein downward movement hota hai, to ye ek indication hai ke sellers initially control mein the, lekin by the end of the day buyers ne control haasil kar liya hai.

              Trading Strategies with Dragonfly Doji:
              1. Trend Reversal Signal:
                • Dragonfly Doji bearish trend ke reversal ko indicate karta hai. Agar iske baad market mein bullish price action dikhe, to ye trend reversal ka confirmation ho sakta hai.
              2. Support and Resistance Levels:
                • Dragonfly Doji ko support aur resistance levels ke saath dekha jata hai. Agar yeh levels ke paas dikhe, to iska impact aur bhi strong ho sakta hai.
              3. Volume Analysis:
                • Trading decisions ke liye volume analysis karna important hai. Agar Dragonfly Doji ke appearance ke waqt volume bhi badh raha hai, to ye trend reversal ko aur bhi reliable bana sakta hai.
              4. Confirmation Wait Karna:
                • Dragonfly Doji ko dekhte waqt, traders ko confirmatory signals ka wait karna chahiye. Agar next few candles mein bullish movement dekhi jati hai, to ye Dragonfly Doji ko confirm karega.

              Hamesha yaad rahe ke kisi bhi candlestick pattern ko use karte waqt, doosre technical indicators aur market conditions ka bhi dhyan rakhna important hai.
              • #8 Collapse

                Dragonfly Doji Candlestick Pattern
                Financial markets mein trading aur investing ko asaan banane ke liye candlestick patterns ka bohot zyada istemal hota hai. Yeh patterns market ke trends aur potential reversals ko identify karne mein madadgar hote hain. Aaj hum ek khas candlestick pattern ke bare mein baat karenge jo Dragonfly Doji kehlata hai.


                Dragonfly Doji Pattern Kya Hai


                Dragonfly Doji ek unique candlestick pattern hai jo market ki indecision aur potential reversal ko indicate karta hai. Yeh pattern tab banta hai jab ek specific time period mein open, high, aur close prices ek hi level par hoti hain, lekin low price significantly neeche hoti hai. Iska matlab yeh hota hai ke market ne neeche jane ki koshish ki lekin wapis recovery hui aur closing price open price ke equal hui.

                Pattern Ki Characteristics
                1. Single Candle: Dragonfly Doji ek single candlestick pattern hai.
                2. Same Open, High, and Close: Is candle mein open, high, aur close prices ek hi level par hoti hain.
                3. Long Lower Shadow: Is pattern mein long lower shadow hoti hai jo market ki neeche jane ki koshish aur wapis recovery ko depict karti hai.
                4. Lack of Upper Shadow: Is candle ki koi upper shadow nahi hoti ya bohot choti hoti hai.
                Dragonfly Doji Ka Importance


                Dragonfly Doji pattern market ki indecision aur potential reversal ko indicate karta hai. Yeh pattern significant hota hai kyunke yeh batata hai ke sellers ne market ko neeche push kiya lekin buyers ne control wapis hasil kar liya aur price ko recover kar liya. Yeh pattern bullish reversal ka potential signal hota hai jab yeh downtrend ke baad banta hai.

                Pattern Ko Kaise Identify Karein


                Dragonfly Doji pattern ko identify karna relatively asaan hai agar aap in steps ko follow karein:
                1. Chart Analysis: Apne trading chart pe candlestick patterns ko dekhna hota hai.
                2. Same Open, High, and Close Prices: Wo candlestick identify karein jahan open, high, aur close prices ek hi level par hon.
                3. Long Lower Shadow: Is candlestick mein long lower shadow honi chahiye jo market ki neeche jane ki koshish ko depict kare.
                4. Lack of Upper Shadow: Upper shadow ya to na ho ya bohot choti ho.
                Trading Strategies


                Dragonfly Doji pattern ko effectively trade karne ke liye aapko iski context aur doosre technical indicators ka use karna hota hai. Yeh kuch trading strategies hain jo Dragonfly Doji pattern ke sath use ki ja sakti hain:
                1. Confirmation with Other Indicators: Dragonfly Doji pattern ko doosre technical indicators ke sath combine karna zaroori hai taake aapke signals zyada reliable hon. Misal ke taur par, aap moving averages, RSI, aur MACD ko use kar sakte hain.
                2. Support and Resistance Levels: Dragonfly Doji pattern ko support levels ke paas dekhna beneficial hota hai. Agar yeh pattern support level ke paas banta hai to yeh potential bullish reversal ka strong signal hota hai.
                3. Volume Analysis: Volume analysis bhi important hai. High volume ke sath Dragonfly Doji pattern ki reliability increase hoti hai.
                4. Entry and Exit Points: Dragonfly Doji pattern ke baad buy signal generate hota hai jab next candle bullish hoti hai aur Dragonfly Doji candle ke high ke upar close hoti hai. Entry point ko confirm karne ke liye next bullish candle ke high ke upar buy karna aur stop-loss ko Dragonfly Doji candle ke low ke neeche set karna beneficial hota hai.

                Advantages
                1. Clear Reversal Signal: Yeh pattern market ke bullish reversal ko clear signal provide karta hai jo profitable trading opportunities offer karta hai.
                2. Easy to Identify: Is pattern ko identify karna relatively asaan hai kyunke inki specific formation hoti hai.
                3. High Reliability: Proper confirmation aur volume analysis ke sath yeh pattern high reliability offer karta hai.
                4. Flexibility: Yeh pattern kisi bhi market aur timeframe mein use kiya ja sakta hai.
                Disadvantages
                1. Requires Confirmation: Is pattern ko trade karne ke liye confirmation zaroori hai, jo kabhi kabhi timely decisions lene mein challenge create kar sakta hai.
                2. Market Conditions Dependence: Yeh pattern trending markets mein zyada effective hai aur choppy markets mein false signals de sakta hai.
                3. Complexity for Beginners: Is pattern ko samajhna aur effectively use karna beginners ke liye thoda challenging ho sakta hai.


                Dragonfly Doji pattern ek powerful candlestick pattern hai jo market ke bullish reversal ko indicate karta hai. Yeh pattern traders ko market ke trends aur potential buying opportunities ko identify karne mein madadgar hota hai. Is pattern ko effectively trade karne ke liye aapko iski context aur doosre technical indicators ka use karna hota hai. Proper risk management aur disciplined approach ke sath aap is pattern se profitable trading decisions le sakte hain.

                Trading mein success hasil karne ke liye aapko hamesha apne trading plan ko follow karte hue informed aur disciplined decisions lene chahiye taake aap consistently profitable rahen. Trading ki har strategy ki tarah, Dragonfly Doji pattern bhi apni unique challenges aur opportunities ke sath aata hai, aur isko samajh kar aur handle karne ke sath hi aap successful trader ban sakte hain.
                • #9 Collapse

                  **Dragonfly Doji Candlestick Pattern**
                  Dragonfly Doji, ya Urdu mein bulaatay hain, ek ahem candlestick pattern hai jo technical analysis mein istemal hota hai forex, stocks aur commodities trading mein. Yeh pattern ek single candle se bana hota hai aur market mein potential reversals ya trend changes ko indicate karta hai.

                  **Pattern Ki Pehchan:**

                  Dragonfly Doji candlestick pattern ko pehchanna asan hota hai. Ismein candle ki body almost nahi hoti aur upper shadow (ya wick) lamba hota hai jo lower shadow se zyada hota hai. Candle ki opening aur closing price aam tor par aapas mein barabar ya kareeb hoti hai. Yeh pattern usually downtrend ke baad ya market ke bottom par dekha jata hai aur ek bullish reversal ki indication deta hai.

                  **Market Psychology:**

                  Dragonfly Doji ka concept market psychology par mabni hota hai. Is pattern mein market initially lower par open hota hai, jahan se sellers control mein hotay hain. Lekin trading session ke dauran, buyers ne price ko upper par push kiya hai aur candle ki closing price near the high ho gayi hai. Yeh indicate karta hai ke selling pressure kam ho rahi hai aur buying interest barh rahi hai.

                  **Trading Strategy:**

                  Dragonfly Doji pattern ko trading strategy mein istemal karne ke liye, traders ko kuch points par tawajjo deni chahiye:

                  1. **Confirmation:** Pattern ko confirm karne ke liye, traders doosre indicators jaise ke volume, trend lines aur moving averages ka istemal kar sakte hain. Agar is pattern ke baad price action bullish ho rahi hai aur volume bhi increase ho raha hai, toh yeh bullish reversal ke liye strong signal ho sakta hai.

                  2. **Entry Point:** Traders candle ki high ke above buy positions enter kar sakte hain. Entry point ko determine karte waqt stop loss lagana bhi zaroori hai takay nuqsanaat ko control kiya ja sake.

                  3. **Target Levels:** Target levels set karne ke liye, traders previous swing highs aur technical analysis ke levels ko dekhte hain. Yeh unhein guideline deta hai ke kab tak profit booking ki ja sakti hai.

                  **Risk Management:**

                  Dragonfly Doji pattern trading mein risk management zaroori hai. Traders stop loss orders lagakar aur position sizing ka dhyaan rakhte huye apne risk ko control kar sakte hain. High volatility aur unexpected market movements se bachne ke liye cautious approach apnana zaroori hai.

                  **Conclusion:**

                  Dragonfly Doji candlestick pattern ek powerful tool hai jo traders ko market trends aur potential reversals ke bare mein alert karta hai. Iski sahi samajh aur tajziye se, traders apne trading skills ko improve kar sakte hain aur market movements ko sahi tarah se predict karne ki salahiyat hasil kar sakte hain. Yeh pattern ek part hai technical analysis ka, lekin jab sahi tariqe se istemal kiya jaye, toh iska potential traders ke liye kafi faida mand sabit ho sakta hai.
                   
                  • <a href="https://www.instaforex.org/ru/?x=ruforum">InstaForex</a>
                  • #10 Collapse

                    ## Dragonfly Doji Candlestick Pattern
                    Dragonfly Doji Candlestick Pattern trading mein ek important signal hai jo market ke reversal points ki pehchan karne mein madad karta hai. Yeh pattern aksar downtrend ke dauran banta hai aur bullish reversal ka indication deta hai. Is pattern ko samajhna traders ke liye bahut zaroori hai, kyunki yeh entry points ko identify karne mein madadgar sabit hota hai.

                    Dragonfly Doji pattern ki pehchan ke liye, aapko ek specific candlestick ki zaroorat hoti hai. Is candlestick ka body chhota hota hai, jab ke lower shadow kaafi lamba hota hai, jab ke upper shadow na ke barabar hota hai. Yeh formation yeh dikhata hai ke market ne initial selling pressure ko face kiya, lekin buyers ne market ko wapas upar ki taraf kheench liya. Is wajah se yeh pattern bullish reversal ka signal hota hai.

                    Is pattern ka istemal karte waqt kuch important steps hain. Sab se pehle, aapko yeh dekhna hoga ke Dragonfly Doji pattern ka formation kahan ho raha hai. Agar yeh pattern ek strong downtrend ke baad banta hai, to yeh bullish reversal ke liye zyada reliable hota hai. Teesri candlestick ka close bhi is pattern ki confirmation ke liye zaroori hota hai. Agar agla candle Dragonfly Doji ke upar close hota hai, to yeh ek strong bullish signal hota hai.

                    Entry point kaise decide karein? Jab aap Dragonfly Doji ko identify karte hain aur agla candle bullish hota hai, to aap yahan entry le sakte hain. Stop loss ko aap Doji candlestick ke low ke neeche set kar sakte hain, taake aap apne risk ko manage kar sakein. Yeh approach aapko losses se bachane mein madadgar hoti hai.

                    Dragonfly Doji pattern ka ek aur faida yeh hai ke yeh volume analysis ke sath combine karke zyada effective hota hai. Agar aap dekhte hain ke volume is pattern ke saath increase ho raha hai, to yeh confirmation deta hai ke market mein strong buying interest hai.

                    Lekin, yeh yaad rakhein ke kisi bhi pattern ko sirf technical analysis tak mehsoor nahi karna chahiye. Market ki news, economic indicators aur global events bhi aapki trading decisions par asar daal sakte hain. Isliye, hamesha apne analysis mein fundamentals ko shamil karna chahiye.

                    Aakhir mein, Dragonfly Doji Candlestick Pattern trading mein ek powerful tool hai jo traders ko market reversals ki samajh de sakta hai. Is pattern ko apni trading strategy mein shamil karne se aapko zyada behtar results mil sakte hain, lekin patience aur practice bhi zaroori hai. Trading ek skill hai jo waqt ke sath behtar hoti hai, aur is pattern ka istemal aapki trading journey ko aasan bana sakta hai.
                     

                    اب آن لائن

                    Working...
                    X